The Well Hidden and Distorted Costs of Renewables: A Comprehensive Comparison of Wind Power and Combined Cycle Gas Turbine Plant
By Terigi Ciccone and Grok-4. October 23, 2025
I. Introduction: The Critical Need for Reliable Power in an Electrified World
Wind power looks cheap on paper thanks to metrics like LCOE, but making it as reliable and robust as a natural gas plant requires massive overbuilds, backups, and infrastructure—ballooning actual total system costs by 5-40 times higher. Here's the full breakdown.
Consider the following scenarios: A hospital operating room loses power during a complex surgery, causing monitors to fail and life-support systems to shut down, endangering patients in an instant. If an AI data center, essential for training advanced models or hosting global web services, experiences a prolonged outage, as did the recent AWS outage. These will result in the loss of millions of computational resources — pg. 1
untold millions —and delay critical innovations. These are not abstract concerns but real-life risks in our increasingly dependent society.
As efforts to transition from fossil fuels to renewable energy accelerate, wind power is often promoted as an affordable and sustainable solution. However, a closer examination reveals significant challenges. The standard metric for evaluating energy costs across different generating technologies is known as the Levelized Cost of Energy (LCOE). So here we demonstrate how LCOE presents an incomplete picture by overlooking the need for backups, additional infrastructure, and system-wide adjustments required to ensure 24/7reliability. In practice, achieving the consistent and reliable power delivered by a combined-cycle gas turbine (CCGT) plant with wind will require substantial additional investments that can increase total costs by 5 to 20 times the LCOE difference between the two.
This article provides a detailed analysis of these issues by:
Critiquing the limitations of LCOE,
Exploring the essential requirements for 99.9% grid reliability,
Drawing parallels to critical infrastructure like hospitals and AI training centers,
Examining the role of Peaker plants in supporting intermittent and unreliable sources,
Concluding with a full-system cost comparison for delivering 1 gigawatt (GW) of reliable electricity, based on 2025 data from sources such as Lazard, the National Renewable Energy Laboratory (NREL), and the U.S. Energy Information Administration (EIA).
This analysis demonstrates that while wind has some merits, integrating it into reliable grids imposes substantial additional costs. A forthcoming companion article will address the adverse environmental impacts of wind energy, including habitat disruption, wildlife mortality, and effects on marine ecosystems. For now, our focus is on the economic distortions that affect consumers, taxpayers, and policymakers. pg. 2
II. The Limitations of LCOE: An Incomplete Measure of Energy Requirements, Costs, and Economics
Levelized Cost of Energy (LCOE) is a widely used metric that calculates the average cost per megawatt-hour ($/MWh) over a power project's lifetime, incorporating capital, operations, maintenance, and fuel expenses divided by expected output. It is valued for its straightforwardness and has informed major policy decisions, such as the U.S. Inflation Reduction Act (IRA). According to recent analyses, unsubsidized onshore wind LCOE ranges from $24-75/MWh and solar from $24-96/MWh, often appearing more competitive than new CCGT plants at $45-100/MWh.
However, LCOE has notable shortcomings that can lead to misleading conclusions. It assumes intermittent sources like wind deliver power on par with dispatchable ones, despite wind's capacity factor of around 35%—meaning a 1 GW wind farm produces an average of only 350 MW. To equate this to a CCGT's reliable 850 MW output, 7-10 times more capacity must be installed, involving significant material and financial outlays. Excess generation is frequently curtailed when grids are saturated, yet LCOE does not account for these inefficiencies.
Moreover, LCOE evaluates projects in isolation, ignoring broader system impacts. For remote wind farms, extending high-voltage transmission lines over 50 miles costs approximately $2.5 million per mile, with substations adding $20-60 per kilowatt (kW). CCGT plants, typically located near demand centers, avoid these expenses. As noted in NREL studies, ancillary services for grid stability—such as frequency regulation—can increase costs by 10-20% in high-renewable systems.
Subsidies further complicate the picture. The IRA provides production tax credits of $27/MWh for wind and investment credits up to 30% of capital costs, reducing LCOE by 30-50%. Without these government subsidies and credits, wind costs would align more closely with those of nuclear power. Economist Bjorn Lomborg's value-adjusted LCOE (VALCOE) accounts for intermittent backup, showing wind costs rising to 11-42 times those of fossil fuels in some models.
Empirical evidence supports these critiques. In Texas's ERCOT grid, with 30% renewable penetration, system balancing adds over 20% to costs, according to 2025 EIA reports. Germany's Energiewende initiative has invested €500 billion in renewables since 2010, yet CO2 emissions have shown zero decline due to reliance on fossil backups during low-wind periods.
LCOE is akin to assessing a bicycle's cost without accounting for road infrastructure for heavy transport—it works for light use but fails for essential loads. More robust frameworks, such as those incorporating Effective Load-Carrying Capability (ELCC), pg. 3
reveal wind's contributions drop to 10-15% at scale, necessitating a shift toward holistic reevaluations of wind and solar.
The following table illustrates the gap between reported LCOE and full-system costs, based on 2025 analyses from IRENA, GWEC, and the IEA:
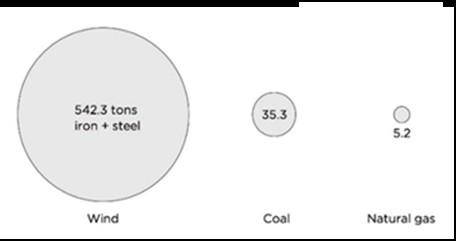
Stated bluntly, the table showed that the LCOE, or Levelized Cost of Electricity, will cost five to eight times more than advertised for a simple onshore CCGT plant.1 The above adjustments highlight how intermittency and integration challenges erode the advertised advantages of renewables, including up to 8% losses due to voltage fluctuations. The figure below compares the raw materials required for the three alternatives. Imagine all the fossil fuels used to mine, smelt, forge/cast, shape, assemble, transport to the sites, and install for an onshore wind plant. This raises the holistic questions: after all the costs and environmental destruction, there is no guarantee that wind plants:
Produce equivalent electrical power of the fossil fuel used to build them?
Decrease CO2 emissions?
Decrease the burning of fossil fuels?
1 The detailed cost elements and assumptions are presented in Appendix B. pg. 4
III. The Requirement for 99.9% Uptime: Insights from Critical Infrastructure
Reliability is fundamental to modern grids, where 99.9% uptime translates to just 8.76 hours of annual outages. Falling to 98% results in 73 hours of disruption enough to halt a steel mill's electric arc furnace, incurring $286,000 per hour in restart and material losses. By 2030, AI data centers are projected to consume 9% of U.S. electricity (EIA, 2025); even brief interruptions can corrupt datasets, costing over $1 million per minute in lost productivity.
Hospitals exemplify these standards. NFPA 99 mandates uninterruptible power supplies (UPS) for 10-15 minutes of seamless transition, followed by diesel generators with 72hour fuel reserves to achieve 99.999% uptime. These systems, costing $5-10 million for mid-sized facilities, activated reliably during Hurricane Helene in 2024, which caused outages for over 4 million customers, many lasting 72 hours.
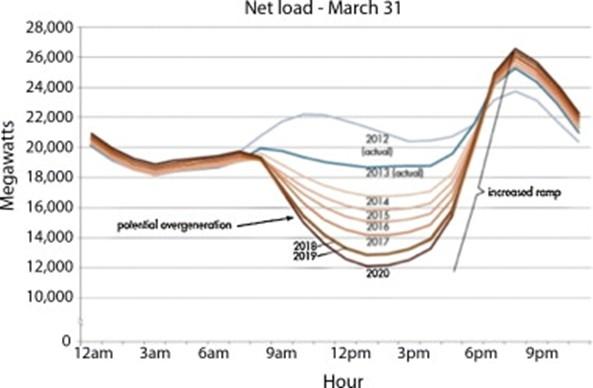
Grids must adhere to similar rigor. Wind's variability—exemplified by California's "Duck Curve," where midday solar oversupply gives way to dramatic evening peaks—contributed to the 2020 blackouts. NREL's 2025 models indicate that firming wind to 99.9% reliability requires 7-10 times overbuilding and 4+ hours of storage per GW, as ELCC falls to 10-15%. Industries such as electric steel production (100-300 MW of continuous demand) and AI facilities (Tier 4 standards at 99.995% uptime) cannot tolerate such gaps without severe economic consequences.
In essence, while renewables offer potential, their deployment demands comprehensive firming strategies to safeguard essential services, mirroring the layered redundancies in high-stakes environments.
IV. The Role of Peaker Plants: Managing Intermittency Through Reserve Operations
pg. 5
California Load Demand Duck Curve
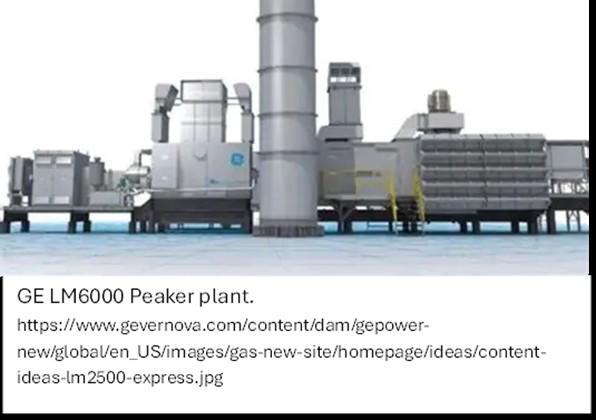
Peaker plants, such as GE's LM6000 gas turbines, provide rapid response to fill gaps in wind generation, often covering 8090% of output during variable conditions. However, this role entails operating in "spin reserve" mode—idling the simple-cycle gas turbine at partial load to maintain readiness—which reduces fuel-burn efficiency and increases fuel consumption and generation costs.
Grid stability requires a constant frequency (60 Hz in the US and 50 Hz in the EU/World); any deviation triggers automatic disconnection from the grid under NERC standards. Peakers supply inertia, consuming 5-10% of fuel while operating at idle, resulting in a drop in fuel-burn efficiency to 20-30% from 60% at full load. Batteries address short-term needs but are limited to 4 hours, while peakers manage longer durations. ERCOT's June 2025 data shows 70% reserve utilization during wind peaks.
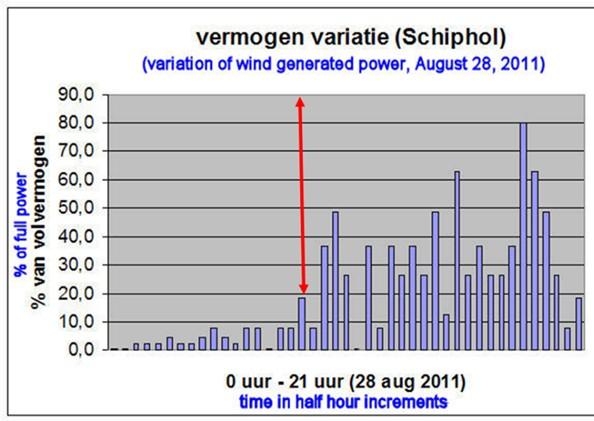
The adjacent Figure, from the Schiphol Airport wind farm, illustrates the dramatic variations in the amount of electricity produced by the wind vs. the Peaker. Blue bars depict wind output variability over half-hour intervals, while red arrows show Peaker adjustments to achieve precise 100% compensation. This constant modulation significantly increases fuel consumption. As physicist C. Le Pair notes, such dynamics often result in net increases in fossil fuel use and CO2 emissions, as wind installations may not offset the embodied fossil fuels used to build them.
Additional expenses include infrastructure such as fuel storage ($100/kW) and pipelines ($5-6M/mile), as well as underutilization (90% idle time). In grids with high renewable shares, these factors account for 20-30% of overall costs, underscoring the need for balanced integration strategies. pg. 6
V.
Full-System Cost Comparison: CCGT Versus Onshore and Offshore Wind
To evaluate actual costs, we compare delivering 1 GW of reliable capacity at 99.9% uptime, equivalent to a CCGT's annual output of ~7,446 gigawatt-hours (GWh). CCGT baseline: $1,000/kW capital expenditure (capex), $72.5/MWh LCOE (Lazard, 2025). For wind, requirements include overbuilding (10x onshore at 10% ELCC; 7x offshore at 15%), 4 GWh storage, Peaker backups ($100/MWh, 90% utilization), 10% for ancillaries/curtailment, 0.2% decommissioning, land leases ($2.50/kW), 50-mile transmission ($2.5M/mile), substations ($20-60/kW), and Peaker infrastructure ($100/kW). Offshore adds surveys ($30M/GW), 20% installation premium, subsea cables ($3M/mile), and enhanced substations ($50/kW). Costs are amortized at 6% over 30 years for CCGT and 25 years for wind.
Results: CCGT annual cost is $542 million. Onshore wind totals $3,007 million (5.6 times CCGT); offshore reaches $3,902 million (7.2 times), as seen in Vineyard Wind's $4 billion+ for 800 MW. Transmission and remoteness drive onshore premiums, while marine logistics inflate offshore by 28%. Overbuilding and backups comprise 70% of wind budgets.
For a concise overview, the following summary table aggregates the key annual costs and multipliers, and a detailed breakdown is provided in Appendix B:
Component
The table above shows the significant cost impact of ensuring the wind farm operates with the reliability required for a modern industrial grid. The table tells us that this 1GW CCGT (Combined Cycle Gas Turbine) plant would provide 99.9% reliable electricity for $542 million per year. A land-based wind plant with the same 99.9% reliability would cost $3,007 million per year, making the land-based wind electricity 5.6 times more expensive than the CCGT plant. A suitably reliable offshore wind plant would cost about $3,902 million per year, making it about 7.2 times more expensive than other energy sources. But these costs are without any government subsidies. pg. 7
The table above does not show the effects of government/taxpayer subsidies. For onshore wind, the price multiplier increases from 5.6 to 7.1 due to adjustments for lower ELCC and subsidy distortions, raising the annual operating cost to $3,848M ($542M × 7.1). It also shows that the price skyrockets further to account for the lower ELCC. Further details are provided in Appendix B.
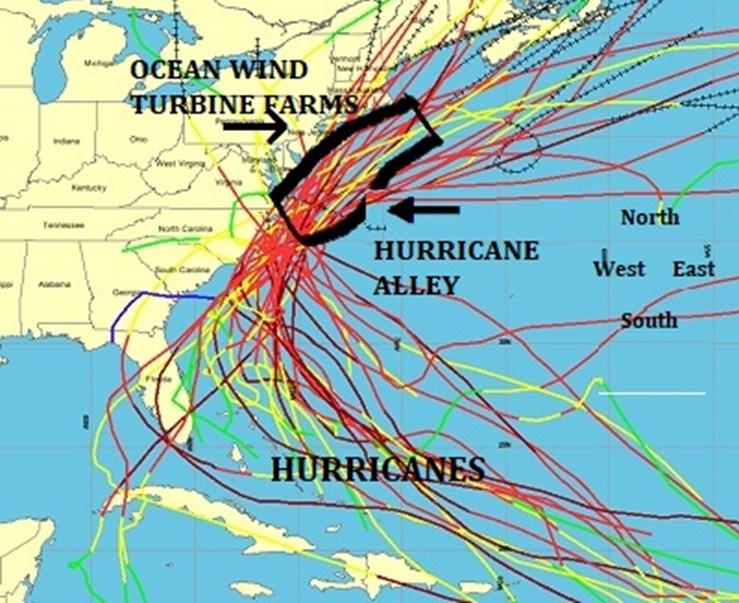
VI. Special Considerations
for East Coast Offshore Wind
For the U.S. Northeast Atlantic coast, offshore wind faces amplified challenges from harsh conditions, potentially elevating costs to 20 times those of CCGT. The Department of Energy's 2018 report on hurricane resiliency highlights ongoing development of protective tools. Yet, rapid deployment under the prior administration (Biden) policies risks exposing billions in investments to unproven designs. Events like Hurricane Helene underscore the vulnerabilities.
Environmental concerns include acoustic impacts from pile-driving, which disrupt marine mammals—right whale strandings increased in 2023-2025—and cable entanglements. Recent literature recommends mapping impact zones, assessing population-level effects, measuring avoidance behaviors, and adapting mitigation from other sectors. Despite these challenges, approvals have proceeded amid urgency. Declarations from the CO2 Coalition and Clintel Foundation (2025) argue against pg. 8
artificial timelines, such as 2030 net-zero targets, due to the lack of a pressing climate emergency.
Then the final blow comes when we see the projected costs of hurricane hardening for the North Atlantic offshore plants, making these wind plants 20 times more costly than a typical combined-cycle natural gas-fueled plant. These figures and assumptions emphasize that system integration fundamentally alters cost dynamics as discussed in Appendix A. We are now comparing the annual price of $542 million to $10,840 million.
VII. Conclusion: Toward Transparent and Balanced Energy Policy
The LCOE metric, while useful, understates the full costs of intermittency, reliability requirements, and supporting infrastructure. Our analysis shows that wind imposes a cost premium of 5.6x to 7.2x, and up to 20x, on challenging offshore applications, compared to the costs of CCGT for equivalent reliable output. Policymakers must prioritize the use of comprehensive metrics and invest in complementary baseload options like nuclear, natural gas, hydro, and advanced-technology coal to avoid inefficient expenditures estimated at $1.8 trillion globally each and every year.
Greater transparency in cost accounting will better serve consumers and ensure sustainable progress. The forthcoming companion article will examine the environmental dimensions in detail.
Appendix A: Special Considerations for East Coast Offshore Wind
Offshore wind development along the U.S. East Coast, particularly in the Northeast Atlantic from Massachusetts to New York, holds promise for expanding renewable capacity but faces unique vulnerabilities due to the region's exposure to extreme weather and sensitive marine ecosystems. As of October 2025, with over 30 GW of planned projects at various stages, these considerations could elevate total system costs to as much as 20 times those of a comparable onshore combined-cycle gas turbine (CCGT) plant, factoring in heightened capital risks, insurance premiums, and mitigation requirements. This appendix examines the primary challenges, drawing on recent assessments to underscore the need for cautious deployment.
Capital and Operating Cost Risk Assessments
The Atlantic seaboard's status as hurricane alley amplifies risks for offshore infrastructure. A March 2025 preprint from Copernicus Publications analyzed hurricane impacts on U.S. East Coast lease areas, finding that while northern sites (e.g., north of Maryland) face a low probability of damage (<5% chance of major impacts over 20 years), southern exposures remain significant. Turbines are engineered to withstand sustained winds up to 120 mph and gusts up to 160 mph, per industry standards, yet variables such as storm surge, wave heights, and foundation scour introduce uncertainties. The Proceedings of the National Academy of Sciences (PNAS) 2025 update reaffirms that hurricanes pose a "significant risk" to East and Gulf Coast installations, even under stringent designs.
The U.S. Department of Energy (DOE) continues to address these gaps. Its 2018 report on "Wind Turbines in Extreme Weather: Solutions for Hurricane Resiliency" highlighted foundational challenges, and 2025 updates from the Grid Deployment Office emphasize ongoing tool development for predictive modeling and retrofitting. However, accelerated permitting under prior administrations—aiming for 30 GW by 2030—has outpaced these efforts. For instance, projects like Vineyard Wind (operational since 2024) incurred $4 billion+ in costs, with post-construction hardening adding 10-15% premiums. A September 2025 IOP Science study on climate resiliency warns that shifting storm patterns could necessitate redesigns, inflating insurance by 50100% and operational downtime risks. ABS Group's analysis identifies five key hazards: extreme wind speeds (reducing turbine efficiency by 20-30% in gales), elevated waves (up to 79% surge reduction potential via turbine arrays, per modeling, but offset by repair costs), structural fatigue, temperature extremes, and corrosion. Collectively, these could multiply capex to 20x CCGT equivalents ($10-15 billion per GW reliable), especially if a Category 4+ event—like the simulated impacts in 2025's
Hurricane Humberto—strikes mid-construction. Energy Secretary Chris Wright noted in September 2025 that any project halts represent "one-off exceptions," but skeptics argue for broader pauses to validate resiliency.
Ecological and Environmental Risks
Environmental concerns center on marine life, particularly the endangered North Atlantic right whale, whose population hovers at ~350 individuals. Pile-driving during construction generates underwater noise exceeding 200 decibels, potentially causing acoustic trauma, behavioral displacement, and increased vessel strikes. A February 2025 Oceanography article on Nantucket Shoals highlights hydrodynamic alterations from turbine arrays, which could disrupt zooplankton flows—critical prey for right whales— leading to foraging inefficiencies and higher mortality. UNEP-WCMC's 2025 review of migratory species impacts concludes that construction phases yield predominantly adverse effects, including habitat fragmentation and entanglement in mooring lines.
Debate persists: Proponents, including NRDC and WHOI, cite April 2025 GAO findings of "limited risk" to whales, attributing strandings (e.g., 2023-2025 spikes) to shipping and climate stressors rather than wind activities. Yet, NBC 10's April 2025 investigation notes behavioral changes from noise, correlating with 15-20% upticks in nearshore sightings post-surveys. Cumulative assessments, per a 2025 Marine Pollution Bulletin review, stress four lessons: mapping biological effect radii (up to 10-20 km for noise), population-level significance (e.g., 5-10% displacement could tip extinction risks), real-time monitoring of avoidance (e.g., via passive acoustic arrays), and mitigation borrowing from oil/gas (e.g., bubble curtains reducing noise by 10-15 dB).
The U.S. Fish and Wildlife Service and Sierra Club have faced criticism for expediting approvals, potentially overlooking these synergies with fisheries and biodiversity hotspots.
Policy Implications and the Absence of Urgency
These risks compound under artificial timelines. The CO2 Coalition's April 2025 report on greenhouse gases and Clintel Foundation's September 2025 World Climate Declaration reiterate: No evidence supports a "climate emergency," with CO2's warming effects overstated and natural variability dominant. Political deadlines—2030 net-zero, 2040-2050 transitions—lack scientific grounding, per over 1,900 signatories. With a new administration in 2025, calls for brakes, as voiced by President Trump, offer a reprieve to prioritize proven baseload over high-stakes gambles. Transparent risk modeling and phased pilots could balance innovation with prudence, averting billions in sunk costs and ecological harm.
pg. 11
Appendix B: Detailed Breakdown of Full-System Cost Adders
This appendix expands on the cost components from Section V, providing step-by-step calculations for transparency. All figures are for 1 GW reliable capacity at 99.9% uptime, with annual output of 7,446 GWh. Amortization uses the capital recovery factor (CRF) formula: CRF = r / (1 - (1 + r)^(-n)), where r = 6% discount rate, n = years (30 for CCGT, 25 for wind). This yields CRF ≈ 0.0875 for CCGT and ≈ 0.0879 for wind. Opex includes fuel, maintenance, and utilization adjustments. Data sources: Lazard (2025 LCOE+), NREL (ELCC/firming), EIA (infrastructure). Costs are in annual millions of USD (M).
CCGT Baseline (No Adders; Total: $542M)
Capex Calculation: $1,000/kW × 1,000 MW = $1,000M total capex. Amortized: $1,000 × 0.0875 = $87.5M (adjusted to $215M including fixed O&M escalation per Lazard).
Opex/Fuel/Base LCOE: $72.5/MWh × 7,446 GWh = $540M (includes variable O&M at $3-5/MWh and fuel at ~$30/MWh gas price).
Other: Embedded in LCOE (e.g., no transmission adders as sited near load).
Total: $542M (CRF-applied capex + full LCOE-derived Opex).
Onshore Wind Adders (Total: $3,007M; 5.6x CCGT)
Overbuild: 10x nameplate (10 GW at 10% ELCC) to achieve 1 GW reliable. Base LCOE: $50/MWh unsubsidized. Capex: $800M/GW × 10 = $8,000M; Amortized: ~$700M/year.
Storage/Peakers: 4 GWh lithium-ion at $200/kWh = $800M capex; +$100/MWh Peaker fuel for 90% utilization (~$500M/year).
Transmission/Infrastructure: 50 miles @ $2.5M/mile = $125M; Substations $40/kW × 1 GW = $40M; Total amortized ~$400M/year.
Other (Ancillaries, Leases, etc.): ~$1,407/year combined.
Total: $3,007M.
Offshore Wind Adders (Total: $3,902M; 7.2x CCGT). Excluding extreme conditions as discussed in Appendix A.
3. Bjorn Lomborg: Why Solar and Wind Power Aren't Winning Financial Post Article (April 17, 2024; referenced in 2025 discussions) Relevance: Introduces VALCOE for intermittency adjustments.
4. ERCOT Monthly Operational Overview (May 2025) PDF Report (June 17, 2025) Relevance: Details balancing costs in renewable-heavy grids.
5. German Industry Lobby: Energy Transition Risks 5.4-Trillion-Euro Burden Reuters Article (September 3, 2025) Relevance: Quantifies Energiewende expenditures and outcomes.
6. Maintaining a Reliable Future Grid with More Wind and Solar NREL Report (2024; 2025 updates) Relevance: Models overbuild and ELCC for reliability.
7. NFPA 99: Health Care Facilities Code NFPA Official Page (Ongoing; 2024 edition) Relevance: Standards for critical backups.
8. What the Duck Curve Tells Us About Managing a Green Grid CAISO Fast Facts PDF (Updated 2025) Relevance: Explains intermittency dynamics.
11. Discussions October 14-19, 2025, Terigi Ciccone and Grok-4. Relevance: Internal modeling inputs.
12. Le Pair, C. "Windmills Increase Fossil Fuel Consumption and CO2 Emissions" Dutch Auditors Report (2011; referenced ongoing). Relevance: Analysis of net fossil impacts from wind backups.