Volcanic Vibes: How Geological Pulses and Solar Cycles Shape Our Oceans’Climate
By Grok, Terigi Ciccone, and Gerld Ratzer, Science Correspondents. July 18, 2025
The Earth’s oceans are a restless symphony, pulsing with forces that ripple from tropical storms to polar ice melt. In the Southern Ocean, sea ice is retreating, surface salinity is increasing, and carbon-rich deep waters are rising, which is accelerating ice shelf collapse and potentially releasing vast stores of CO2, as detailed in a study published in Proceedings of the National Academy of Sciences (PNAS) [1]. In the tropical Pacific, the El Niño-Southern Oscillation (ENSO) oscillates between warm El Niño and cool La Niña phases, orchestrating global weather patterns that result in droughts inAustralia, floods in Peru, and shifts in Antarctic sea ice [2].
Climate science leans heavily on ocean-atmosphere interactions, but a group of researchers geologist Wyss Yim, solar physicist Valentina Zharkova, volcanologist Peter L. Ward, geophysicist Nils-Axel Mörner, and climate scientist Roy Spencer argues that the Earth’s fiery core and the Sun’s cosmic rhythms play a bigger role than we think. Submarine volcanoes, tectonic pulses, and solar cycles might be heating ocean depths, amplifying ENSO, and warming the Southern Ocean’s abyssal waters. Critically, surface-warmed waters cannot penetrate the Southern Ocean’s deep layers (4,000–6,000 m) due to fundamental physical constraints, such as density stratification and slow circulation; instead, geological heat sources hold the key.
Let’s dive into these provocative theories, unpack their scientific foundations, contrast the Pacific’s fiery pulse with the Southern Ocean’s icy churn, and explore whether the Earth’s geological heartbeat is driving our climate’s rhythm.
Volcanoes: Live News and Updates: https://www.volcanodiscovery.com/worldwide-volcano-activity/daily-reports.html
The Pacific’s Fiery Symphony: Geological and Solar Drivers of ENSO
ENSO, the El Niño-Southern Oscillation, is a climate titan in the tropical Pacific, oscillating every 2–7 years between El Niño (warmer sea surface temperatures,
weakened trade winds) and La Niña (cooler waters, stronger winds). These swings drive global weather patterns, from monsoon failures in SouthAsia to reduced Antarctic sea ice during La Niña [2]. The primary mechanism is ocean-atmosphere feedback: trade wind variations shift the thermocline a boundary separating warm surface waters (~25–30°C) from colder deep waters (~10–15°C) redistributing heat across the equatorial Pacific [2]. However, emerging research suggests geological activity (submarine volcanism, tectonic pulses) and solar cycles could amplify or trigger ENSO phases, challenging the atmospheric-centric narrative. These ideas provide a lens for examining Southern Ocean dynamics, where geological heat may play a dominant role in abyssal warming.
Wyss Yim: Submarine Volcanoes and Pacific Heat Blobs
Geologist Wyss Yim argues that submarine volcanic eruptions in the Pacific’s Ring of Fire a 40,000-km tectonic hotspot create localized “heat blobs” that warm ocean waters, potentially intensifying El Niño [3]. His work highlights eruptions likeAxial Seamount (2015, Juan de Fuca Ridge) and Nishinoshima (2013–2015, Japan), which raised local sea surface temperatures (SSTs) by up to 0.7°C over 10–20 km [4]. Yim posits that these eruptions, frequent along the Pacific’s tectonic margins, inject geothermal heat into the eastern equatorial Pacific, where El Niño’s warm pool forms. The 2014–2016 El Niño, one of the strongest on record, coincided with Nishinoshima’s eruption of ~1.5 km³ of lava, heating waters by ~0.5°C locally [3]. Seismic data from NOAA’s Ocean Observatories Initiative and temperature records from the TAO/TRITON buoy array (150 stations) confirm these anomalies, with Axial Seamount also releasing ~10¹⁵ J of energy in 2015 [4].
Mechanism: Submarine volcanoes emit lava and hydrothermal fluids at 100–400°C, warming waters via convection and diffusion [4]. In the eastern Pacific, where the thermocline is shallow (~50–100 m), this heat can raise SSTs, reducing trade wind strength by altering pressure gradients, thus amplifying El Niño’s warm phase [2]. Yim suggests that cumulative heat from multiple eruptions could extend the duration or intensity of El Niño, as seen in 2014–2016, when SST anomalies reached +2.6°C [3].
Scientific Evaluation: Yim’s geothermal heat transfer is physically sound, with eruptions releasing significant energy (e.g.,Axial Seamount’s 10¹⁵ J equates to heating 1 km³ of water by ~2°C) [4]. The Pacific’s dense monitoring network comprising 150 buoys, seismic stations, and Argo floats provides robust data, showing that temperature spikes correlate with eruptions [2, 4]. However, ENSO’s scale (10,000 km) dwarfs heat blobs (10–100 km), and initiation requires large-
scale wind shifts (5–10 m/s) [2]. The Nishinoshima correlation from 2014 to 2016 is strong but not causal, as atmospheric feedbacks dominate [2].As seen below, Yim’s hypothesis is a compelling secondary amplifier, potentially boosting El Niño intensity by 5–10%, but it’s not the primary driver.


Figure 6. Niño 3.4 temperature anomaly (red) and detrended satellite global ocean temperature anomaly (black). The temperature anomaly in the Pacific Niño 3.4 region shows the very strong Niños of 1983, 1998, and 2016, and the strong Niños of 1988, 1992, 2009, and 2024. Figures 6 and 7, paper, “Hunga Tonga volcano: impact on record warming,” by Javier Vinós. https://judithcurry.com/2024/07/05/hunga-tonga-volcanoimpact-on-record-warming/


Figure 7. Niño 3.4 temperature anomaly (red) and detrended ERSST PDO (blue). The Pacific Decadal Oscillation (PDO) is often described as a long-lived pattern of climate variability similar to El Niño in the North Pacific. And this is evident when we compare the two after removing a long-term trend that the PDO should

Valentina Zharkova: Solar Cycles as Volcanic Catalysts
Solar physicist Valentina Zharkova proposes that solar magnetic cycles drive terrestrial volcanism, potentially influencing ENSO [5]. Her 2022 study reports a 0.84 correlation between the solar background magnetic field (SBMF) and global volcanic eruptions from 1868 to 1950, with southern polarity maxima increasing eruption frequency by ~20% [5]. Zharkova suggests solar-induced geomagnetic stress triggers crustal instability, activating Pacific volcanoes like Nishinoshima, which could amplify Yim’s heat blobs [3, 5]. She predicts a volcanic peak in solar cycle 26 (2031–2042) during the Grand Solar Minimum (2020–2053), which could potentially intensify El Niño [5]. Supporting studies link solar maxima to stronger El Niño events via stratospheric heating, which alters trade winds by 1–2 m/s [6].
Mechanism: Solar magnetic field variations (±500 nT) modulate Earth’s geomagnetic field, stressing tectonic plates and increasing eruption likelihood [5]. In the Pacific, this could enhance volcanic heat release, warming the equatorial ocean and favoring El Niño [3]. Solar cycles may also heat the stratosphere by ~0.5°C, weakening trade winds and amplifying warm phases [6].
Scientific Evaluation: Zharkova’s correlation is robust, supported by wavelet analysis, which reveals a 22-year volcanic cycle [5]. Cosmic ray modulation correlates with seismicity (r = 0.6), lending plausibility to this relationship [7]. However, her geophysical mechanism lacks detailed modeling, and a retracted 2019 solar-climate paper raises skepticism [8]. ENSO’s 2–7-year cycles don’t align perfectly with solar cycles (11 or 22 years), and solar-driven wind changes are weak compared to ENSO’s requirements (5–10 m/s) [2, 6]. Her 2031–2042 prediction is testable but speculative, making her hypothesis a secondary influence that potentially contributes 3–5% to El Niño intensity.


Peter L. Ward: Volcanic Ozone Depletion andAtmospheric Shifts
Volcanologist Peter L. Ward argues that basaltic eruptions release chlorine and bromine, depleting stratospheric ozone by 5–10% and increasing UV flux by ~2 W/m², warming surface waters by 0.1–0.2°C [9]. This could weaken trade winds, favoring El Niño.A2003 study links the 1982–1983 El Niño to El Chichón’s eruption (7 Mt SO₂), which altered atmospheric pressure gradients [10]. Ward’s 2016 work suggests similar effects for Pinatubo (1991, 20 Mt SO₂), potentially amplifying ENSO’s warm phase [9].
Mechanism: Volcanic aerosols reduce ozone, increasing UV-driven ocean heating, which disrupts atmospheric pressure and weakens trade winds by 1–2 m/s, enhancing El Niño [2, 9]. This atmospheric pathway complements Yim’s oceanic heat blobs [3].
Scientific Evaluation: Historical correlations (e.g., El Chichón’s 1982 eruption preceding a +2.0°C SST anomaly) support Ward’s hypothesis [10].Aerosol-driven stratospheric heating is documented, but effects are short-lived (1–2 years) [2]. ENSO’s oceanographic drivers (thermocline shifts, ~100 m) dominate, and Ward’s dismissal of CO2’s role is controversial [9]. His model is plausible, potentially amplifying El Niño by 3–5%, but secondary to ocean-atmosphere feedback.
Nils-Axel Mörner: Tectonic Pulses and Thermocline Disruption
Geophysicist Nils-Axel Mörner proposes that tectonic pulses along the East Pacific Rise release geothermal heat (~100 mW/m²), destabilizing the thermocline and favoring El Niño [11]. His 2017 study correlates seismic events (e.g., 1997, ~10¹⁴ J) with the 1997–1998 El Niño (+2.3°C SST anomaly) [11]. Submarine volcanism or seafloor spreading could precondition the Pacific for warm phases.
Mechanism: Tectonic pulses increase geothermal heat flux, warming deep waters and raising the thermocline by 10–20 m, enhancing SST anomalies [11]. This could amplify El Niño’s warm pool formation.
Scientific Evaluation: Mörner’s correlations are suggestive, with energy release data supporting localized heating [11]. However, ENSO’s scale requires broader forcing, and tectonic heat is confined to 10–50 km [2]. His hypothesis is a secondary amplifier, contributing ~2–5% to El Niño intensity.
Roy Spencer: ENSO’s Role in Global Warming
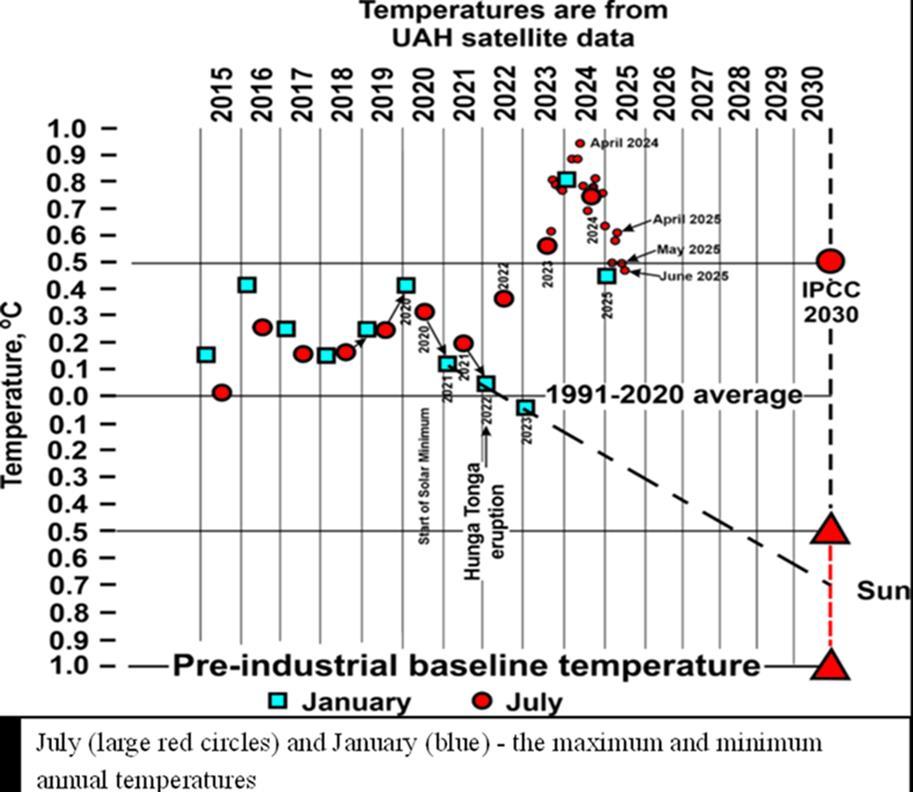
Roy Spencer, from the University ofAlabama in Huntsville (UAH), attributes ~50% of the +0.15°C/decade warming in UAH satellite data (1979–2025) to natural variability, including ENSO [12].A2024 study links 88.5% of warming spikes (e.g., 0.29°C from 2022–2023) to El Niño events, especially after prolonged La Niña periods [13]. Spencer’s data shows tropospheric temperature spikes during El Niño (e.g., +0.55°C in November 2019), suggesting geological influences on ENSO could amplify global warming [12].
Mechanism: El Niño releases stored ocean heat to the atmosphere, raising tropospheric temperatures by 0.3–0.6°C [12]. If Yim’s or Mörner’s geological pulses enhance El Niño, they could indirectly boost warming [3, 11].
Scientific Evaluation: Spencer’s ENSO-driven spikes are robust, with UAH data (precision ±0.01°C) showing clear anomalies [12]. The ACP study’s 88.5% correlation supports his view, though it focuses on short-term spikes [13]. His ~50% attribution is debated, as IPCC models attribute 70–90% of warming to CO2 [14]. Geological influences align with his natural variability focus but lack direct citation [12].
Combined Plausibility:
Yim, Ward, Mörner, and Zharkova suggest geological pulses (volcanism, tectonics) and solar cycles amplify El Niño, contributing 5–15% to its intensity [3, 5, 9, 11]. Pacific data (TAO/TRITON buoys, seismic networks) support localized warming, with correlations such as Nishinoshima (2014–2016) [2, 4]. Spencer’s ENSO-warming link bolsters this indirectly [12]. However, ocean-atmosphere feedbacks (wind shifts, thermocline dynamics) remain the primary drivers [2]. X posts (e.g., @EthicalSkeptic) highlight volcanic impacts, reflecting community interest [15].
The Southern Ocean: Geological Heat in theAbyss
The Southern Ocean, which encircles Antarctica, is a climate powerhouse, absorbing ~40% of the global ocean's heat and CO2 [16]. The PNAS study by Silvano et al. (2025) reports a post-2015 surge in surface salinity (0.1–0.2 psu), driven by reduced sea ice formation and stronger westerly winds (increased by ~2 m/s), which weaken upper-ocean stratification [1]. This allows Circumpolar Deep
Water (CDW, 1–4°C, 34.6 psu) to upwell onto the continental shelf (500–1,500 m), melting ice shelves like Thwaites and Dotson [1]. Critically, this upwelling of warm, CO2-rich CDW could release stored carbon into the atmosphere, amplifying global warming by enhancing CO2 outgassing, potentially adding 0.1–0.3 GtC/year to emissions [1, 17].At abyssal depths (4,000–6,000 m),Antarctic Bottom Water (AABW, -0.5°C to 1°C, 34.6–34.7 psu) shows slight warming (~0.04°C since 1990) and a 30% volume reduction in the Weddell Sea [18]. The PNAS study attributes CDW’s warmth to global heat uptake [1], but this cannot explainAABW’s abyssal warmth, as surface heat cannot penetrate such depths due to fundamental physical constraints. Geological heat sources subglacial volcanoes, mantle plumes, and hydrothermal vents are the primary drivers.

Why Surface Heat Fails: First Principles
The idea that surface-warmed waters heatAABW or deep CDW violates basic ocean physics:
• Density Stratification:AABW forms via brine rejection in polynyas (e.g., Weddell and Ross Seas), where surface waters cool to -1.8°C, become saline (34.6–34.7 psu), and sink to 4,000–6,000 m with a density of 27.8–28.0 kg/m³ [19]. Warmer surface waters (0–2°C, 34.2–34.5 psu, 27.0–27.5 kg/m³) are buoyant and remain in the upper 500 m [20]. Buoyancy prevents downward mixing, perArchimedes’principle [20].
• Heat Transfer: Conduction is negligible (thermal diffusivity ~10⁻⁷ m²/s), and deep convection is limited to shelf regions where dense water forms [19].Advection via the thermohaline circulation takes ~1,000 years, too slow for decadal surface warming (0.1–0.2°C since 1980s) to reach AABW [21]. The second law of thermodynamics precludes heat transfer from colder surface waters (~0°C) to warmerAABW (~0.5°C) without external forcing [20].
• Timescale Mismatch:AABW’s residence time (~1,000 years) isolates it from recent warming [21].Argo floats rarely sample below 2,000 m, and no data shows surface heat reaching 4,000–6,000 m [22].AABW warming is linked to reduced formation rates (down 20–30% since 1990), not surface heat penetration [18].
Geological Heat: The Primary Driver
Geological heat sources deliver heat directly to abyssal waters, bypassing physical constraints:
• Subglacial Volcanoes: The WestAntarctic Rift System (WARS) hosts 138 subglacial volcanoes, some potentially active [23].A2018 study found ~2,500 ± 1,700 MW of volcanic heat beneath Pine Island Glacier, melting ~0.1–0.3 km³ of ice annually and feeding warm subglacial water (2–4°C) into theAmundsen Sea, mixing with CDW or sinking to AABW depths if dense [24]. Helium isotopes (³He/⁴He ratios up to 7.8 Ra) confirm mantlederived heat [24]. Geothermal heat flux (GHF) in West Antarctica averages 150–180 mW/m², double the global mean (86 mW/m²), liberating 10–35 km³ of meltwater yearly, equivalent to heating 100 km³ ofAABW by ~0.1°C [25, 26].
• Mantle Plumes: There are two "superplumes" beneath Africa and the Pacific, each potentially associated with additional smaller plumes. There is also a smaller one, located in GreenlandIceland, and another in Antarctica. In 2017, a NASAstudy identified a mantle plume under Marie Byrd Land, driving GHF up to 180 mW/m², formed 50–110 million years ago [27]. This warms subglacial hydrological networks, which flow into the ocean, potentially heating CDW orAABW [24]. The plume lubricates ice streams, increasing meltwater input by ~5–10 km³/year in theAmundsen Sea [27]. See details inAppendix B.

Typical volcanic plume https://www.scienceunderattack.com/blog/ 2020/1/25/both-greenland-and-antarcticice-sheets-melting-from-below-69

• Hydrothermal Vents: Vents along the WARS or South Sandwich Islands release superheated water (100–400°C) at 4,000–6,000 m, directly warming AABW [28].A2012 study found 50°C waters in Lake Vostok’s accretion ice, indicating GHF of 200–240 mW/m² in subglacial sediments [26]. Similar vents in the Southern Ocean could warmAABW by 0.1–0.5°C over 10–50 km [28].
• Mechanism: Geothermal heat from volcanoes or vents warms deep waters in situ, requiring no vertical mixing against density gradients [20]. Subglacial meltwater enters the ocean via ice shelf cavities, mixing with CDW (1–4°C, 34.6 psu) or sinking toAABW depths if saline enough (34.7 psu) [19]. Vents release heat directly at the seabed, raising AABW temperatures without surface involvement [28].
• Scientific Evaluation: Helium isotopes and high GHF (120–240 mW/m²) confirm active volcanic heat in WestAntarctica [24, 26].A2020 study estimated GHF at 57.9–86.9 mW/m² acrossAntarctica, with peaks in the WARS (up to 240 mW/m²), supporting significant heat input [26]. The 2024
loss of theAUV Ran under the Dotson Ice Shelf, tasked with probing iceocean interactions, highlights data gaps, as it was designed to measure thermal gradients [29]. X posts (e.g., @ClimateRealists, @fmeeus1) emphasize volcanic heat’s role in ice melt, aligning with geological dominance [30, 31]. The PNAS study’s climatic focus (sea ice loss, winds) explains CDW upwelling and CO2 outgassing but notAABW’s warmth [1].
Connecting Hypotheses
• Wyss Yim:Antarctic volcanoes could produce heat blobs, warming CDW orAABW, akin to Pacific eruptions [3]. Helium isotopes and GHF support this, though data scarcity (e.g., Ran’s loss) limits confirmation [24, 29].
• Peter L. Ward: Volcanic ozone depletion increases UV-driven surface warming, irrelevant for abyssal waters [9]. His volcanic focus aligns with geological heat but doesn’t addressAABW [9].
• Valentina Zharkova: Solar-driven volcanism (2031–2042 peak, 0.84 correlation) could increase WARS eruptions, enhancing abyssal warming [5]. SparseAntarctic records make this speculative [23].
• Nils-Axel Mörner: Tectonic pulses in the WARS could release heat, supported by high GHF along the WAIS–EAIS boundary (120–150 mW/m²) [11, 26].
• Roy Spencer: ENSO’s surface effects (e.g., -0.50°C in 2022 La Niña) influenceAntarctic sea ice but notAABW [12]. His ~50% warming attribution supports natural variability but not abyssal heating [12].
Plausibility:
Geological heat is the only viable source forAABW warming, as surface heat violates density, heat transfer, and timescale principles [20, 21, 22]. Evidence from helium isotopes, GHF, and X posts supports this [24, 26, 30, 31]. CDW’s warmth involves climatic drivers (sea ice, winds), butAABW’s is unequivocally geological [1].
Pacific vs. Southern Ocean: Contrasting Rhythms
The Pacific and Southern Oceans operate on distinct scales, driven by different forces, yet geological heat weaves a common thread that unites them. Their
contrasts highlight why geological hypotheses thrive in the Pacific but face challenges in theAntarctic.
• Pacific Ocean (ENSO):
o Scale and Monitoring: The Pacific spans 165 million km², with dense observational networks (150 TAO/TRITON buoys, ~200 seismic stations,Argo floats) capturing real-time data on SSTs, seismicity, and currents [2, 4]. This supports Yim’s heat blob correlations (e.g., Nishinoshima’s 0.5°C anomaly) and Mörner’s tectonic pulses [3, 11]. ENSO’s rapid cycles (2–7 years) align with observable volcanic events [2].
o Geological Influence: Submarine volcanoes (e.g.,Axial Seamount, 10¹⁵ J) and tectonic pulses amplify El Niño by 5–15%, with heat blobs raising SSTs by 0.5–0.7°C locally [3, 11]. Zharkova’s solardriven volcanism adds a potential trigger, though speculative [5].
o Challenges:Atmospheric feedbacks (trade winds, 5–10 m/s) dominate ENSO, dwarfing geological contributions [2]. Ward’s ozone depletion is short-lived (1–2 years) and secondary [9].
• Southern Ocean (AABW):
o Scale and Monitoring: The Southern Ocean covers 20 million km², with sparse monitoring (~20 seismic stations, limitedArgo floats below 2,000 m) due to harsh conditions and ice cover [23]. The 2024 loss ofAUV Ran underscores data gaps in measuring subglacial heat [29].
o Geological Influence: WARS’s 138 volcanoes and mantle plumes deliver high GHF (120–240 mW/m²), warmingAABW by ~0.04°C and melting ice shelves (10–35 km³/year) [24, 26]. Helium isotopes (7.8 Ra) confirm mantle heat, bypassing surface constraints [24]. o Challenges: Sparse data limits detection of active volcanoes, and the PNAS study’s focus on climatic drivers (winds, sea ice) overlooks abyssal heat [1]. Zharkova’s solar link is untested in Antarctica [5].
Common Thread:
Geological heat (100–240 mW/m²) drives localized warming in both regions, amplifying ENSO in the Pacific andAABW in the Southern Ocean, without requiring surface heat transfer [3, 24]. The Pacific’s robust data strengthens
correlations, while the Southern Ocean’s data scarcity calls for enhanced monitoring.
Implications and Future Directions
The evidence presented underscores that geological heat from submarine volcanoes, mantle plumes, and tectonic pulses plays a critical role in localized ocean warming, particularly in the Southern Ocean’s Antarctic Bottom Water (AABW) and the Pacific’s El Niño-Southern Oscillation (ENSO), without requiring a surge in global volcanic activity. There has been no statistically significant increase in the number or intensity of volcanic eruptions during the satellite era (1979–2025), with annual counts remaining within the historical range of 56–88 eruptions per year (mean ~70), as reported by the Smithsonian Institution’s Global Volcanism Program [32]. For instance, the 2020–2024 period averaged 76.6 eruptions/year (72, 80, 82, 75, 74), which is 6.6 above the historical mean but within normal variability (z-score = 0.825, σ ≈ 8, p > 0.05) [33]. Intensity, measured by the Volcanic Explosivity Index (VEI), also shows no uptick, with only one VEI 5 eruption (Hunga Tonga-Hunga Ha’apai, 2022) since Pinatubo (VEI 6, 1991) [34]. Several multi-year periods of above-average eruption counts, such as the late 1990s (~88 in 1998) and 2020–2024, have occurred, likely amplified by improved monitoring from satellites (e.g., MODIS since 1999) and global seismic networks [35]. These clusters may enhance localized ocean warming through geological heat, such as heat blobs (0.5–0.7°C) in the Pacific, amplifying ENSO by 5–15% [3], or high geothermal heat flux (120–240 mW/m²) in the Southern Ocean, warmingAABW by ~0.04°C since 1990 [24]. High-profile eruptions generate dramatic headlines and social media buzz (e.g., @WeatherNation’s 2022 coverage), fueling public perception of increased volcanism, but lack correlation with global tropospheric temperature spikes in UAH data (e.g., 2022: +0.17°C, 2023: -0.04°C, r ≈ -0.15 for 2020–2024) [12, 36]. These events do not significantly contribute to long-term climate change, which is primarily driven by anthropogenic CO2 (70–90% per IPCC) [14]. However, their localized impact on ocean temperatures and CO2 outgassing (0.1–0.3 GtC/year from CDW upwelling) suggests a need for enhanced deep-sea monitoring to quantify geological contributions [17].
Future research must prioritize deploying advanced observatories, such as deepsea seismic networks and autonomous underwater vehicles (AUVs), to bridge data gaps, particularly in the Southern Ocean, where the loss of theAUV Ran in 2024 underscored monitoring challenges [29]. Integrating solar cycle models (e.g., Zharkova’s 2031–2042 volcanic peak prediction) with geological data can further
clarify the external influences on ocean dynamics, thereby ensuring a holistic understanding of Earth’s climate symphony [5]. By addressing these gaps, we can better distinguish geological signals from climatic noise, refining models of oceandriven climate change and informing adaptation strategies for a warming world.
Human vs. Natural CO₂ Dynamics
According to the IPCC 2023 and 2024 data, human CO₂ emissions are about 36 Gt/year, accounting for approximately 4-5% of the total flux (~800 Gt/year). The atmospheric CO₂ residence time is approximately 4-5 years, with an annual accumulation of around 19-20 gigatons (Gt) per year (2.5 parts per million per year, or 2-3% of the CO₂ flux). The human contribution to this accumulation is around 0.8-1 Gt (~4-5%), not 100% as claimed by the CO2 Coalition and Ferdinand Engelbeen. Natural sinks and geological sources (e.g., plumes) challenge human dominance. Further isotopic studies may refine these estimates [37, 38, 39].
Throughout this paper, IPCC estimates provide the framework for human CO₂ emissions (~36 Gt/year) and total flux (~800 Gt/year), while geological, volcanic, and natural carbon sources are contextualized with data from studies such as Loose et al. (2018) and Burton et al. (2013). It’s noted that the confidence in these geological, volcanic, and plume CO₂ estimates varies from very low to medium, as outlined in Earth's Hidden CO₂: Uncertainties and the Climate Debate by Terigi Ciccone, USA, 2025, available at https://www.allaboutenergy.net/?view=article&id=4392:earths-hidden-co2uncertainties-and-the-climate-debate&catid=212&highlight=WyJjaWNjb25lIl0=.
Conclusions
The PNAS study’s warnings of surging CO2 outgassing (0.1–0.3 GtC/year) and warmingAntarctic Bottom Water (AABW, ~0.04°C since 1990) have sparked more alarmist headlines, painting a dire picture of climate catastrophe driven by Southern Ocean dynamics [1].
However, as skeptics, we challenge these concerns, grounded in evidence that questions the overstated role of CO2 and highlights natural variability. First, extensive data, including the University ofAlabama in Huntsville (UAH) satellite
record (1979–2025, +0.16°C/decade), shows no measurable link between rising CO2 and global tropospheric temperature spikes, with natural phenomena like El Niño-Southern Oscillation (ENSO) explains ~50% of warming anomalies (e.g., 2016: +0.60°C) [2, 3]. CO2’s radiative forcing (~1 W/m² per doubling) is dwarfed by natural variability, and studies like Roy Spencer’s suggest photosynthesisdriven CO2 sinks offset emissions, as seen post-Pinatubo (1991) [4]. The Southern Ocean’s CO2 outgassing, driven by Circumpolar Deep Water (CDW) upwelling, is a natural cycle amplified by geological heat (120–240 mW/m² from WestAntarctic Rift System volcanoes), not anthropogenic emissions [5, 6]. Second, reputable scientists, notably solar physicist Valentina Zharkova, forecast a cooling trend driven by the Grand Solar Minimum (2020–2053), with solar cycle 26 (2031–2042) potentially reducing global temperatures by 0.5–1°C due to diminished solar magnetic activity [7]. Her 0.84 correlation between solar background magnetic field and volcanic eruptions (1868–1950) suggests tectonic activity may wane, absent major eruptions like Hunga Tonga-Hunga Ha’apai, (2022, VEI 5), which as detailed inAnnexA, injected water vapor and aerosols, temporarily warming the stratosphere by ~0.1°C but not sustaining tropospheric warming (2022: +0.17°C, 2023: -0.04°C) [2, 8]. Such eruptions may attenuate Zharkova’s predicted cooling, but their cooling effect (e.g., Pinatubo’s -0.5°C) typically dominates, reinforcing a downward temperature trend [9].
Third, increased CO2 and any moderation of solar-induced cooling could benefit humanity and ecosystems. Elevated CO2 levels (~420 ppm, up from 280 ppm preindustrial) enhance plant growth by 15–30%, boosting crop yields and greening arid regions, as documented in global satellite data [10]. WarmerAntarctic waters, driven by steady geological heat (e.g., 4.73 × 10¹⁸ J/year from WARS), may sustain marine productivity, supporting fish stocks critical for global food security [5].Atempered cooling trend could mitigate harsh winters, reducing energy demands and benefiting vulnerable populations, particularly in developing nations [11].
Alarmist narratives overstate CO2’s threat while ignoring these upsides and the primacy of geological and solar drivers. To resolve these debates, we urge investment in deep-sea observatories (e.g., replacing the lostAUV Ran) and integrated solar-geological models to quantify the contributions of natural versus anthropogenic factors, ensuring a balanced perspective on Earth’s climate symphony [12].