Earth's Hidden CO2: Uncertainties and the Climate Debate.
Terigi Ciccone, 6 July 2025
Introduction.
This is a companion article to a previously published paper, titled "Comparison of CO2 Sources and Sinks using IPCC data. More questions than answers linger". By Terigi Ciccone and Gerald Ratzer, Revised 30 June 2025, see: https://www.allaboutenergy.net/?view=article&id=4382:comparison-of-co2sources-and-sinks-using-ipcc-data&catid=212&highlight=WyJjaWNjb25lIl0=.
The purpose of this study is to challenge two cornerstone assumptions used by the IPCC (Intergovernmental Panel on Climate Change) in formulating its Global CO2 Annual Budgets, as exemplified by Figure 7.3 in the AR4 (Fourth Assessment Report).
• First, reasonably accurate estimates can be made on human-made CO2 levels; However, the IPCC estimate of geologic/volcanic made CO2 amounts appears to have confidence levels varying from very low to medium at best.
• Second, the IPCC assumes that, before the onset of the Industrial Revolution, a natural equilibrium existed between CO2 sources and sinks that prevented CO2 from accumulating in the atmosphere. Therefore, the IPCC claims that all the increased atmospheric CO2 above the Preindustrial level of 280 ppm must be attributed to human-made CO2 emissions.
Abstract.
Imagine trying to solve a puzzle when most of the pieces are lost at sea. That's the challenge scientists face when determining how much CO2 originates from Earth's geological processes, such as volcanoes and tectonic plate movements, and how it may contribute to climate change. CO2 is a gas often linked to global warming, but opinions differ sharply. Some, such as the IPCC, argue that CO2 and the greenhouse effect are the primary drivers of global warming. Others, including many reputable skeptics, believe that CO2 plays a minor role, with natural forces such as gravitational auto-compression or periodic volcanic and El Nino cycles taking the lead. This article examines what we know, what we don't know, and
what we think we know about the geological sources and sinks of CO2 on Earth. We focus on CO2 production deep within the planet and on the ocean floors The challenges in reliably measuring and estimating them only fuel the ongoing global climate debate.
PART 1. The Unknown Depths of Earth's CO2
When people think of CO2, they often picture truck exhaust or a smokestack from a factory. However, as demonstrated by IPCC measurements and estimates, the Earth itself produced and released about 95% of all atmospheric CO2 in 2005, 2023, and 2024, [i]. Natural sources include ocean releases, plants, animals, phytoplankton, and wildfires, among others. Geological sources of heat and CO2 include volcanoes, hot vents, and tectonic zones; yet, the IPCC has little reliable data on the amounts. The oceans, covering over 70% of the planet, are a vast mystery, with their floors less explored than the surface of Mars.
Take submarine volcanoes, like Axial Seamount off Oregon. It's one of the bestmonitored underwater volcanoes, with eruptions in 1998, 2011, and 2015, which have been tracked by underwater cables for earthquakes and heat. Still, we don't know how much CO2 it releases. The deep ocean is dark, under intense pressure, and challenging to study, making measurements rare and subject to significant uncertainties. Scale that up to the gigantic Mid-Atlantic Ridge, a 10,000-mile-long underwater mountain range where tectonic plates pull apart, widening the Atlantic Ocean floor [ii]. This vast, unexplored region releases unknown quantities of CO2 through lava and vents. The IPCC uses estimates of approximately 0.07–0.15 billion tons of CO2 per year for all underwater ridges worldwide, which are based on a limited number of sites and are therefore estimates or guesses at best. Most of this vast MAR and possibly dozens of other floor ridges remain unexplored and unmeasured.
Then there are subduction zones, such as those in the Pacific's "Ring of Fire," which stretches 25,000 miles around Japan, Chile, and Indonesia. The area of this behemoth is two to three times larger than the Mid-Atlantic Region. Here, one plate slides under another, pulling at times carbon-rich rocks, mountains, and mountain chains deep beneath the surface and into its fiery furnace. These materials will release vast quantities of CO2 when heated, potentially millions or billions of tons during a single event. Yet, the IPCC lacks direct data, especially from the deeper underwater zones, and uses total global estimates of 0.1–0.2 billion tons of CO2 per year, which are rough approximations guesses. This
minimal knowledge leaves big questions about Earth's geological CO2 contribution.
East Antarctica, along with its surrounding oceans, is home to one of the largest and most active volcanic regions on Earth. Over the past decade, scientists have discovered approximately 140 volcanoes hidden beneath glaciers and ice sheets, which were previously unnoticed. Additionally, the eastern part of Antarctica is being slowly torn apart from the central continent. This activity is causing significant melting at the base of the ice, creating vast subglacial rivers and freshwater lakes that drain and warm the surrounding Antarctic oceans. The melting isn't driven by sunlight or changes in CO2 levels. Air temperatures in Antarctica rarely rise above freezing, and when they do, it's only briefly along the eastern coast lasting at most a few hours a year. Similarly, Greenland's central ice sheet lies over a massive volcanic vent, with most melting occurring beneath the ice.
Volcanoes and Rising CO2: A Natural Link?
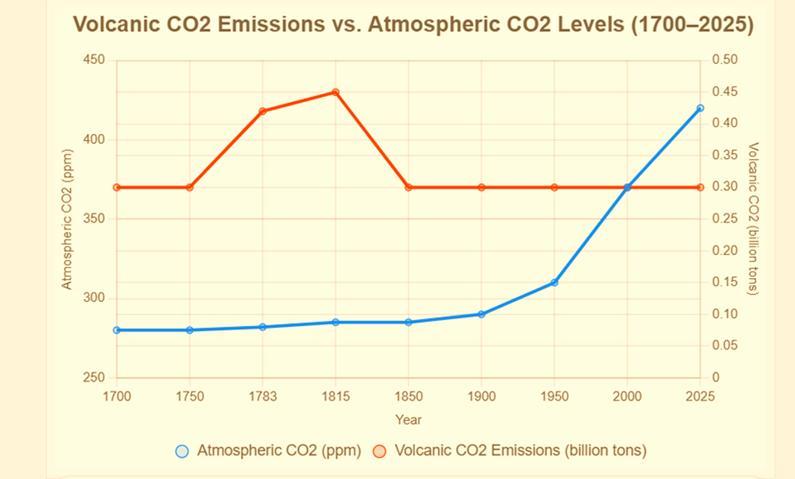
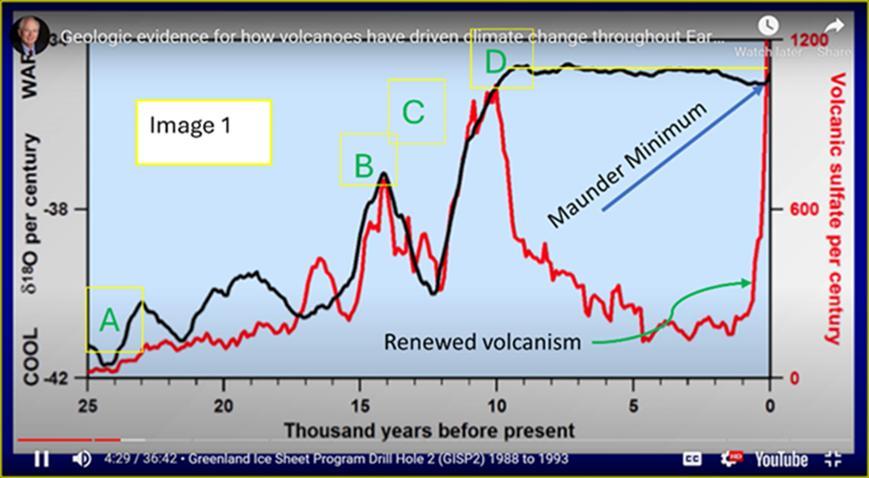
Some researchers, such as geophysicist Peter Ward, suggest that volcanic activity over centuries may release significant amounts of CO2 into the oceans and atmosphere. His chart (described below) links eruptions to temperature and CO2 changes. Others propose that increased volcanic activity, including underwater eruptions, could explain a significant portion of the rise in atmospheric CO2 (from 280 to 420 parts per million since 1800). The chart we created earlier compares this idea. This chart compares estimated volcanic CO2 emissions (spikes at Laki 1783 and Tambora 1815) to atmospheric CO2 levels (280–420 ppm) from 1700 to 2025. The IPCC currently uses background CO2 emissions of ~0.3 billion tons per year; however, submarine data are sparse, leaving considerable uncertainty about the actual impacts of volcanoes.
Ward's chart below adds yet another layer of complexity. It suggests that ocean bottom basaltic effusive eruptions, with their 2,000-2,300 °C lava, rapidly warmed the ocean waters for approximately 15,000 years, thereby releasing vast amounts of CO2 into the atmosphere in accordance with Henry's Law. This chart plots δ¹⁸O (a temperature proxy) and volcanic sulfate (a proxy for measuring volcanic eruptions) from Greenland ice cores. We observe that over the last 25,000 years, temperature spikes, such as A-D, terminated the previous ice age approximately 9,000 years ago Note also that the sulfate spike at the far right reappeared 300-400 years ago and terminated the Little Ice Age approximately 200 years ago. The chart then shows that this increased volcanism persists, indicating that the warming and CO2 releases continue to this day.
PART 2 Earth's CO2 Factory: Recycling and Creating New CO2.
The following discussions further highlight data gaps, fueling debate about the sources of CO2. Earth isn't just a passive stage for CO2; instead, it's an active factory, recycling old, naturally sequestered CO2 into fresh CO2. The Earth also produces new virgin abiogenic CO2 deep within its fiery mantle. Let's see how this works.
Recycling Through Geology
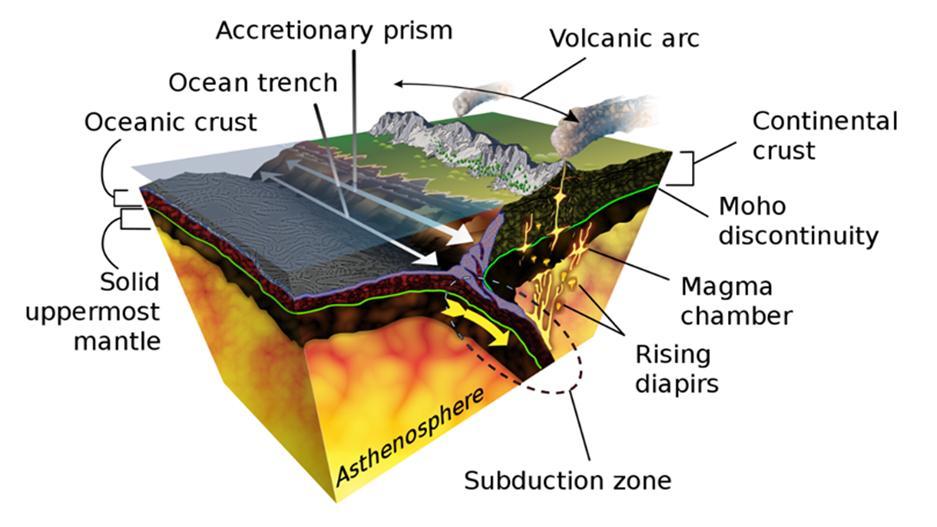
Subduction zones, such as those in the Pacific's Ring of Fire, are key hubs for Earth's carbon recycling as seen in the image below. Imagine a conveyor belt pulling slabs of ocean floor, crust, and sediments rich in carbon from ancient rocks and sea life deep underground. These sediments, often limestone, heat up to 300–700°C under pressure, releasing carbon dioxide (CO2) into the ocean depths. A significant event, such as the subduction of a limestone mountain or mountain range, could release unknown millions or billions of tons of CO2, far outpacing the steady output of spreading zones like the Mid-Atlantic Ridge. The yellow arrow in the image below indicates that the plate on the left side of the ocean trench is being subducted, sucked under the plate on the right side. Note, in particular, the resulting rising diapirs from the asthenosphere, the formation of magma chambers, and the lava that pours out during volcanic eruptions. These eruptions build volcanic mountains and mountain ranges, as well as island chains. Note also how the entire right plate moves from right to left. This is the process by which the Cascade Mountain Range was formed near the central US and then, over millions of years, migrated to the Pacific Northwest. It is also the same process that built the Hawaiian island chain, which continues to this day.
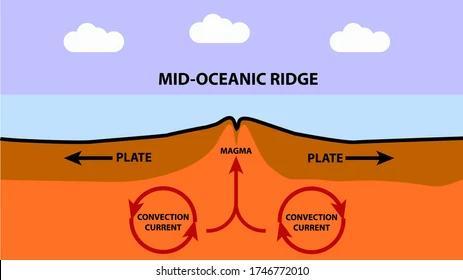
The Mid-Atlantic Ridge is an example of where tectonic and continental plates are pulled apart, and it also plays a significant role in recycling ancient carbonaceous rocks into newly remanufactured CO2. Note that the magma rises upward through
cracks, fissures, and eruptions, carrying the freshly recycled CO2 into the oceans and eventually the atmosphere Here, we observe how the plates are being pushed apart and how the ocean floor is spreading out as CO2 is released into the oceans. This CO2 may take decades, even centuries, to migrate from the ocean depths and enter the atmosphere. It's a slow process, like a drip, but its 10,000-mile length adds up to its eventual atmospheric level.
Look at the combined effects of the spreading ocean floor of the Atlantic and how it's pushing the North American Continent westward. At the same time, the subducting Pacific Ocean is sucking/pulling the North American Continent westward. These combined forces are moving the entire continent westward by one-half to three-quarters of an inch per year, and rotating it in a clockwise direction by about the same amounts and rate. Over the next several million years, the Pacific Ocean is expected to shrink notably, while the Atlantic Ocean is projected to expand slowly. Other diverging zones are happening in northwestern Africa and Antarctica.
Antarctica: Fire below and Ice above. What other notable CO2 geologic events are occurring worldwide? In the image below, we focus on West Antarctica, along with its surrounding oceans, which is home to one of the largest and most active volcanic regions on Earth. Over the past decade, scientists have discovered, thus far, approximately 140 volcanoes hidden beneath the icy oceans, coastal glaciers,
and inland ice sheets, which were previously unnoticed. Additionally, the western part of Antarctica is being slowly pulled apart and broken from the central continent. The geological forces and activity are comparable to those described above for the Mid-Atlantic Ridge. And, like the MAR, it is recycling and possibly manufacturing newly minted CO2, as discussed below.
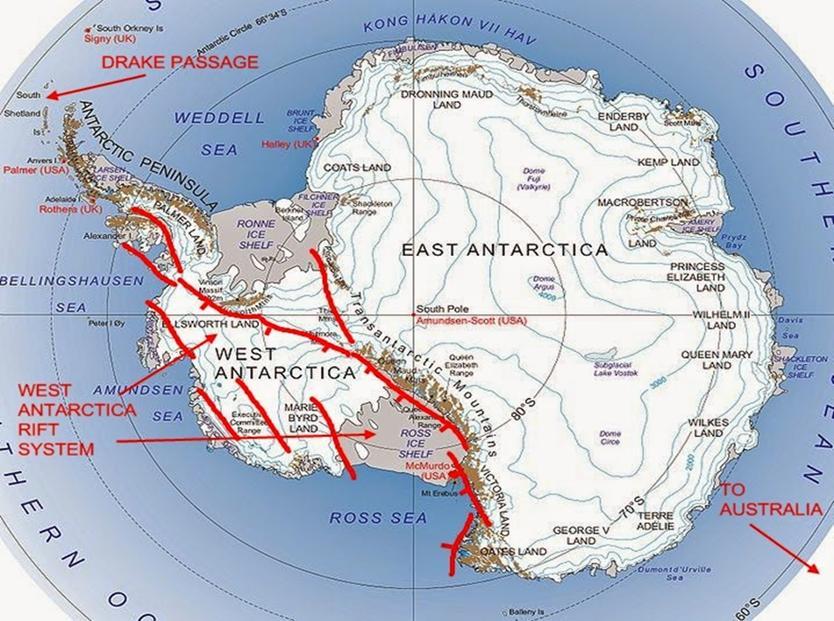
This expansive volcanic activity is causing significant melting of the ice, creating vast subglacial rivers, freshwater lakes, and warming the surrounding Antarctic ocean. This is the location where tourists go to witness and record the dramatic videos of ice cliffs breaking off and crashing into the sea. This is also the home of the "melting" Thwaites Glacier, also known as the Doomsday Glacier. This is where air and water temperatures aren't driven by sunlight, changes in atmospheric CO2 levels, or solar and albedo activities. The Air temperatures in Antarctica rarely rise above freezing, and when they do, it's only briefly and only along the coastal coast lasting at most several hours per year.
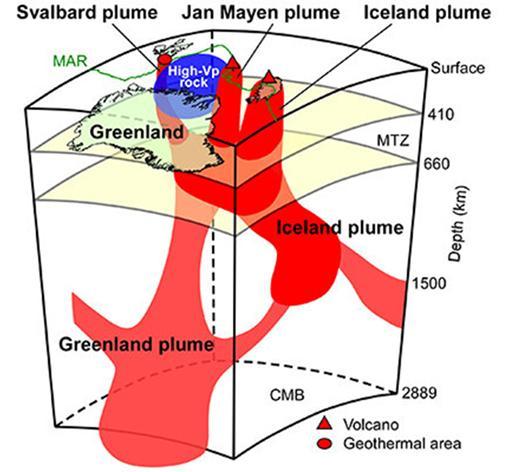
Similarly, Greenland's ice sheet rests over a massive geologically powered gas vent as seen in the image below. The central two branches stretch from eastern Greenland to Iceland, melting Greenland glaciers from below the ice and warming
the adjacent seas. The other two stretch from near coastal Canada to northwestern Europe, similarly, warming the oceans from the Canadian North Atlantic to the Nordic seas. We may never know how much CO2 this gigantic gas plume releases into the oceans and atmosphere. If we know less about the ocean bottom CO2 than we know about the surface of Mars, we can say that here we probably know more about Pluto than we do about these alien Antarctic and Greenland subglacial regions.
Creating New CO2
Here's the exciting part: Earth can also make new CO2 in its mantle, the hot layer beneath the crust. The mantle contains carbon and oxygen in minerals, and under high temperatures (1,000–2,000°C) and pressures, these elements react to form carbon dioxide (CO2) This "abiogenic" CO2 unrelated to life escapes through volcanoes or cracks. In subduction zones, the melting of rocks enhances this process. We don't know the exact amounts, but the data shows that Earth actively produces CO2, not just recycles it. This abiogenic CO2 may also be a possible explanation for the extremely high CO2 atmospheric levels in its ancient past, which was also characterized by extremely high volcanic activity.

