Strategic Placement for Beneficial Use of Dredged Material


ERDC/ CHL S R193
Coastal and Hydraulics Laboratory
Joseph Gailani, Katherine E. Brutsché, Elizabeth Godsey, Ping Wang, and Michael A. Hartman
Approved for public release; distribution is unlimited.
June 2019
The U.S. Army Engineer Research and Development Center (ERDC) solves the nation’s toughest engineering and environmental challenges. ERDC develops innovative solutions in civil and military engineering, geospatial sciences, water resources, and environmental sciences for the Army, the Department of Defense, civilian agencies, and our nation’s public good. Find out more at www.erdc.usace.army.mil
To search for other technical reports published by ERDC, visit the ERDC online library at http://acwc.sdp.sirsi.net/client/default.
Strategic Placement For Beneficial Use of Dredged Material
Joseph Gailani, Katherine E. Brutsché, Michael A. Hartman
Coastal and Hydraulics Laboratory
U.S. Army Engineer Research and Development Center
3909 Halls Ferry Road
Vicksburg, MS 39180-6199
Elizabeth Godsey
Mobile District, U.S. Army Corps of Engineers
109 St. Joseph Street Mobile, AL 36602
Ping Wang
University of South Florida Coastal Research Laboratory CHE 215
Tampa, FL 33620
Final report
Approved for public release; distribution is unlimited
Prepared for U.S Army Corps of Engineers Washington, DC 20314-1000
Under Work Unit BL015G; Dredging Operations and Environmental Research Program
ERDC/CHL SR-19-3 June 2019
Abstract
The U.S. Army Corps of Engineers and the U.S. Environmental Protection Agency are changing their perception of dredged material, from a byproduct of the dredging process to a valuable resource. The negative perception of navigation dredged material is codified under the 1972 Clean Water Act Section 502, which specifically defines “dredge spoils” as a pollutant, along with solid waste, sewage, and garbage. However, navigation dredged material is typically a mixture of sand, silt, clay, and possibly gravel. These sediments resources are critical to controlling flood risks and providing environmental benefits. This document provides details regarding the use of dredged material to support NNBF through strategic placement. Strategic placement is the process of placing sediment at one location with the expectation that hydrodynamic and possibly aerodynamic forces will transport specified classes of that sediment to desired locations. Strategic placement is a beneficial use option that may have less negative impact on the final receptor sites and often can be performed at a reduced cost when compared to direct placement (such as beach nourishment). Cost controls are critical to developing sustainable dredged sediment management plans that address the Federal Standard, which guides the disposal and placement of dredged material.
DISCLAIMER: The contents of this report are not to be used for advertising, publication, or promotional purposes. Citation of trade names does not constitute an official endorsement or approval of the use of such commercial products. All product names and trademarks cited are the property of their respective owners. The findings of this report are not to be construed as an official Department of the Army position unless so designated by other authorized documents.
ERDC/CHL SR-19-3 ii
DESTROY THIS REPORT WHEN NO LONGER NEEDED. DO NOT RETURN IT TO THE ORIGINATOR.
ERDC/CHL SR-19-3 iii Contents Abstract.................................................................................................................................... ii Figures and Tables ................................................................................................................... v Preface .................................................................................................................................... vii 1 Introduction ...................................................................................................................... 1 1.1 Background ........................................................................................................ 1 1.2 The Federal Standard ........................................................................................ 2 1.3 Traditional discharge methods 4 1.4 Objectives 7 1.5 Approach ............................................................................................................ 7 2 Strategic Placement ........................................................................................................ 8 2.1 Present state of the practice 8 2.2 Emerging practice .............................................................................................. 9 2.3 Regional Sediment Management (RSM), Engineering With Nature (EWN), and strategic placement ............................................................................... 10 3 Case Studies of Strategic Placement.......................................................................... 12 3.1 Mouth of the Columbia River (MCR) 12 3.1.1 Practice ...................................................................................................................... 12 3.1.2 Objective 14 3.1.3 Results 14 3.2 Chetco River Inlet, Oregon ..............................................................................15 3.2.1 Practice 15 3.2.2 Objective .................................................................................................................... 16 3.2.3 Results 17 3.3 The Sand Engine, The Netherlands ............................................................... 18 3.3.1 Practice 18 3.3.2 Objective 20 3.3.3 Results ....................................................................................................................... 20 3.4 Perdido Key, Florida 20 3.4.1 Practice ...................................................................................................................... 20 3.4.2 Objective 21 3.4.3 Results 22 3.5 Fort Myers Beach, Florida 25 3.5.1 Practice 25 3.5.2 Objective .................................................................................................................... 26 3.5.3 Results 26 3.6 Egmont Key, Florida ........................................................................................ 29 3.6.1 Practice 29 3.6.2 Objective 32 3.6.3 Results ....................................................................................................................... 32
ERDC/CHL SR-19-3 iv 3.7 Coos Bay, Oregon ............................................................................................ 35 3.7.1 Practice 35 3.7.2 Objective .................................................................................................................... 36 3.7.3 Results 37 3.8 Mobile Bay, Alabama ...................................................................................... 38 3.8.1 Practice 38 3.8.2 Objective 40 3.8.3 Results ....................................................................................................................... 41 3.9 Harwich Haven, England 42 3.9.1 Practice ...................................................................................................................... 42 3.9.2 Objective 44 3.9.3 Results 44 3.10 The Mud Motor, Wadden Sea, The Netherlands 45 3.10.1 Practice 45 3.10.2 Objective .................................................................................................................... 45 3.10.3 Results 46 3.11 Horseshoe Bend Island, Louisiana ........................................................... 47 3.11.1 Practice 47 3.11.2 Objective 49 3.11.3 Results ....................................................................................................................... 49 4 Implementation of Strategic Placement Plan (SPP) ................................................. 51 4.1 Developing an SPP 51 4.2 Developing a Conceptual Site Model (CSM) ................................................. 53 4.3 Selecting a site 55 4.4 Performance metrics 56 4.5 Demonstration ................................................................................................. 57 4.5.1 Modeling 57 4.5.2 Monitoring ................................................................................................................. 61 5 Conclusions .................................................................................................................... 63 References ............................................................................................................................. 65 Unit Conversion Factors ....................................................................................................... 69 Report Documentation Page
Figures and Tables
Figure 9. Example profile (R52) in the control area west of the berm at Perdido Key, Florida (based on data from Brutsché et al. 2015). Dates are given in MMYY format.
Figure 10. Example profile (R58.5) in the berm project area at Perdido Key, Florida (based on data from Brutsché et al. 2015). Dates are given in MMYY format. .......................................................................................................................................
Figure 11. Alongshore sediment grain size in the berm project area at Perdido Key, Florida
ERDC/CHL SR-19-3 v
Figures Figure 1. Flowchart of strategic placement for beneficial use evaluation. ........................... 4 Figure 2. Schematic of different
and
options. ...................................... 6 Figure 3. Placement areas near the MCR, Washington-Oregon border). 13 Figure 4. Chetco
...................................................................................................................................... 16
19 Figure
2015. ..................................................................................................................................... 19 Figure 7.
....................... 21
22
disposal
placement
nearshore CWA placement sites in vicinity of Chetco River Inlet, Oregon.
Figure 5. The Sand Engine demonstration project in The Netherlands, immediately after construction in 2011. Pools were intentionally designed for habitat.
6. The Sand Engine demonstration project in The Netherlands, aerial view in
Location of sediment placement area near Perdido Key, Florida.
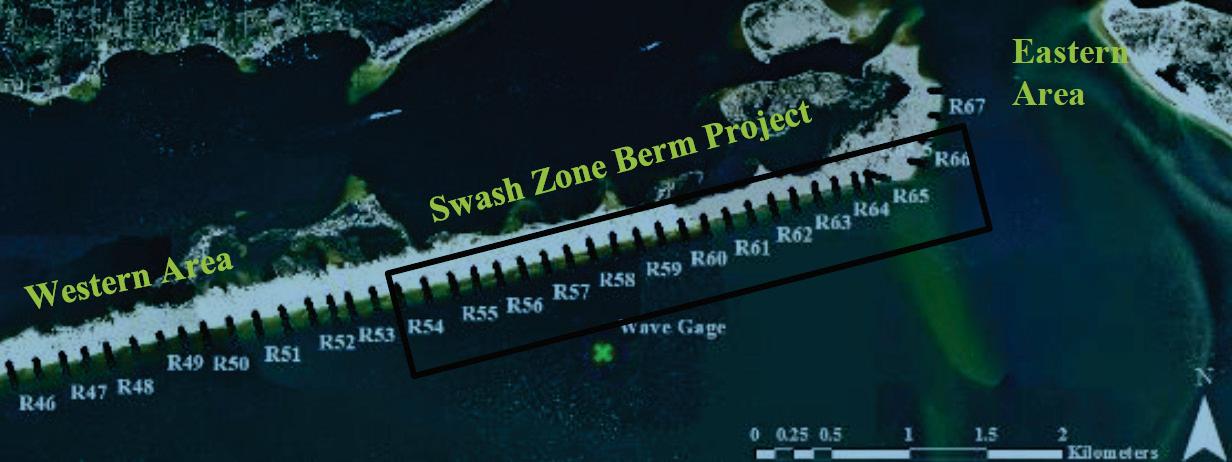
Figure 8. Beach profile transect locations at Perdido Key, Florida (from Brutsché et al. 2015). Black box indicates location of swash-zone berm.
23
23
(from Brutsché et al. 2015). 24
12. Location map and beach profile transect locations at For t Myers Beach, Florida (from Brutsché et al. 2014). Star indicates approximate alongshore location of nodal point. ........................................................................................ 25 Figure 13. Example profile within the berm project area during the first 2 years after placement at Transect FMB32, Fort Myers Beach, Florida. Dates are given in MMYY format. ....................................................................................................................... 28 Figure 14. Example profile within the berm project area during the second 2 years after placement at Transect FMB32, Fort Myers Beach, Florida. Dates are given in MMYY format. 28 Figure 15. Spatially averaged cross-shore grain size distribution in the berm project area at Fort Myers Beach, Florida. ............................................................................. 29 Figure 16. Placement areas near Egmont Key, Florida. ....................................................... 30 Figure 17. Egmont Key, Florida, with transect lines. 31 Figure 18. Northern elevation profile on Egmont Key, Florida. 33 Figure 19. Southern elevation profile on Egmont Key, Florida............................................. 33 Figure 20. Coos Bay, Oregon, placement sites. ..................................................................... 35 Figure 21. Coos Bay, Oregon, active littoral zone ODMDS F-NS. ......................................... 38 Figure 22. Mobile Bay, Alabama, channel placement sites. 40
Figure
ERDC/CHL SR-19-3 vi
replacement program. ............................................................................................................. 43 Figure 24. The Mud Motor,
Netherlands,
................................................................................................................ 46 Figure 25. Horseshoe Bend Island, in the Atchafalaya River, Louisiana. 48 Figure 26. Horseshoe Bend Island, Louisiana, in (a) 2008, (b) 2009, (c) 2010, (d) 2011, (e) 2012, (f) 2013, and (g) 2014. ................................................................................ 50 Figure 27. SPP outline for BUDM. ........................................................................................... 51 Figure 28. Pictorial schematic for CSM for SPP development. 54 Table Table 1. Fine grain sediment characteristics at Egmont Key, Florida. 34
Figure 23. Subtidal placement locations for dredged sediment at Harwich Haven, England (data from Simpson et al. 2005), selected as part of the sediment
Wadden Sea, The
disposal and placement locations.
Preface
This study was conducted for Headquarters, U.S. Army Corps of Engineers (HQUSACE), Washington, DC, by the U.S. Army Engineer Research and Development Center (ERDC), Vicksburg, MS, under the Dredging Operations and Environmental Research (DOER) Program (Work Unit BL015G), a part of the USACE Navigation Research, Development, and Technology (RD&T) portfolio. At the time of this investigation, the DOER Program Manager was Dr. Todd S. Bridges, ERDC Environmental Laboratory.
The work was performed by the ERDC Coastal and Hydraulics Laboratory (CHL), Flood and Storm Protection Division, Coastal Processes Branch and by the ERDC CHL Navigation Division, Coastal Engineering Branch. At the time of publication of this ERDC/CHL special report, Dr. Cary Talbot was Chief, Flood and Storm Protection Division, and Ms. Ashley Frey was Chief, Coastal Processes Branch; Dr. Jacqueline Pettway was Chief, Navigation Division, and Ms. Lauren Dunkin was Chief, Coastal Engineering Branch. Mr. Kareen El-Naggar was the HQUSACE Acting Chief, Navigation Branch and Navigation Business Line Leader. Mr. C. Edward Wiggins was the ERDC Technical Director for Navigation RD&T.
The Deputy Director of CHL was Mr. Jeffrey R. Eckstein, and the Director of CHL was Dr. Ty V. Wamsley.
The Commander of ERDC was COL Ivan P. Beckman, and the Director of ERDC was Dr. David W. Pittman.
ERDC/CHL SR-19-3 vii
1 Introduction
1.1 Background
Many areas within coastal, lake, and riverine systems suffer from a sediment deficit due to upstream impoundments, navigation channels, changing land use, and other anthropogenic activities. These sediment deficits are compounded by water level/sea level rise and coastal subsidence. A sediment deficit exists where a region or feature loses sediment because the incoming sediment load is less than the exiting sediment load. Dams and navigation channels frequently act as sinks for incoming sediment that would otherwise balance sediment deficits that degrade regional resources and require ongoing sediment input. Anthropogenic activities can also change the composition (grain size distribution) of sediments entering and exiting a region, impacting the distribution of sediment composition within a region. Sediment composition impacts sustainability of resources that support ecosystem health and reduce flood risk, including beaches, dunes, river banks, wetlands, and aquatic habitat.
Ninety to ninety-five percent (%) 0f the over 200 million cubic yards (Mcy) of material dredged annually by the U.S. Army Corps of Engineers (USACE) does not require special handling due to contamination and is therefore available to support aquatic and nearshore resources that require sediment input (Welch et al. 2016). Beneficial Use of Dredged Material (BUDM) is the intentional placement of dredged sediment to provide economic, environmental, and societal benefits (Bridges et al. 2015). The USACE and the U.S. Environmental Protection Agency (USEPA) perceptions of dredged material are evolving from a byproduct of the dredging process to a valuable sediment resource.
Dredged material can be a source of sediment to support coastal, estuarine, and riverine systems and can reduce sediment deficits. The perception of navigation dredged material as pollution is unfortunately codified under the 1972 Clean Water Act (CWA) Section 502, which specifically defines “dredge spoils” as a pollutant, along with solid waste, sewage, garbage, and other materials (https://www.epa.gov/cwa-404/clean-water-actsection-502-general-definitions). As perceptions of clean dredged sediment evolve, specific laws and regulations may also evolve. However, until these laws
ERDC/CHL SR-19-3 1
are changed, existing regulations associated with the CWA must be addressed when evaluating beneficial use options.
Solutions to sediment deficits may include directly placing dredged sediment in areas where it is needed. Direct placement strategies include beach nourishment and wetland construction. However, often the cost of performing this action is exceedingly high, the sediment is not appropriate for the area where it is to be placed, or the environmental impact of placing sediment at such a rapid, high rate are unacceptable. Indirect, or strategic placement in a water body, can be a cost-effective alternative that permits natural sorting of sediments to occur. If properly executed, the desired sediments from the sorting are transported toward the receptor site, and undesired sediments are moved away from this site. The potentially lower cost of strategic placement solutions when compared to direct placement is important when addressing the Federal Standard, discussed further below. In addition, strategic placement permits introduction of sediment to the receptor site at a rate more representative of natural processes than direct placement.
1.2 The Federal Standard
To understand the process of selecting and obtaining approval for a strategic placement site, one must understand the most important guideline that has supported dredged material disposal and placement since 1975. The Federal Standard, which is used for evaluating cost of dredging, is defined in USACE regulations as “the least costly dredged material disposal or placement alternative (or alternatives) identified by USACE that is consistent with sound engineering practices and meets all federal environmental requirements,” including those established under the CWA and the Marine Protection, Research, and Sanctuaries Act. Leastcost alternatives that meet the Federal Standard (often referred to as the base plan) are often disposal without any benefit to the regional sediment system. Alternatives that are more costly than the base plan generally require non-federal cost-share partners.
The Federal Standard has typically been interpreted as the alternative that accomplishes the project’s navigation purpose (USEPA/USACE 2007a). However, solutions that address only the navigation project missions may not always be deemed as sound engineering practices, especially in regions with sediment deficit. Sound engineering practice permits room for alternative beneficial dredged material management solutions that meet the
ERDC/CHL SR-19-3 2
Federal Standard. Still, BUDM has generally required a cost-share partnership with local sponsors (states, local government, port authorities, non-government organizations [generally non-profit citizens’ groups organized at the local, state, or national level – such as The Nature Conservancy]) unless a BUDM solution can be accepted as the base plan. Note that USACE has been provided by Congress with limited authority to fully fund BUDM solutions that do not meet the Federal Standard. (The reader is directed to USEPA/USACE (2007a) for description of opportunities to use this USACE authority.)
Cost sharing for BUDM is only required for a fraction of the incremental (additional) project cost above alternatives that meet the Federal Standard. The non-federal partner(s) must agree to pay 25% of the incremental cost above the Federal Standard (USEPA/USACE 2007) for most BUDM solutions. For example, “Improvement of the quality of the environment” (Section 1135 of Water Resources and Development Act [WRDA] 1986 [USACE 1992a]) and “protection, restoration or creation of aquatic and related habitats” (Section 204 of WRDA 1992 [USACE 1992b]) each require this non-federal cost-share partner to cover part of the incremental cost (USEPA/USACE 2007a).
This cost-share requirement should not be considered a lack of federal commitment to BUDM. The National Dredging Team (NDT) is a federal interagency group that facilitates communication of dredging issues among federal agencies to ensure that channel dredging projects are timely, cost effective, and promote environmental restoration goals. The NDT promotes interagency information exchange, issue identification, and resolution of issues affecting dredging (NDT 2003). The NDT serves to promote the implementation of the National Dredging Policy, which was implemented in the 1990s to improve national dredging strategies to improve the dredging process. The NDT developed an agenda for future practice (NDT 2003), which recognizes the importance of BUDM to sustainable dredging practice, and specifically states that funding and research should be increased to expand BUDM practice.
The NDT also recognizes the need for BUDM to become a priority at all levels of management and planning (NDT 2003). As proposed by the NDT, USACE and USEPA have developed guidance on how BUDM can be incorporated into USACE maintenance and new work dredging projects (USEPA/USACE –
https://www.epa.gov/sites/production/files/201508/documents/role_of_the_federal_standard_in_the_beneficial_use_of_dredged_material.pdf ).
ERDC/CHL SR-19-3 3
This online guidance is a living document (updated intermittently), which includes descriptions of the Federal Standard and cost-share requirements. In addition, USACE and USEPA maintain a technical framework for evaluating dredged material alternatives that incorporates BUDM in the alternative selection process (USEPA/USACE 2004).
1.3 Traditional discharge methods
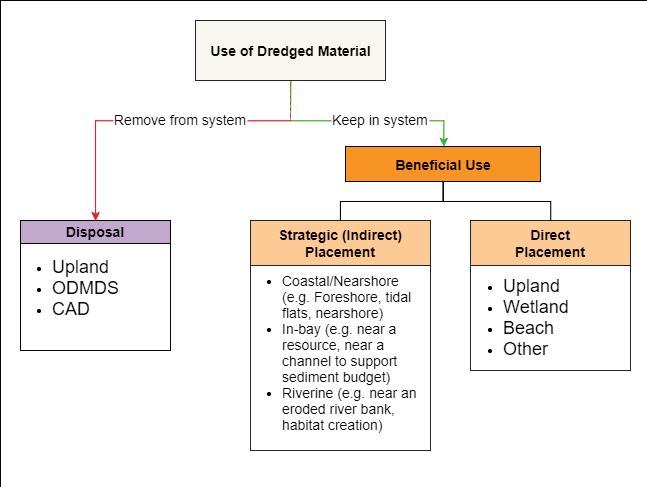
Discharge of dredged material can be divided into two categories: (1) disposal and (2) placement (or beneficial use). Disposal options include Confined Aquatic Disposal facilities, upland disposal facilities, sidecasting, and offshore open water disposal sites (typically outside the littoral zone) (Figure 1). The dredged sediments placed at these sites are not intended to provide benefit to the USACE Civil Works primary missions (navigation, flood risk management, or environmental restoration). Note that some disposal options do provide coincidental benefits, but this is generally not the intent of these options, and their designs are not optimized to increase benefits. Disposal options that may provide coincidental benefits include some offshore placement (improved substrate for habitat) and riverine side-casting (maintaining sediment in the regional system).
ERDC/CHL SR-19-3 4
Figure 1. Flowchart of strategic placement for beneficial use evaluation.
Disposal sites must be approved by regulatory authorities (including USEPA) and have a defined capacity. Many disposal sites are either nondispersive (Confined Disposal Facilities or upland sites) or only marginally dispersive (Open-water Dredged Material Disposal Sites [ODMDS]). Some dredged sediment will be removed from marginally dispersive sites by natural hydrodynamic forces, especially during storm events. However, placement rates at these sites are generally greater than the natural sediment removal rate, and these sites will eventually reach capacity. In many areas of the United States, disposal facilities are nearing capacity (Bailey et al. 2010). Authorization of new disposal sites is a long and often contentious process, which can be costly.
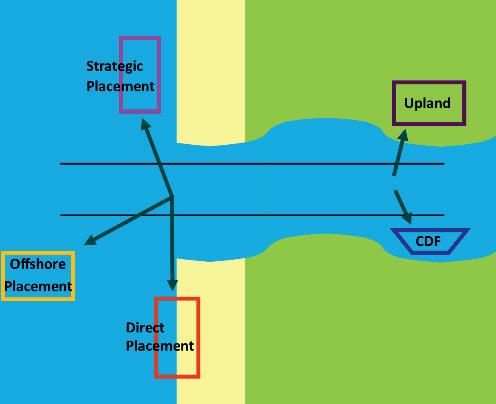
An alternative to disposal is placement. Beneficial use, or placement, can be further divided into two sub-categories: (1) direct placement and (2) strategic placement. Direct placement (Figure 2) involves placing sediment as a permanent or semi-permanent feature that will support navigation, flood risk reduction, or environmental restoration missions (Figure 2). The intended benefits of direct placement occur at the site where the sediment is placed. Examples of direct placement include beach nourishment, fisheries/habitat reef creation, wetland construction, dredge hole or borrow pit fill, land reclamation, and/or island creation. Approximately 20%–25% of sediment dredged by the USACE annually is used beneficially (USEPA/USACE 2007b), with the majority placed directly. A recent study estimates that 33% of sediments dredged from USACE coastal navigation channels are used beneficially 1 .
ERDC/CHL SR-19-3 5
1 Elko, N., W. Robertson, and L. S. Lillycrop. In publication. Mapping Datasets and Tools for Quantifying Coastal Navigation Sediment Placement and Implementation of Regional Sediment Practices from 1988–2017. Vicksburg, MS: U.S. Army Engineer Research and Development Center.
While direct placement is beneficial, it frequently is not a sustainable solution for dredged material management. Once a project is complete, there is no capacity for additional dredged material unless the site is dispersive (for example, most beach nourishments will eventually recede over time and are, therefore, considered dispersive). Costs of direct placement are frequently much greater than the base plan under the Federal Standard because of additional sediment handling required for construction, hauling-distance costs to the placement site, and additional permitting requirements.
Strategic placement, as discussed herein, represents placement of dredged sediments in a manner such that sediments can be redistributed by natural forces from the placement location to receptor sites of interest where sediments are needed. Presently applied strategic placement solutions include nearshore berms, placement of dredged sediment in the dispersive littoral zone, and placement of fine-grained sediment near wetlands to increase suspended solids entering the wetland. Advantages of strategic placement over disposal include maintaining sediment in the regional
ERDC/CHL SR-19-3 6
Figure 2. Schematic of different disposal and placement options.
system, support to USACE flood risk reduction and environmental restoration missions, and sustainable dredged material management solutions. Advantages of strategic placement over direct placement often include reduced cost, reduced disruption to human use of resources (such as beaches), and reduced short-term impact to ecology. Advantages, procedures, and examples of strategic placement are explored herein.
1.4 Objectives
The objectives of this investigation are to document the benefits of strategic placement as a sustainable dredged material management solution and to provide examples where it is presently practiced. These examples provide guidance for the development of a Strategic Placement Plan (SPP) for sustainable dredged material placement sites that will benefit the USACE navigation, flood risk management, and environmental restoration mission areas. Nearshore feeder berms are the most obvious example of strategic placement, but as will be described herein, other alternatives exist. Strategic placement can be less costly than direct placement and in some cases, can be considered the least-cost sound engineering and environmentally acceptable alternative required under the Federal Standard. Strategic placement has the advantage of potentially allowing sediment to naturally sort through hydrodynamic processes, causing desirable sediments to reach the receptor while less desirable sediments are transported out of the project area. The ultimate objective of this study is to provide guidance for the implementation of strategic placement sites to support sustainable Regional Sediment Management (RSM) and Engineering With Nature (EWN) projects. These strategic placement sites will also enhance Natural and Nature-Based Features (NNBF) that will maximize benefits and manage risk.
1.5 Approach
Eleven prototype case studies were analyzed where strategic placement practices were employed. These locations cover a wide range of environmental conditions where strategic placement sites were developed in coastal regions, bays and estuaries, and riverine areas. The specific practice applied in each location is described. The objective of the strategic placement at these 11 locations is reviewed. The successful results at these prototype strategic placement sites are discussed, resulting in guidance for other similar sites where dredged material may be strategically placed for beneficial use.
ERDC/CHL SR-19-3 7
2 Strategic Placement
Strategic placement is the process of placing sediment at one location with the intent that one or more of the sediment classes (typically sand, silt, and/or clay) will be transported by hydrodynamic or hydraulic (and possibly aerodynamic) forces to a receptor area that needs sediment. An example of strategic placement frequently applied by USACE districts is feeder berms where non-beach quality, but predominately sandy, dredged sediment, is placed in nearshore berms with the intent that sand will migrate onshore while fine sediment will transport offshore.
Strategic placement solutions are sustainable because the sites are dispersive and can be re-used for additional dredged sediment placement in the future. These solutions are in alignment with the USACE EWN strategy of developing win-win solutions that support both navigation and other mission areas in a cost-effective manner (Bridges et al. 2014). These solutions also align with the USACE RSM strategy that aims to optimize the use of sediments across multiple projects to increase value and benefits while reducing short-term and/or lifecycle costs, resulting in overall healthy systems (Lillycrop et al. 2011). Both EWN and RSM strive to harness the power of nature to transport sediments to regions or projects in need of sediment.
2.1 Present state of the practice
Strategic placement has been practiced in the USACE for decades. Many of these strategic placement practices have been enacted without non-federal cost share because strategic placement alternatives can often occur near the dredging operation and then use hydrodynamic forces to perform transport from the placement site to the designated receptor site(s). This method avoids additional costs often incurred during direct placement. However, engineering guidance is needed to optimize solutions. Many present strategic placement solutions are least-cost alternatives that do not optimize management of the dredged sediment as a resource such as near-channel placement sites intended to feed littoral zones but are engineered as least-cost alternatives, which may not maximize benefits.
ERDC/CHL SR-19-3 8
2.2 Emerging practice
Strategic placement solutions have a range of forcing conditions over which they must effectively transport sediment from the placement location to an identified resource (Bridges et al. 2015). Strategic placement of sandy sediments has been practiced for decades, and multiple monitored examples exist to support practice at new sites (Hamm et al. 2002). This practice can be optimized by an improved understanding of the physical hydrodynamic and sediment transport processes of the system, typically obtained through field data collection and numerical or physical model predictions. Experience from present practice, site-specific field data, and predictive models can be combined to optimize placement strategies for sandy sediments. Placement optimization is intended to increase the delivered value of the project to, for example, the flood risk reduction mission by increasing the volume of strategically placed sediment that reaches the receptor site.
Strategic placement of predominately muddy sediments is less practiced, monitored, and documented. These sediments can be utilized to maintain needed sediment loadings to wetlands including marsh platforms, aquatic vegetation, tidal channels/creeks, mudflats, etc. However, fine-grained sediments are more dispersive than sand because they can remain suspended in the water column for much greater time periods (hours or days). In addition, muddy sediments are often perceived as more harmful to aquatic habitat because of increased turbidity (often a misconception because many critical habitats/species require turbid water to survive). Demonstrated sediment budget deficits in muddy environments are forcing interested parties to investigate muddy dredged sediment as a resource for the regional system.
An example of strategic placement for muddy sediments is in the nearshore flood dominated entrance to a tidal creek network that feeds marshes. Appropriately placed sediment will allow flood currents to pull sediments into the dendritic creek network while simultaneously avoiding much of the offshore migration that would occur if the material were placed in the ebb-dominated channel. This process will recharge the marsh with fresh sediment that it would otherwise not receive. In addition, the sediment is recharged in a manner and dosing similar to how nature would deliver the sediment, with sand moving as bedload and silt/clay moving in suspension.
ERDC/CHL SR-19-3 9
While this practice seems appealing, there is concern over the effects of increased turbidity and sedimentation on resources outside the marsh but near the placement site. The ability of fine-grained sediments to remain in suspension for long durations (hours to days) will result in increased turbidity both inside and outside the targeted marsh. These concerns must be addressed. Ongoing studies as discussed in this report are evaluating benefits of strategic placement of muddy sediments near marshes. In addition, improved monitoring techniques and a better understanding of effects of turbidity on species can be used to support muddy sediment strategic placement demonstration projects.
2.3 Regional Sediment Management (RSM), Engineering With Nature (EWN), and strategic placement
Strategic placement falls within the practices of RSM, “a systems approach using best management practices for more efficient and effective use of sediments in coastal, estuarine, and inland environments”
(http://rsm.usace.army.mil/). RSM is implemented collaboratively with federal, state, and local agencies; academia; and non-governmental organizations to apply RSM principles and practices across multiple projects that optimize the use of sediment while supporting sustainable solutions to the USACE navigation, flood and coastal storm risk management, and environmental restoration missions. The resulting data, tools, stakeholder relationships, and RSM strategies can assist with emergency management operations regarding sediment management. While RSM strategies increase value and benefits, an additional goal is to reduce short-term and/or life-cycle costs. RSM recognizes sediment as a valuable resource. Strategic placement, with the emphasis on BUDM and sustainable, economically acceptable solutions to dredged material management, is an integral part of the USACE RSM mission (Lillycrop et al. 2011).
Strategic placement also falls within the EWN initiative. The EWN initiative enables more sustainable delivery of economic, social, and environmental benefits associated with water resource infrastructure
(http://el.erdc.usace.army.mil/ewn/). EWN is the intentional alignment of natural and engineering processes to efficiently and sustainably deliver economic, environmental, and social benefits through collaborative processes. EWN supports sustainable development of water resources infrastructure through solutions that beneficially integrate engineering and natural systems. Recent advances in the fields of engineering and ecology provide opportunities to combine these fields of practice into a single collaborative
ERDC/CHL SR-19-3 10
and cost-effective approach for infrastructure development and environmental management.
Strategic placement permits nature to provide the forces for movement of sediments from one location to another that might otherwise increase project costs. In addition, strategic placement permits the sorting of sediments during the transport process and can therefore be designed to allow only the beneficial sediments to reach the designated receptors. The rate (dosing) at which sediments reach the receptor is generally less harmful to the flora and fauna than direct placement of sediments. Strategic placement also supports sustainable NNBF solutions that support flood risk management and environmental restoration missions of the USACE (Bridges et al. 2015).
ERDC/CHL SR-19-3 11
3 Case Studies of Strategic Placement
The following section describes several case studies where strategic placement practices were employed. The first seven case studies involve placement of predominately sandy sediment in coastal regions. This is followed by three case studies for placement of mixed (muddy) sediment in bays or estuaries. The final case study involves riverine strategic placement.
3.1 Mouth of the Columbia River (MCR)
3.1.1 Practice
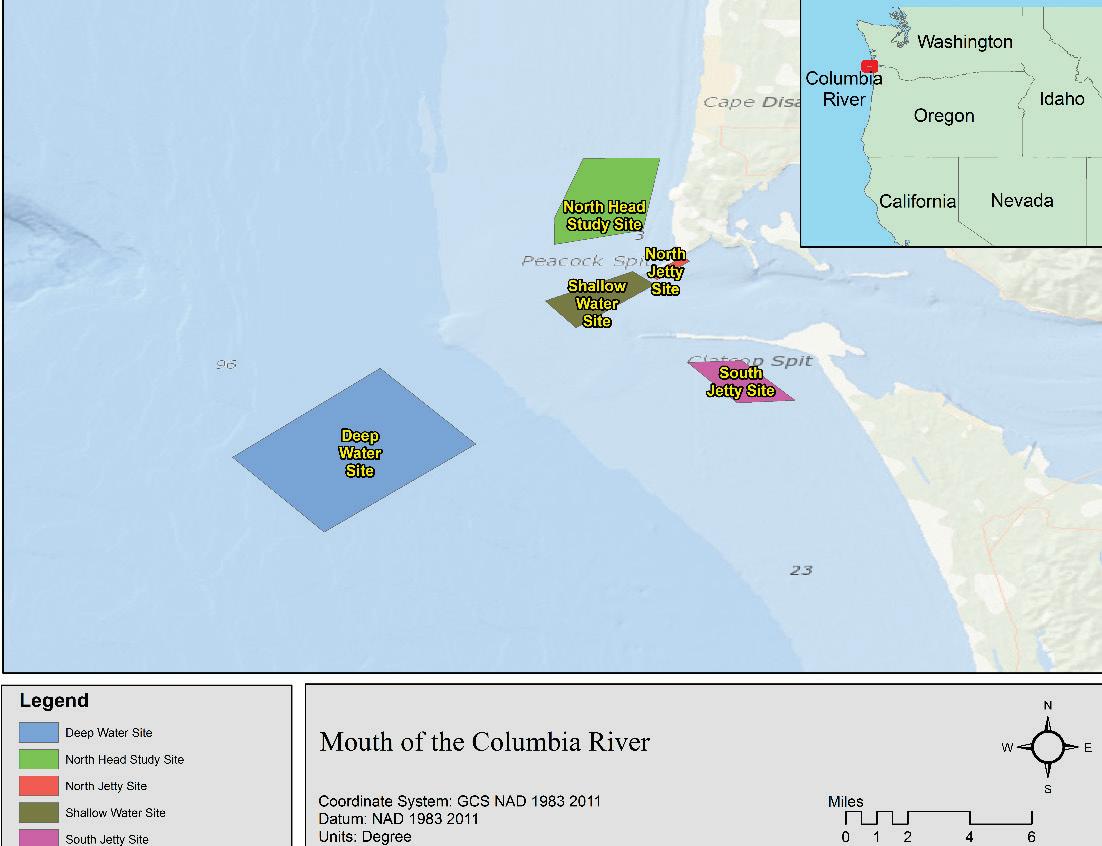
The Mouth of the Columbia River (MCR) (Oregon-Washington border) is one of the most energetic coastal inlets in the world. Longshore transport rates near the MCR are millions of cubic yards per year (Moritz et al. 2011). Shoreline recession and increased nearshore water depths (morphology recession) are occurring at several locations both north and south of the inlet (Byrnes and Li 1998; Gelfenbaum et al. 1999). Shoreline recession can be attributed, in part, to anthropogenic activity including sediment retention (dams), navigation channel dredged material disposal practices, and jetty construction (Gelfenbaum et al. 1999). The 6-mile-long MCR entrance channel requires annual dredging. Dredging volumes vary year to year. These volumes have ranged from 3–5 Mcy per year (Mcy/year) over the past 2 decades. Dredged material is predominately fine sand with less than 3% silt/clay (USACE 2012).
The USACE Portland District (NWP) is incrementally implementing longterm plans to maximize dredged sediment strategic placement for the purpose of nourishing littoral zones both north and south of the inlet (USACE/USEPA 2016). All placement is performed using ocean-going hopper dredges due to the high-energy conditions at the MCR. While this limits operational water depths for strategic placement, high wave energy at these sites will disperse any placed sand.
NWP presently utilizes three beneficial uses sites and one ODMDS (approximately 5.7 miles southwest of the end of Clatsop Spit) (Figure 3). Strategic placement beneficial use sites, Shallow Water Site (SWS) and North Jetty Site (NJS), have been used since the 1990s. These sites are intended to feed the littoral system nourishing the shoreface just north of the jetty. Placement at NJS is also intended to stabilize the jetty in this
ERDC/CHL SR-19-3 12
erosional zone. Strategic placement beneficial use South Jetty Site was proposed in 2003 and first utilized in 2012. The purpose of SJS is to address sediment deficits south of the jetty by supplying sand to the littoral zone. Placement of limited volumes (0.2 Mcy) were performed in 2012–2015. Volumes were limited, and placement was monitored to evaluate mounding during the placement process and impact on benthic ecology, particularly Dungeness crabs.
Full-scale use of the site was initiated in 2016. NWP practice is to maximally utilize these strategic placement sites each year if ocean conditions permit safe operation in shallow water. Excess amounts are placed at the ODMDS (Deep Water Site in Figure 3). Volumes permitted at each beneficial use site are pre-defined due to concerns over wave focusing, expected dispersal rates, and damage to benthic habitat. Permitted volumes at each site are described in USACE/USEPA (2016). Therefore, even if these three sites are filled to capacity each year, over 1.0 Mcy will be disposed at DWS on an annual basis. To increase volumes placed in the littoral zone, NWP has proposed an additional strategic placement site north of the jetty. The North Head Site (NHS) (Figure 3), if
ERDC/CHL SR-19-3 13
Figure 3. Placement areas near the MCR, Washington-Oregon border
approved, will provide additional sediment to the shoreface north of the jetty and reduce disposal amounts at the DWS. NHS site capacity is currently being evaluated (USACE/USEPA 2016).
3.1.2 Objective
NWP is developing an RSM strategy to improve the use of sediments for the MCR as well as the Lower Columbia River. These strategies are being developed in collaboration with the Lower Columbia River Solutions Group. The MCR strategy will maximize use of the direct and strategic placement sites in the nearshore to support the littoral zone sediment budget. Specific management strategies described in USACE/USEPA (2016) are to (1) control mounding, (2) minimize impacts to marine resources, (3) minimize interference with other uses of the oceans, (4) beneficially use dredged material when practical, and (5) utilize safe and efficient dredge operations. Benefits include an improved littoral budget, reduction in ecological degradation caused by morphology change (increasing nearshore water depths), and stabilization of the north jetty.
To achieve these objectives, NWP is negotiating with interested parties, including USEPA, to maximize nearshore strategic placement of dredged material. The 2016 dredging season was the first time that full use of the SWS was implemented. NWP is presently in negotiation to designate an additional site north of the MCR (NHS, Figure 3) for nearshore placement. Approval of this site will increase strategic littoral zone nourishment and decrease disposal volumes at the DWS. In addition, the NWP objectives are to demonstrate benefits of the strategic placement sites through monitoring of far-field fate.
3.1.3 Results
Regulatory restrictions require low-relief features at MCR beneficial use sites. As will be described in later text, some strategic placement mounds are migrating features that can be tracked as they move toward the designated receptor site. MCR sites include high wave energy, strong currents, and rapidly changing morphology of both the placed and native sediment beds. Therefore, morphology monitoring to evaluate benefits is not feasible. Pre-dredging morphology is performed each year to evaluate the volumes that can be placed at the NJS, SWS, and SJS. This annual monitoring has indicated these nearshore placement sites are dispersive and available each year for additional placement. Fluorescent sediment
ERDC/CHL SR-19-3 14
tracer studies were performed in 2011 to evaluate transport directions of sediments placed at the SWS and SJS.
These studies demonstrated that most sediments placed at 40-50 feet (ft) of water depth at these sites will nourish the active littoral zone, and some fraction will transport onto the beach. These studies also indicated that small amounts of tracer from the SWS will return to the navigation channel. Transport from the SWS was greater and more directionally coherent toward the north than that of the SJS tracer. Tracer was dispersed over a large domain, indicating that sand from the strategic placement sites will travel long distances. These tracer studies are being utilized by NWP to develop strategies for approval of, and placement at, additional strategic placement sites, such as the NHS.
3.2 Chetco River Inlet, Oregon
3.2.1 Practice
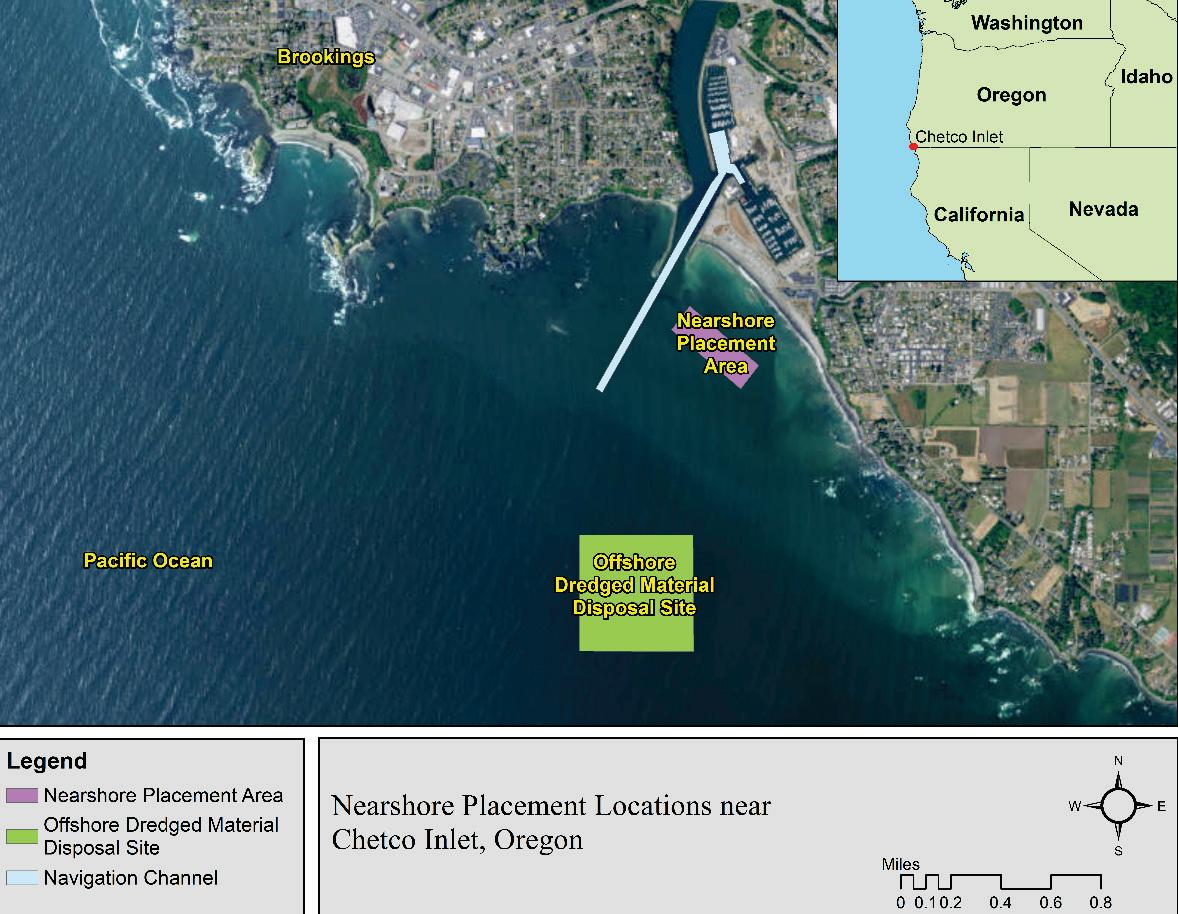
The Chetco River drains into the Pacific Ocean at Brookings in southern Oregon approximately 6 miles north of the California border (Figure 4).
The USACE NWP maintains a 14 ft deep navigation channel to the Port of Brookings Harbor. North and south jetties protect the navigation channel entrance. On average, 37,000 cubic yards (cy) of sandy sediment (with some gravel) is dredged annually. Prior to 1996, USACE had used an ODMDS, located 1 mile offshore in water depth of 60–80 ft, exclusively for the placement of dredged sediment from the Chetco navigation channel.
ERDC/CHL SR-19-3 15
The Chetco nearshore placement site has been used since 1996 when the site was first permitted under Section 404 of the CWA. The permitting action was initiated by the NWP in collaboration with the local officials and the State of Oregon for the purpose of placing sand, dredged from the Chetco federal navigation channel, along the littoral zone (nearshore area) south of the Chetco Inlet. The Chetco 404-CWA site provides an EWN/RSM solution to dredged material management at the inlet that meets the Federal Standard cost guidelines.
3.2.2 Objective
The objective of placing dredged sand within the active nearshore zone (less than 25 ft deep) of the Chetco 404-CWA site is to allow shoaling waves and littoral currents to transport the placed sand shoreward during the period following dredged material placement, thereby abating the active shoreline erosion that was affecting the shoreface area and infrastructure south of the inlet. The Chetco 404-CWA nearshore site is 1,425 ft long × 440 ft wide and is located in water depth ranging from 16 ft to 26 ft with respect to mean lower low water (MLLW) (Figure 4). The Chetco CWA site is approximately
ERDC/CHL SR-19-3 16
Figure 4. Chetco nearshore CWA placement sites in vicinity of Chetco River Inlet, Oregon.
1,500 ft offshore from the mean higher high water line and 500 ft south of the Chetco federal navigation channel. Within this spatial context, the site is affected by both tidal circulation associated with Chetco River estuary and littoral processes of the Oregon seacoast.
When the CWA site was initially permitted in 1996, it was anticipated that the site would be used within its operational capacity (approximately 25,000 cy/year) to receive dredged material, with the balance of dredged material being placed within the ODMDS. Based on evaluations performed in 1995–96, it was determined that the government hopper dredge Yaquina could access the entire site during varying phases of the tide and that the dredge could place each load of dredged material (~850 cy/load) in a manner that would minimize vertical accumulation of dredged material on the seabed (mounding).
Prior to using the CWA site, evaluations of dredged material placement indicated that the maximum height of deposition would range from 0.25 ft/load to 0.5 ft/load. An operational limit of 3 ft total vertical deposition of dredged material placed within the Chetco CWA site is permitted during a given dredging season. During a typical placement, the dredge Yaquina first uses areas within the CWA that are closest to shore, then uses areas farther out, as dredged material accumulates within the site, so that the hopper dredge will not ground on deposited material. Use of the CWA site can only be achieved with a small-class nimble hopper dredge like the Yaquina, due to the shallow water depth of the site.
3.2.3 Results
The Chetco nearshore site has been used during 13 of the last 17 years, with nearshore placement typically occurring during July–August. Between 1996 and 2013, the average annual volume of dredged sand placed within the site has been 21,000 cy. The total cumulative volume placed within the Chetco nearshore site to date has been 362,000 cy. The site’s operational capacity has been assessed each year, based on the prior year’s use and estimated littoral transport affecting the site. Based on the present dimensions of the CWA site, an upper limit for the site’s current operational capacity is estimated to be approximately 40,000 cy/year. Methods used to gain insight of dredged material behavior at Chetco include differential analysis from year-to-year bathymetry surveys.
ERDC/CHL SR-19-3 17
Evaluation of hydrographic surveys of the bathymetry within the Chetco nearshore (CWA) site indicate that the seabed within and adjacent to this site is still eroding despite the addition of 362,000 cy since 1996. The seabed along the southern extent of the project area has eroded 2–3 ft since 1996 while the seabed along the project’s northern extent has accumulated 1–2 ft. Despite continued seabed erosion and shoreline recession to the south, NWP maintains that continued placement within the CWA site is required to support the littoral sediment system. The working hypothesis is that the seabed and shoreface inshore of the Chetco Inlet (for an alongshore distance of 1,500 to 2,500 ft) would have experienced a greater erosional trend without placement at the CWA site.
3.3 The Sand Engine, The Netherlands
3.3.1 Practice
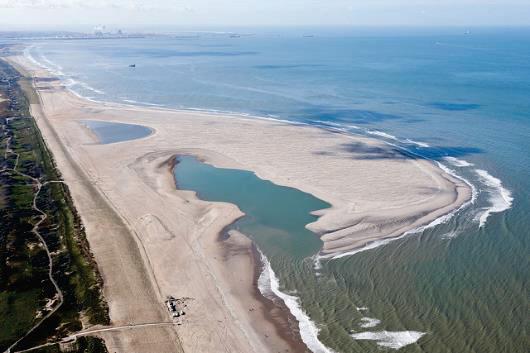
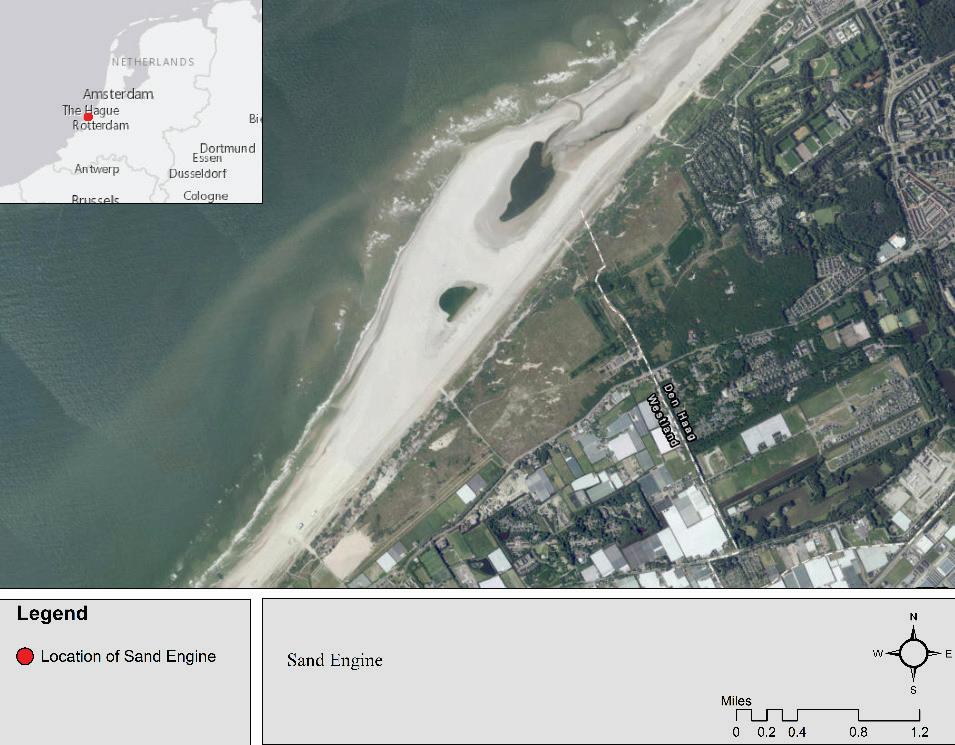
The Dutch coast is naturally receding. The Dutch government has made a commitment to maintain the coast against the encroachment of sea level rise. This is predominately accomplished with typical beach nourishment projects or more recently, through shoreface nourishment projects. A new method was tested in 2011 where a peninsula was constructed at a location on the south coast (Figure 5) and was predicted to feed a 12.4-mile stretch of coast. A 27.5 Mcy mega-nourishment (referred to as the Sand Engine) was used to form the peninsula, which was 0.6 miles wide and 1.2 miles long, with 10,000 acres of land created (http://nlintheusa.com/sand-engine/). The shape of the peninsula is approximately parabolic with regions for habitat formed within the peninsula (Figure 6). Predictive models were implemented in the design phase to optimize location, transport rates, and habitat value of the peninsula (Mulder and Tonnen 2011).
ERDC/CHL SR-19-3 18
ERDC/CHL SR-19-3 19
Figure 5. The Sand Engine demonstration project in The Netherlands, immediately after construction in 2011. Pools were intentionally designed for habitat.
Figure 6. The Sand Engine demonstration project in The Netherlands, aerial view in 2015.
3.3.2 Objective
The objective of the peninsula, built of sand mined from offshore, is to feed adjacent beaches (approximately 12.4 miles of beaches) that presently require approximately 1.4 Mcy of nourishment annually (Mulder and Tonnon 2010) because of wave action and littoral transport from the peninsula to adjacent lands. The expected lifespan of the peninsula is 20 years. This would reduce the frequency of beach nourishment on adjacent beaches, which is presently conducted at each shoreline location approximately every 5 years, and would reduce the number of disruptions of such construction projects to both the beach and the seabed.
3.3.3 Results
The sand engine peninsula is a relatively new feature that continues to be monitored. However, the sand was placed in late 2011, and available monitoring has extended through 2012 (de Schipper et al. 2016; http://www.dezandmotor.nl/en/). Monitoring data indicate that the sand engine is evolving as expected based on numerical model predictions (Mulder and Tonnon 2011). Specifically, the peninsula is projected less into the ocean with an average shoreline recession of 590 ft. The peninsula is forming into an elongated, parabolic-shaped feature in the shore-parallel direction, as predicted.
The majority (72%) of transported sand is staying within the littoral system, feeding adjacent beaches. This confirms mega-nourishments like the Sand Engine as feeders to adjacent shoreline. However, initial studies also indicate that there is greater loss of sand in comparison to traditional beach nourishment methods. Long-term evaluation will determine if similar nourishments are more cost effective, environmentally sound, and equally beneficial when compared to typical beach nourishment projects.
3.4 Perdido Key, Florida
3.4.1 Practice
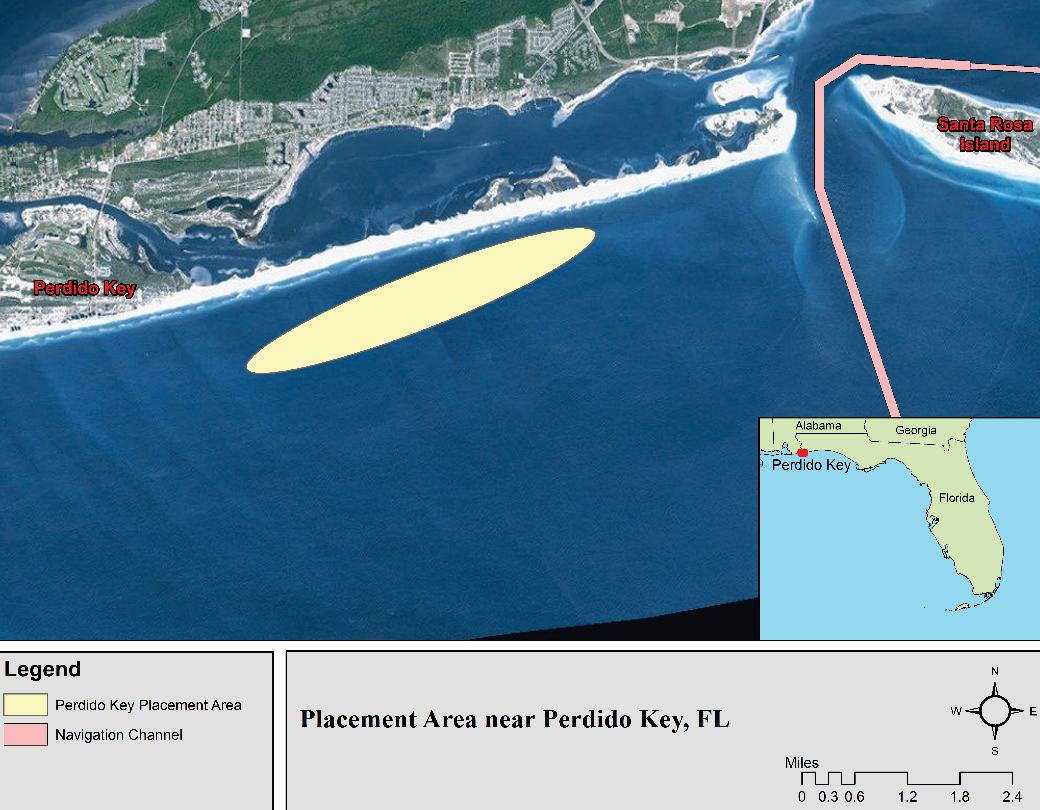
In 2011, a nearshore berm was placed in the intertidal zone of Perdido Key located in the panhandle of Florida (Figure 7). Sediment dredged from the Pensacola Pass navigation channel was placed along the eastern portion of the island, not to exceed an elevation of +3 ft North American Vertical Datum 1988 (NAVD88).
ERDC/CHL SR-19-3 20
RSM and EWN strategic placement practices implemented in this project were as follows:
1. Onshore migration of the sediment through overwash processes nourished the nearshore profile as a result of waves and currents.
2. Placement of material in a manner resulted in sediments being transported out of the nourishment area, yielding a reusable and sustainable placement site.
3. Increased shore protection from large waves breaking and attenuating on the nearshore berm through additional width of beach.
3.4.2 Objective
Beach nourishments are the addition of sediment to the beach and nearshore region of the beach profile to extend the dry beach seaward. Nearshore berms are subaqueous features constructed to reduce shoreline erosion by reducing high-energy waves, add sediment to the littoral system, and potentially add sediment to the dry beach. A swash-zone berm places sediment in the swash-zone or intertidal portion of the beach profile to allow for rapid transport of sediments. This method of BUDM
ERDC/CHL SR-19-3 21
Figure 7. Location of sediment placement area near Perdido Key, Florida.
was employed at Perdido Key, Florida. The overall objective of this project was to place a swash-zone berm so that sediment would rapidly mobilize and transport to downdrift shoreline and beaches. The berm was placed at a nodal point along the island created by waves refracting around the ebb shoal of Pensacola Pass (Caucus Shoal).
3.4.3 Results
Dredging and placement began in November 2011 and was completed in January 2012. Material was placed in the swash zone, not to exceed +3 ft NAVD88. A total of 520,000 cy were placed. The natural beach elevation for the study area is approximately +6 ft NAVD88.
The swash zone berm was monitored using 44 beach profile transects (R45-R68) that were established using Real Time Kinematic (RTK) Global Positioning System (GPS) (Figure 8). Surveys were collected semiannually between November 2011 and July 2013, producing a dataset of seven surveys. The study area was divided into three sections (control area west of the berm, the berm project area, and control area east of the berm) to determine morphologic changes to the swash-zone berm as well as in the adjacent areas. Surface sediment samples were collected across 14 transects pre- and post-placement of the dredged material (transects: R46, R48, R50, R51, R52, R54, R56, R58, R60, R62, R64, R65, R66, and R67). The following is an overall summary of the results of the study. More detailed results can be found in Brutsché et al. (2015).
ERDC/CHL SR-19-3 22
Figure 8. Beach profile transect locations at Perdido Key, Florida (from Brutsché et al. 2015). Black box indicates location of swash-zone berm.
3.4.3.1 Morphology monitoring.
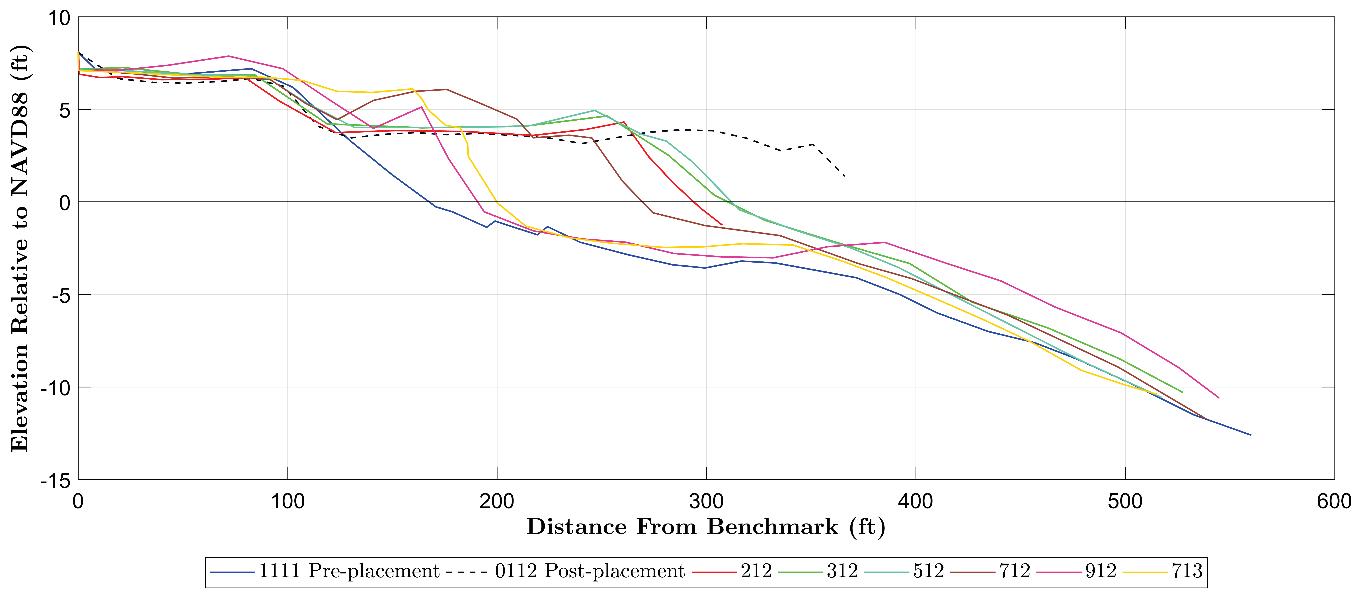
Example beach profiles from the control area west of the berm and the berm project area are shown in Figure 9 and Figure 10, respectively. The pre-placement profile shape in the study area consisted of a wide flat beach at the +6 ft NAVD88 contour, with a steep foreshore slope. There is a large offshore bar that is dynamic, with a relatively flat leeward trough (Figure 9 and Figure 10). The berm extended approximately 180 ft from the foreshore at the +3 ft NAVD88 (Figure 9).
ERDC/CHL SR-19-3 23
Figure 9. Example profile (R52) in the control area west of the berm at Perdido Key, Florida (based on data from Brutsché et al. 2015). Dates are given in MMYY format.
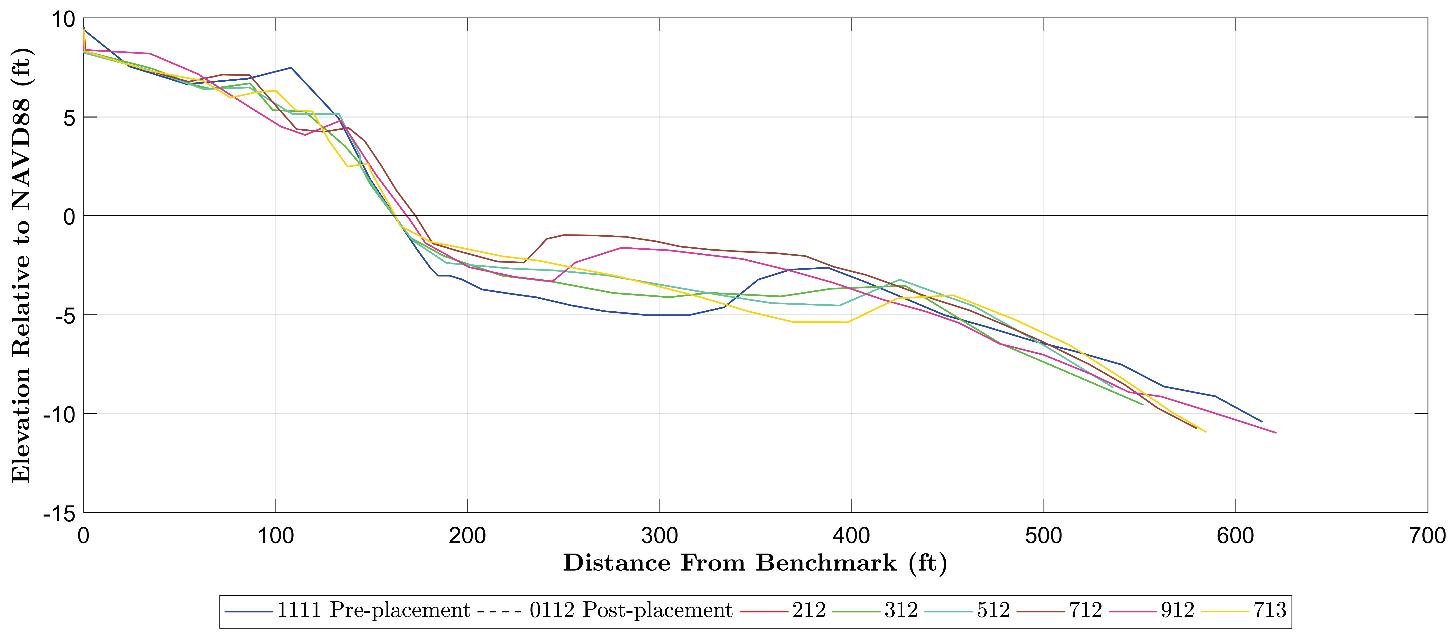
Figure 10. Example profile (R58.5) in the berm project area at Perdido Key, Florida (based on data from Brutsché et al. 2015). Dates are given in MMYY format
In the first 5 months following placement, the berm eroded approximately 75 ft. The berm continued to retreat over the succeeding 14 months. As the berm equilibrated, some sediment was eroded from the foreshore and deposited as overwash on the dry beach in the form of an active berm crest. This natural process restored the beach to the natural beach contour of +6 ft NAVD88 by July 2013. By this time, on average, a total of 7 ft of the berm remained in terms of beach width. Some sediment from the berm was deposited in the nearshore of the control area to the west of the project (Figure 10).
3.4.3.2 Sediment monitoring
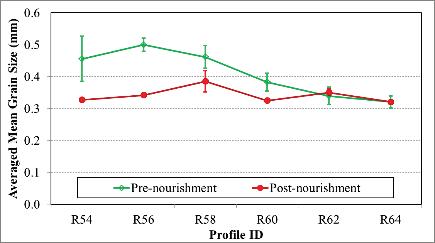
Sediment samples were collected pre- and post-placement from the swash zone berm. Pre-placement grain size varied from approximately 0.3 millimeters (mm) to approximately 0.5 mm (Figure 11). Generally, coarser sediment was located towards the western portion of the study area while finer sediment was located in the eastern portion adjacent to Pensacola Pass. The berm homogenized the overall sediment characteristics, creating a uniform grain size alongshore. Mean grain size post placement was approximately 0.3 mm.
ERDC/CHL SR-19-3 24
Figure 11. Alongshore sediment grain size in the berm project area at Perdido Key, Florida (from Brutsché et al. 2015).
3.5 Fort Myers Beach, Florida
3.5.1 Practice
A nearshore berm was placed offshore of Fort Myers Beach, Florida (Figure 12). Fort Myers Beach is located on Estero Island in west-central Florida. Matanzas Pass, a channel located at the north tip of the island, was dredged in 2009. Material dredged from the channel contained mixed sediments with up to approximately 16% fines. Due to regulatory sediment compatibility requirements in the State of Florida (Florida Administrative Code (FAC) 62B-41.007 (2)(j)(k)), the sediments could not be placed on the dry beach; therefore, the sediments were placed in the nearshore in the form of an elongate bar.
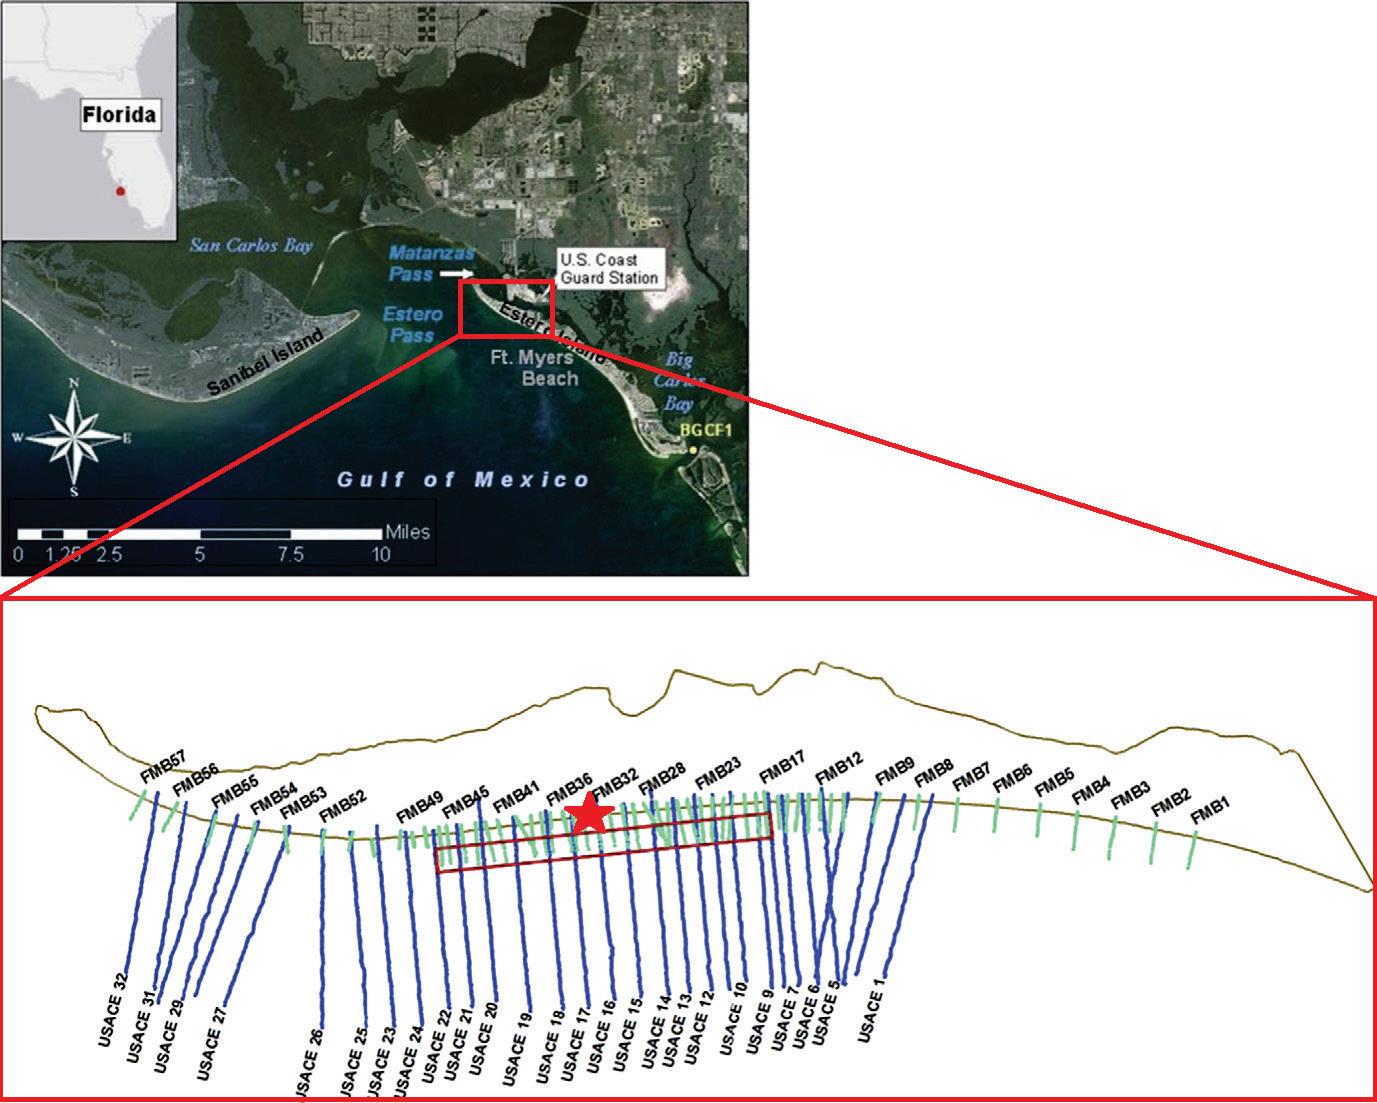
ERDC/CHL SR-19-3 25
Figure 12. Location map and beach profile transect locations at Fort Myers Beach, Florida (from Brutsché et al. 2014). Star indicates approximate alongshore location of nodal point.
RSM and EWN strategic placement practices implemented in this project were as follows (from Brutsché and Pollock 2017):
1. The mixed sediments were winnowed by waves and currents to reduce the percent fine content of the placed sediment and to modify the nearshore material such that it complied with regulatory requirements for beach compatibility.
2. The compliant sediment migrated onshore to nourish the nearshore profile as a result of wave and current processes.
3. Fine-grained sediment that was sorted from the placed material dispersed and did not transport onto the beach due to the higher energy, thus yielding beach quality material.
4. Future design of nearshore placements can be improved from knowledge gained by observing the placed material slowly migrating from the placement area, thus yielding a reusable and sustainable placement site.
5. Increased shore protection resulted from large waves breaking and attenuating on the nearshore berm.
3.5.2 Objective
The objective of this project was to place the nearshore berm downdrift of the nodal point (i.e., the location of longshore sediment transport direction reversal) of Estero Island but far enough away from the channel that sediments would not transport back into the channel and cause excess shoaling. Placement of the material was intended to be in relatively shallow water (approximately -6 ft [NAVD88]) so that the sand would likely migrate onshore and nourish the beach.
3.5.3 Results
Dredging and placement occurred in May 2009. The final constructed nearshore berm was approximately 3 ft high (from landward trough to berm crest), 400 ft wide, 6,000 ft long (with gaps approximately 50 ft wide that were present due to construction techniques), and 600 ft offshore. Total volume of the berm was approximately 230,000 cy.
Morphologic changes of the nearshore berm were monitored through the collection of beach profile surveys. The USACE Jacksonville District surveyed 32 beach profile transects spaced approximately 500 ft apart preand post-construction of the berm. The University of South Florida
ERDC/CHL SR-19-3 26
established 57 beach profile transects using RTK GPS, and surveyed each approximately semi-annually using standard level and rod procedures between May 2009 and May 2013. Profiles were spaced 50 to 200 ft apart, with more closely spaced transects over the berm to capture more detailed morphologic change, and extended offshore to the approximate depth of closure (approximately -8 ft NAVD88). Profile locations are shown in Figure 12.
The study area was divided into three sections (control area northeast of the berm, the berm project area, and control area southwest of the berm) to determine morphologic changes to the beach directly in the lee of the berm as well as in the adjacent areas. Surface sediment samples were collected across 11 transects during two sampling periods in April 2010 and June 2011 (transects FMB3, FMB6, FMB9, FMB13, FMB17, FMB22, FMB28, FMB35, FMB46, FMB53, and FMB56). Vibracores were collected along five transects in the study area. The following is a summary of the study results. (More detailed information and results can be found in Brutsché et al. [2014]).
3.5.3.1 Morphology monitoring
Example profiles are provided in Figure 13 and Figure 14 at one cross section on the berm. The pre-placement profile shape in the study area included a relatively small natural bar. The bar is dynamic and located approximately 150 ft offshore of the dry beach. Overall, the berm migrated onshore for the entire 4-year study period. Onshore movement was more rapid during the energetic winter months than during the relatively calm summer months.
ERDC/CHL SR-19-3 27
In 2012, the study area was impacted by two tropical systems. The beach profiles show the berm project area experienced less erosion than the control areas due to wave energy dissipation over the nearshore berm. The two storms also appeared to have accelerated the equilibration process of the berm, so that by May 2013 the shape of the profile resembled the shape of the pre-placement profile, albeit shifted seaward due to the increased volume of sediment in the profile. Overall, the profiles within the berm project area gained sediment on the dry beach, accounting for a total gain of approximately 23,000 cy in volume. Profiles immediately adjacent to the southwest portion of the berm also gained sediment.
ERDC/CHL SR-19-3 28
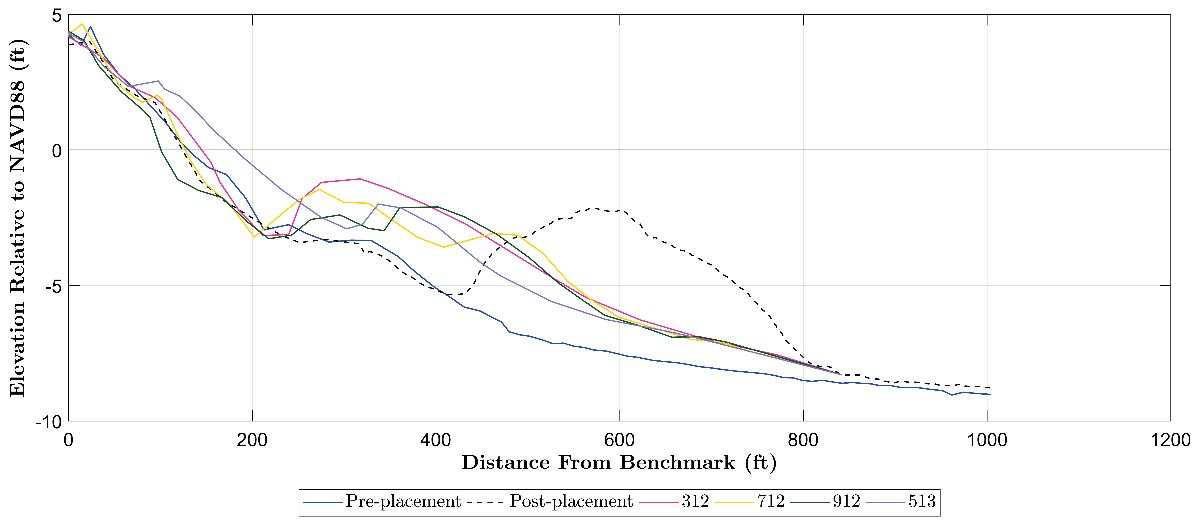
Figure 13. Example profile within the berm project area during the first 2 years after placement at Transect FMB32, Fort Myers Beach, Florida Dates are given in MMYY format.
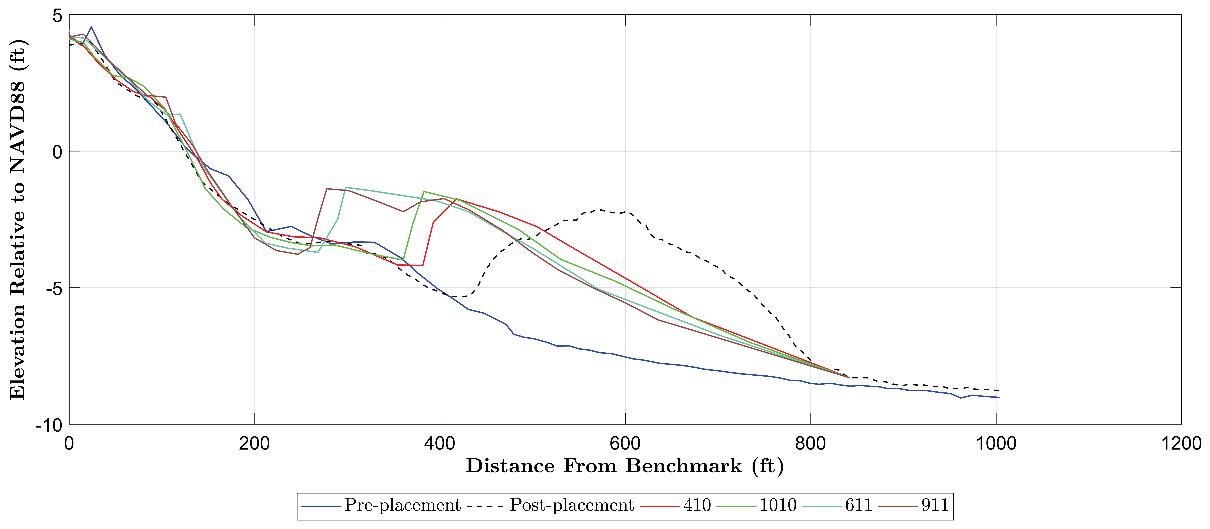
Figure 14. Example profile within the berm project area during the second 2 years after placement at Transect FMB32, Fort Myers Beach, Florida. Dates are given in MMYY format
3.5.3.2 Sediment monitoring
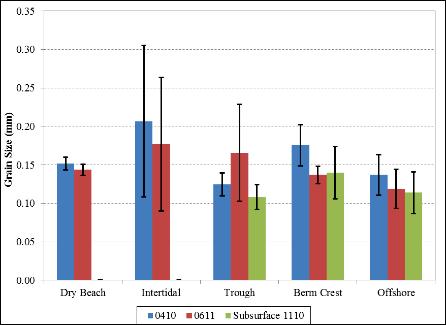
Sediment data show that in April 2010, the finest material was located in the trough landward of the berm and in the area offshore of the southwest control area (Figure 15). The fine material located in the control area implies that the study area naturally consists of relatively fine sediments. Data from June 2011 show the material in the trough had coarsened and the material offshore had become finer. This implies that the fine sediments in the trough had transported offshore. Note that throughout the entire study period, the grain size of the dry beach did not change. This is significant in showing that the fine material did not transport shoreward onto the beach.
3.6 Egmont Key, Florida
3.6.1 Practice
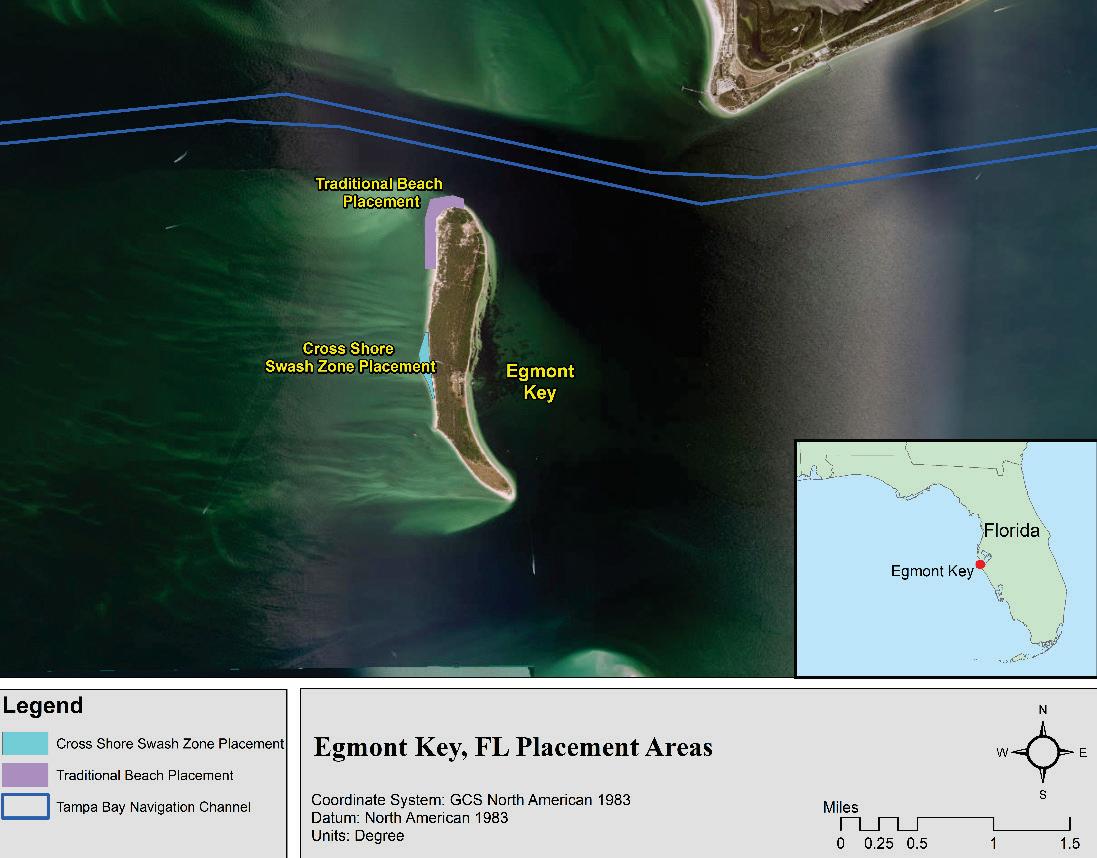
In 2014, maintenance material dredged from the Tampa Harbor Entrance Channel was beneficially used along Egmont Key, Florida. Two placement templates were used: (1) a traditional beach nourishment and (2) a CrossShore Swash Zone (CSSZ) nourishment (Figure 16). Transects that were
ERDC/CHL SR-19-3 29
Figure 15. Spatially averaged cross-shore grain size distribution in the berm project area at Fort Myers Beach, Florida
used in monitoring the site can be seen in Figure 17. A CSSZ nourishment is the placement of dredged material by discharging material directly into the swash zone until a delta builds and then extending the outfall shore perpendicular thus building a point feature. Fine content of the material was considerably above the allowable limit for beach compatible material in the State of Florida; however, an exception was made for this project due to the island’s cultural resources and environmental habitat for shore birds and sea turtles.
ERDC/CHL SR-19-3 30
Figure 16. Placement areas near Egmont Key, Florida
Overall, the dredge material contained up to 22.5% fines (passing the #230 sieve). More specifically, material placed in the traditional beach nourishment template contained 22.5% fine material at the dredging site while the CSSZ placement template contained 23.8% fines at the dredging site. For the purposes of discussion of strategic placement of dredged material, only the CSSZ placement will be considered.

ERDC/CHL SR-19-3 31
Figure 17. Egmont Key, Florida, with transect lines.
3.6.2 Objective
The objective of this project was to place sediment in a point placement so that it might transport alongshore naturally to nourish adjacent beaches. By not directly placing material into a template, natural processes could transport sediment alongshore, thereby potentially increasing the extent of beneficial use of the material. In situ material contained up to 23.8% fines passing the #230 sieve and was relatively dark as compared to the natural color of beach sands in this area. The hypothesis was that much of the dark fine material in the borrow site would be lost during the dredging and placement process, resulting in acceptable quantities of fine sediment on the beach with an overall lighter color.
3.6.3 Results
Material for this project was dredged from the Tampa Harbor Entrance Channel and placed on Egmont Key, an island located at the mouth of Tampa Bay, Florida. Sediment was placed along the north end of the island as beach nourishment. The CSSZ placement was constructed at approximately the middle of the island, at the estimated location of the diverging point of longshore sediment transport. Dredging began in November 2014 and continued through early March 2015.
To monitor the placement, the University of South Florida established 27 beach profile transects using RTK GPS that were surveyed approximately bi-monthly. The survey extended from the dune field to approximately the closure depth over the shallow platform. Sediment samples were collected from the dredge hopper as well as on the beach and in the return water that ran off back into the Gulf of Mexico. Post-nourishment sediment samplings along 10 beach profiles were conducted twice, one immediately after the placement and one 5 months after the placement. These were in addition to sediment sampling before and during construction. Sediment grain size and color analysis were performed on each sample.
3.6.3.1 Morphology monitoring
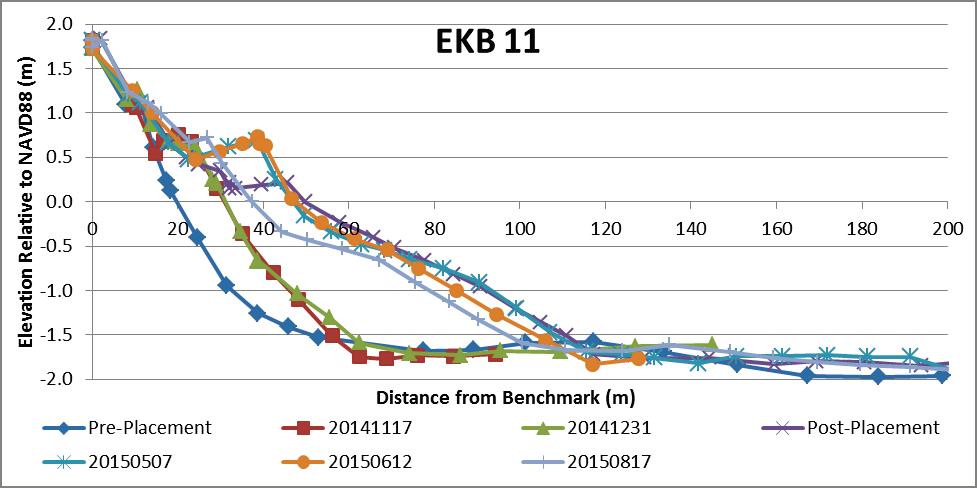
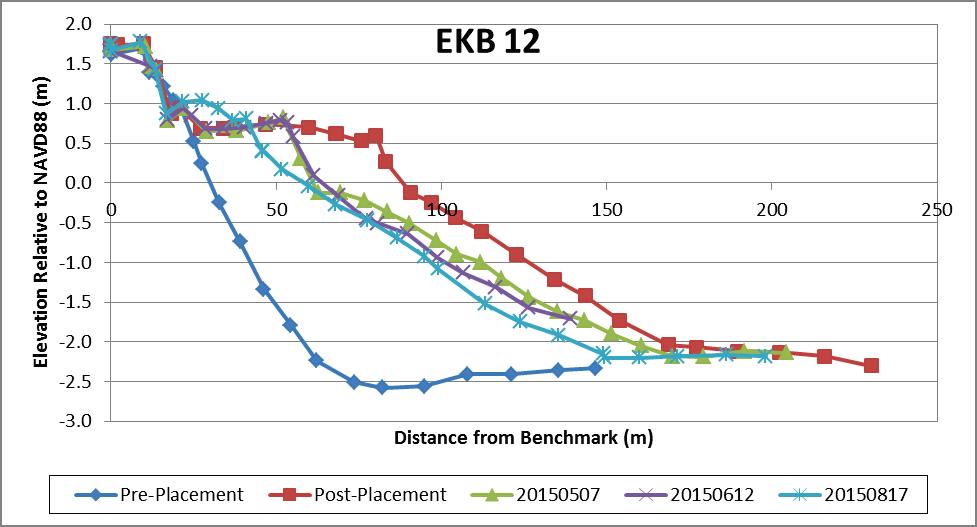
Example CSSZ nourishment profile evolutions are illustrated in Figure 18 and Figure 19. Consistent with the shape of the profiles along the entire Gulf-facing beach, the profiles are steep and lack a nearshore bar. The beach at profile EKB 12, which is closest to the point of maximum extension, experienced erosion. Profile EKB-11, approximately 330 ft to
ERDC/CHL SR-19-3 32
the south, accreted in the intertidal and subtidal zones from March to June 2015, or 3 months after the nourishment. The small volume gains measured at EKB 11 were subsequently eroded by August due to more energetic conditions during the mid-summer.
The profiles within the CSSZ template remained relatively stable during the first 5 months after placement, with a loss of ~1,570 cy out of the 81,300 cy placed or approximately 2% of the total volume placed. The sediment eroded from the apex of the placement was deposited along the adjacent beaches within the placement range. Most of the deposition along
ERDC/CHL SR-19-3 33
Figure 18. Northern elevation profile on Egmont Key, Florida.
Figure 19. Southern elevation profile on Egmont Key, Florida
the two sides of the discharge point occurred in the intertidal and subtidal zones. The dry beach gained little sand.
3.6.3.2 Sediment monitoring
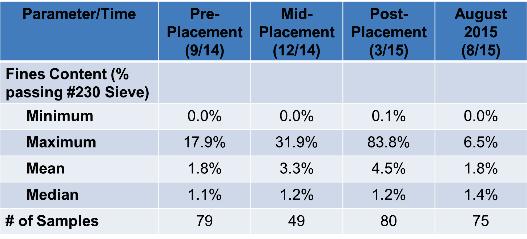
Surficial sediment samples were collected from the dune to the depth of closure at four different times: pre-nourishment, during nourishment, immediately post-nourishment, and 5 months after placement. Table 1 lists the spatially averaged percent fine content. Fine content is defined here as the sediment that passed through #230 sieve, or fraction that is finer than 0.063 mm. Percentage of fine content averaged over all the samples was 1.8% before the nourishment. During the placement, the average fine content increased to 3.3% with higher concentrations near the toe of the fill.
Post-placement sampling illustrated a further increase in the average concentration of fine grained sediment to 4.5%. The highest concentration of fine material was also found near the toe of the fill. At 5 months post placement, most of the fine grained material had been removed from the surficial sediments, and the mean concentration had returned to 1.8%. This suggests that the natural processes disperse the fine material away from the energetic beach environment in fewer than 5 months.
ERDC/CHL SR-19-3 34
Table 1. Fine grain sediment characteristics at Egmont Key, Florida
3.7 Coos Bay, Oregon
3.7.1 Practice
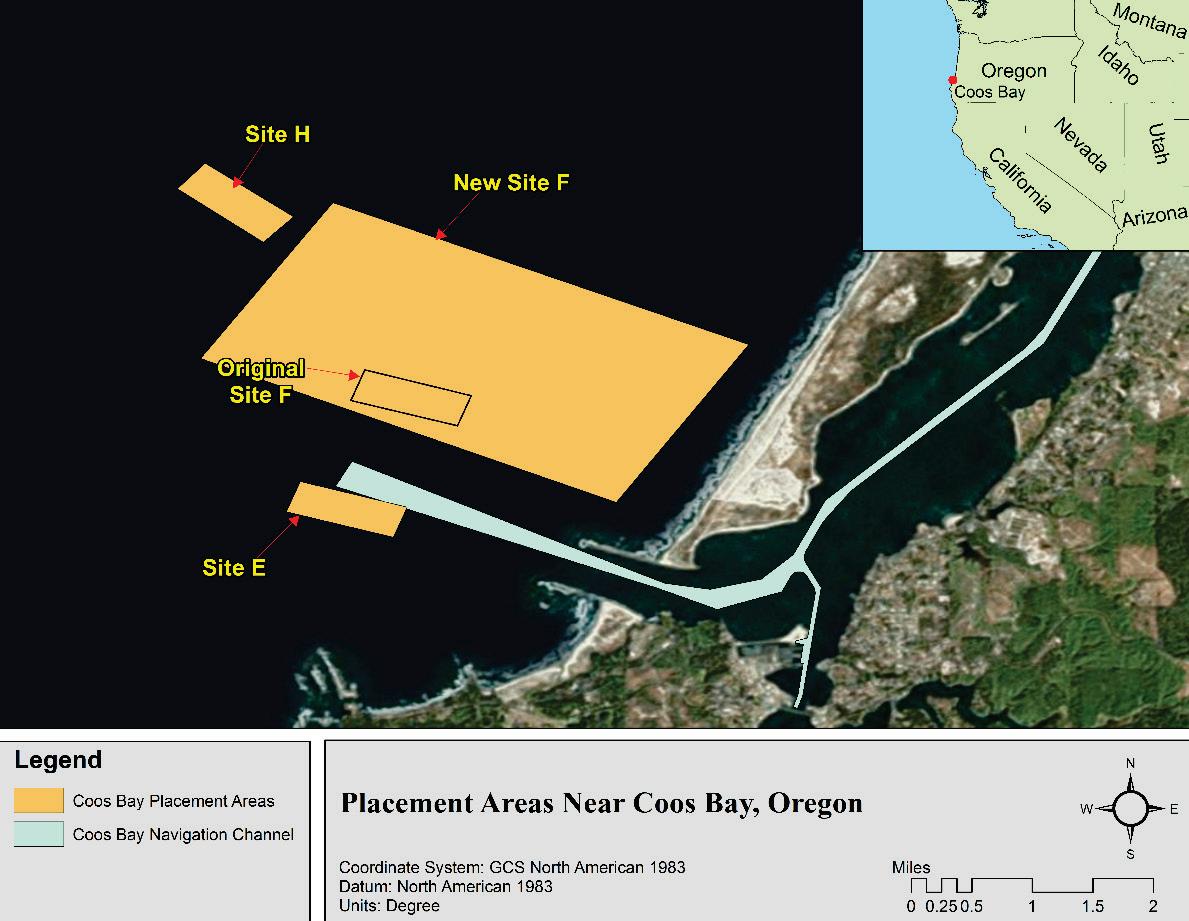
Coos Bay, Oregon, includes an 8-mile entrance channel across the outer bar that is 45 ft deep and 700 ft wide. Channel depth is reduced to 35 ft inside the Bay. Three ODMDSs (E, H, and original Site F) were designated in 1977 for disposal of channel maintenance dredged material from the Coos Bay entrance channel (Figure 20). Prior to 1994, the cumulative effect of dredged material placement at Coos Bay ODMDSs had resulted in significant mounding within the ODMDSs. The height of dredged material mounding within Coos Bay ODMDSs had exceeded 50 ft with respect to the pre-disposal bathymetry of -100 ft MLLW. The dredged material mounding was generating wave amplification and wave breaking within the approaches to the Coos Bay entrance channel, degrading the navigability of the deep water inlet.
To avoid additional mounding of dredged material placed at Coos Bay ODMDSs, ODMDS F was expanded to have dimensions of 14,600 ft (cross shore) × 8,000 ft (alongshore) and span a water depth range of 20 ft to
ERDC/CHL SR-19-3 35
Figure 20. Coos Bay, Oregon, placement sites.
150 ft below MLLW (Figure 20). The expanded configuration of ODMDS F was intended to accommodate placement of 1.5 Mcy/year of sand dredged from the Coos Bay Federal Navigation Channel for 50 years, without affecting wave conditions anywhere within or adjacent to the ODMDS. The expanded configuration of ODMDS F was also intended to allow for the placement of dredged material within the nearshore for the purpose of augmenting the coastal littoral sediment budget north of the Coos Bay Inlet. To promote targeted placement of dredged material within the nearshore, ODMDS F was sub-divided into a nearshore area (F-NS) (Figure 20) and offshore area (F-OS). Use of ODMDS F is limited to sandsized sediment.
3.7.2 Objective
Utilization of F-NS area augments the littoral sediment system along the ocean side of Coos Bay North Spit and increases the resilience of the inlet’s morphology to resist erosion during severe winter storms. A specific vulnerability mitigated by dredged material placement within F-NS is recession of the North Spit. The North Spit (Figure 20) has been eroding since the late 1970s, narrowing at one location from 1,800 ft wide in 1975 to 800 ft in 2015. The occurrence of a breach through the North Spit near the jetty has become a distinct possibility. Such a breach (through the spit) would allow ocean circulation to bypass the engineered inlet of Coos Bay, compromising deep draft navigation to ports serviced by the present engineered inlet.
The annual dispersive capacity of F-NS to accept dredged material has been estimated to be 200,000 - 400,000 cy (based on Multiple Dump Fate [MDFATE] numerical modeling used to quantify site capacity). This is the amount of sediment that is expected to be dispersed per year out of F-NS due to wave and current transport (USACE 1995). The total static capacity of F-NS is estimated to be 4 Mcy. This is the amount of sediment that can accumulate within the site without causing wave amplification or breaking. The objective for using F-NS was to place an optimum amount of dredged material within the site each year, such that the material is transported out of the site by winter storms, resulting in minimum long-term accumulation within the site. Since 2006, 60% of the 8.3 Mcy of sand dredged from Coos Bay Federal Navigation Channel has been placed within F-NS.
ERDC/CHL SR-19-3 36
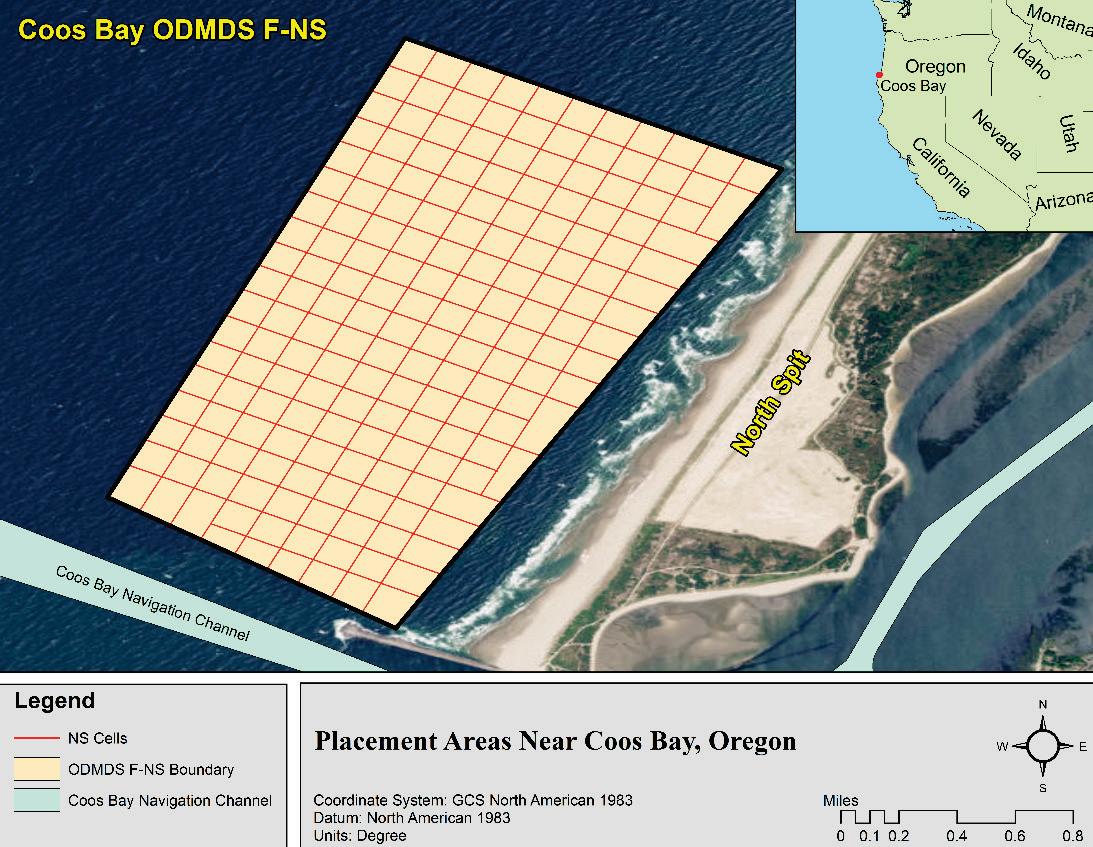
The F-NS area (Figure 20) is approximately 9,000 ft (alongshore) × 5,000 ft (cross shore), and is located within 1 mile from shore in a water depth range of 20–60 ft below MLLW. F-NS is partitioned into one hundred eighty 500 ft × 500 ft cells to manage the distribution of dredged material placement within the site. Each year, specific disposal plans are developed to assign dredged material placement to specific cells within F-NS. The objective of each disposal plan is to distribute individual placement events (loads) throughout the site so that accumulation (mounding) of dredged material deposition is minimized.
Annual mounding due to dredged material placement within F-NS is less than 3 ft. Much of the dredged material annually placed within the F-NS area is dispersed during subsequent winter storm waves and currents. As of 2015, the total mounding of dredged material placed within F-NS is less than 4 ft (in vertical accumulation), with respect to the 2006 bathymetry. Approximately 50% (2 Mcy) of the total material placed within F-NS since 2006 (4 Mcy) has been dispersed out of the site.
3.7.3 Results
Benefits of placing dredged sand within F-NS include (1) increasing the resilience of the inlet to resist destabilization from morphology recession by feeding the nearshore littoral sediment budget, (2) reducing the haul distance for dredged material placement, as F-NS is closer to dredging sites than F-OS, and (3) utilizing a dredged material site that annually renews its capacity (to receive additional dredged material) through the dispersive nature of a site located within the nearshore.
Various methods have been used to gain insight of dredged material behavior at Coos Bay ODMDSs. These include differential analysis of yearto-year bathymetry surveys, wave modeling (Regional Coastal Processes), Sediment Profile Imaging (SPI), and dredged material fate modeling
(MDFATE and Steady Fate; USACE 1995). Based on analysis of available data through 2006, USACE Portland District (NWP) recommended use of F-NS (Figure 21) as the primary area for placement of sandy dredged sediment.
ERDC/CHL SR-19-3 37
An integrated field-data collection and analysis campaign is presently underway to evaluate the fate of dredged sand placed at ODMDS F-NS and identify sediment transport pathways from F-NS to adjacent nearshore areas. The ongoing data collection effort includes in situ wave and current data acquisition, sediment tracer study, hydrodynamic modeling (Coastal Modeling System-Flow and ADvanced CIRCulation), Wave Modeling (Coastal Modeling System – Wave), and sediment fate and transport modeling (Particle Transport Model [PTM]).
3.8 Mobile Bay, Alabama
3.8.1 Practice
Mobile Bay, Alabama, is the terminal repository of sediments transported downstream from the Mobile-Tensaw River system, which is the nation’s fourth largest river system relative to discharge and sixth largest in terms of total drainage area (Isphording and Flowers 1987; Parson et al. 2015).
The USACE Mobile District (SAM) maintains the federally authorized Mobile Harbor Navigation Project.
ERDC/CHL SR-19-3 38
Figure 21. Coos Bay, Oregon, active littoral zone ODMDS F-NS.
From the enactment of the Rivers and Harbors Act of 1826, the majority of dredged sediments from the Mobile Bay channel was placed in the adjacent waters using mechanical dredges that side-casted the material alongside the channel. In the late 1800s, this practice was changed to the use of hydraulic cutterhead dredges. The majority of the side-casting and earlier adjacent open-water hydraulic placements of material resulted in dredged material mounds in the shallow water just outside and parallel to the channel limits.
In November 1986, the WRDA 86 changed dredging and dredged material placement practices: “for reasons of environmental quality, dredged material from such project shall be disposed of in the open water in the Gulf of Mexico.” Later, WRDA 96 provided an opportunity for use of the material for environmental acceptable alternatives; however, it was not until recent actions taken by the Mobile Bay Interagency Working Group (IWG) that the standard practice of removing approximately 4 Mcy of maintenance material annually from the bay with placement in the ODMDS was changed. Since the mid-1970s, dredged material from upper Mobile Bay has been transported 30 miles or more to the ODMDS outside the Bay. At the same time, it was recognized that the Bay was losing habitat due, in part, to a sediment deficit in the Bay (Byrnes et al. 2013). The sediment deficit was approximately 1.6 Mcy/year, which is less than the dredge volume removed from the Bay annually.
In 2012, SAM received permission to place dredged material from the Bay at thin layer placement sites near the navigation channel. Approved placement locations were the same as those used prior to the 1970s (Figure 22). Pre-placement bathymetric surveys indicated that no residual dredged sediment remained from the 1970s placement operations.
ERDC/CHL SR-19-3 39
3.8.2 Objective
The objective of the RSM implementation strategy for Mobile Bay is to bring lessons learned through application of RSM and EWN principles and practices in the coastal environment to a broader perspective for sediment and related environmental management planning for Mobile Bay, specifically in-Bay placement of maintenance material dredged from the Mobile Harbor navigation channel. The RSM strategy for the Bay uses a systems-based approach for collaboratively addressing sediment-related issues within a regional context (Parson et al. 2015). The efforts of the Mobile Bay IWG focus on finding sustainable solutions that support more effective use of the estuarine sediment resources in an environmentally sensitive and economically efficient manner. The objective is to maintain navigation dredged material within the Bay to reduce the sediment budget deficit and nourish habitat that requires ongoing fine-grained sediment input (such as wetlands).
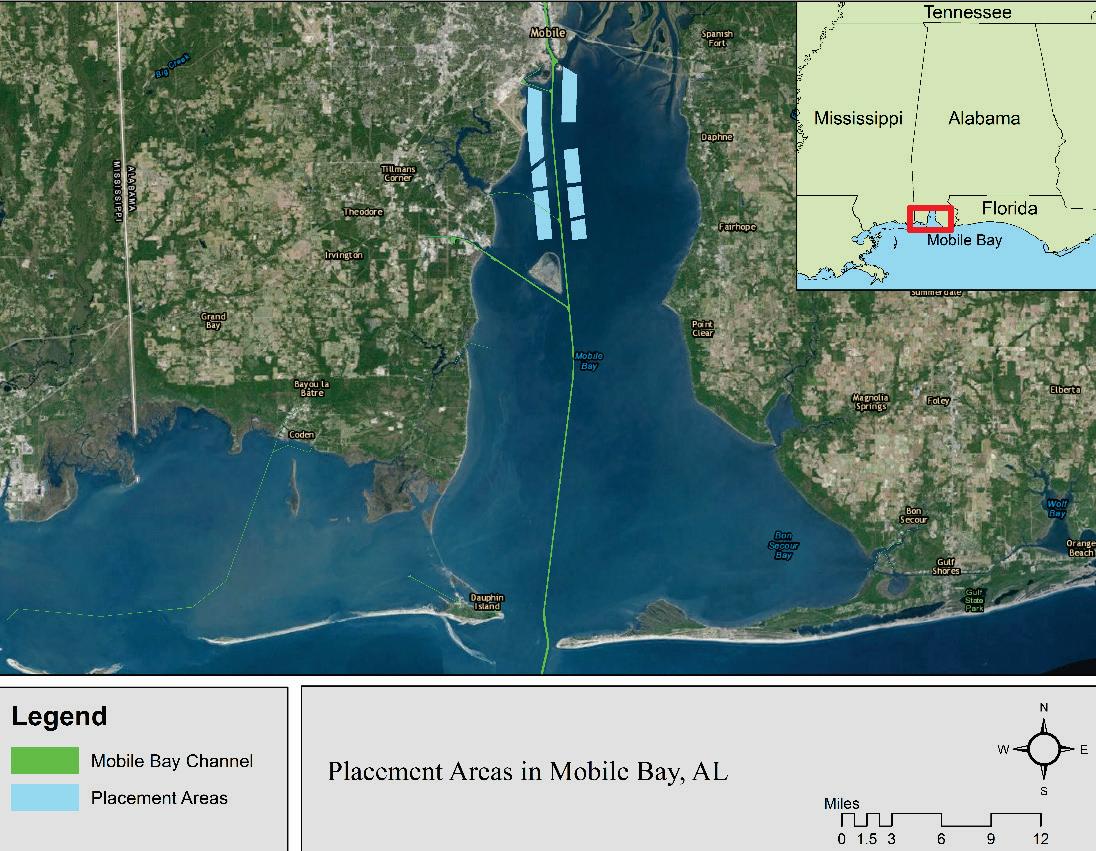
ERDC/CHL SR-19-3 40
Figure 22. Mobile Bay, Alabama, channel placement sites.
3.8.3 Results
The Mobile Bay IWG, consisting of the Alabama Department of Conservation and Natural Resources, the Mobile Bay National Estuary Program, the Dauphin Island Sea Lab, the Alabama Department of Environmental Management, the United States Fish and Wildlife Service (FWS), the National Marine Fisheries Service, the Alabama Port Authority, and the USACE, agreed that the removal of upwards of 4 Mcy/year from Mobile Bay was not the best use of this vital resource. However, issues related to open water dredged material placement including concerns on habitat impact/re-colonization, and the longer term fate of fines within the system including the potential for placed material to re-deposit in the channel (re-handling) and/or deposit on sensitive habitats, needed to be addressed.
In 2012, the dimensions of the Mobile Bay navigation channel were compromised leading to a critical need to return the channel to full operational dimensions that could not effectively be accomplished by hopper dredges. The required dredge volume was much greater than the typical annual removal of approximately 4 Mcy. The IWG adopted the 2012 agreement to permit in-bay placement as a valuable opportunity to monitor and model the open bay placement sites to answer questions regarding the fate of the placed dredged material in the Bay. In September of 2012, the SAM utilized a large pipeline dredge to clear the upper Bay channel. This action resulted in the placement of approximately 9 Mcy of maintenance dredged sediment within already established open bay channel-adjacent sites that had not been used since the 1980s (Figure 22). The placement utilized thin layer techniques such that the thickness would be no greater than 12 inches to ensure benthic recolonization. The SAM subsequently implemented a monitoring and modeling program to demonstrate and predict the behavior and fate of the placed sediment. The results of these studies will be used to revise future open bay placement strategies to increase value of strategic placement to nearby resources and minimize rehandling.
The monitoring of placed dredged material within Mobile Bay was conducted during the 2012 dredging operations. Monitoring of the thinlayer disposal sites began shortly after the 2012 placement with the collection of sediment cores and profiling imagery collected at the placement sites on 24 – 28 September 2012. SPI data were collected at approximately 200 stations. Push cores for grain size analysis and
ERDC/CHL SR-19-3 41
geotechnical properties were collected at approximately 185 stations. Sampling conducted at the thin-layer placement stations represented a time series from 24 hours to 6 months post placement. Monitoring and subsequent data analysis identified extent and thickness of the thin layer placement and were used to supplement additional benthic studies regarding recolonization following placement. These studies demonstrated that thin layer placement (< 1 ft maximum accumulation) was possible but would require significant movement of the pipeline discharge location. Data also indicated that recolonization of the placement sites was rapid.
Data were also used to populate and calibrate the numerical models for fate of dredged material placed within the Bay. Models are of particular benefit when evaluating placement options for fine-grained sediments like those placed at Mobile Bay. Due to the dispersive nature of these sediments, coupled with the high natural fine-grained sediments in the Bay, models are the best available alternative for assessing placement alternatives due to challenges associated with far-field monitoring. These models indicated that some fraction of the placed material will re-enter the channel while the remainder spreads out over the Bay. Near-channel placement locations (performed in the 2012 monitored demonstration) are more likely to contribute to channel infilling than placement locations farther away from the channel. The SAM is continuing to explore alternative placement methods that are more beneficial to wetlands (resources) and contribute less to channel infilling.
3.9 Harwich Haven, England
3.9.1 Practice
A series of mitigation solutions were tested in 1998 to address the increased loss of wetland habitat caused by channel deepening at Harwich Haven located on the east coast of England (Figure 23). Besides compensatory wetlands, these methods include the following:
1. Subtidal placement of fine material: The practice of discharging dredged material at specific defined placement locations adjacent to intertidal areas. The resulting berms act as feeder berms to specified wetlands adjacent to each berm.
2. Water column recharge: When placements are made during appropriate tidal phases that permit material to disperse over intertidal areas. Placement is made by spraying dredged material into the water
ERDC/CHL SR-19-3 42
column near the entrance to wetlands. The increased total suspended solids from these discharges will increase sedimentation in the wetlands. Demonstrations proved this method to be effective at increasing sedimentation on the intertidal areas (Simpson et al. 2005).
3. Increased overflow during maintenance dredging: A method to return suspended fine sediments to the water column so they can be carried downstream to the wetland areas.
These three efforts have been collectively titled “Sediment Replacement.” The sediment replacement practices are developed from the understanding that fine -grained sediment is a resource that is partially lost to a system by channel infilling. Appropriate dredge practice can reintroduce some portion of this fine -grained sediment to the sediment- starved system. Dredge practices must be identified that will not only reintroduce sediment to the system but will do so in a manner where dosing will not overwhelm surrounding resources.
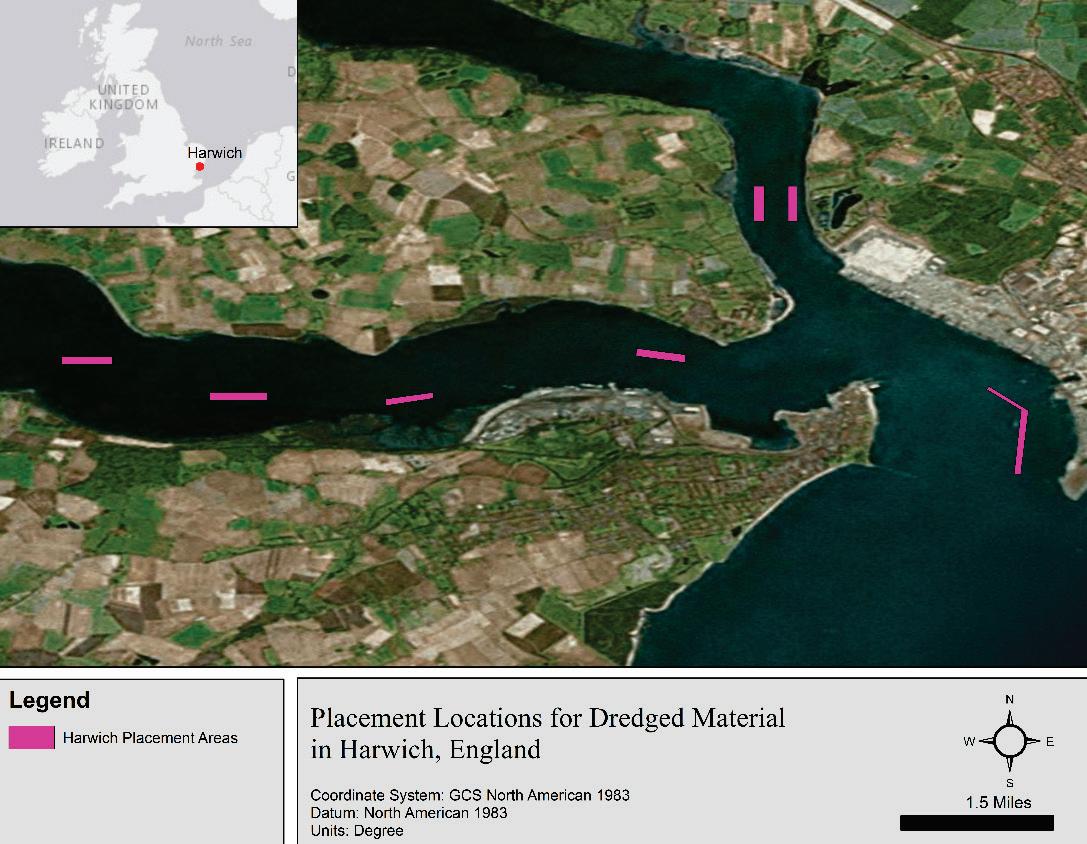
ERDC/CHL SR-19-3 43
Figure 23. Subtidal placement locations for dredged sediment at Harwich Haven, England (data from Simpson et al. 2005), selected as part of the sediment replacement program.
3.9.2 Objective
In 1998–2000, the approach channel to Harwich Haven, England, was deepened from -41 ft Chart Datum (CD) to -48 ft CD. It was estimated that the impact would include the loss of approximately 6.2 acres of intertidal wetland annually (Simpson et al. 2005). Much of this loss was due to trapping of mud in the deepened approach channel. To address wetland loss, which included areas of bird habitat, a combination of mitigation solutions and compensatory measures was approved. The compensatory measures included wetland construction using dredged material beneficially. The mitigation efforts were RSM and EWN solutions to management of dredged material as described above. These efforts cumulatively produced a sediment bypassing effort to move sediment from the dredged channel into the adjacent habitat where it would deposit under natural conditions. The plan relies on sediment replacement to address habitat loss and only utilizes compensatory wetland when it is deemed that the bypassing efforts cannot address the wetland loss. The mitigation plan was performed during 1998–2000. However, all mitigation efforts except overflow dredging were terminated due to cost constraints and difficulty in quantifying benefits associated with finegrained sediment strategic placement.
3.9.3 Results
An estuary-wide monitoring program was enacted, including monitoring of bathymetry, benthic invertebrate community, saltmarsh vegetation, bird count, fisheries, suspended sediment concentrations, and intertidal deposition (Simpson et al. 2005). Modeling exercises were applied by HR Wallingford to quantify land loss caused by channel deepening so that remediation efforts could be better developed. An adaptive management plan was enacted and governed by an advisory group composed of government and non-government entities. This group, for example, modified water column recharge practices when native oyster beds were found close to one of the proposed discharge locations. An important lesson learned from this adaptive management approach to handling finegrained dredged sediment is that the sediment was treated as a resource, not a harmful byproduct of the dredging process. The re-introduction of fine-grained sediment to the adjacent habitat was deemed critical to habitat survival, not a threat to their survival. This method of handling sediment must be placed in context of all marine life in an ecosystem surrounding a channel, and application must be considered site specific.
ERDC/CHL SR-19-3 44
3.10 The Mud Motor, Wadden Sea, The Netherlands
3.10.1 Practice
Over 1.5 Mcy of sediment is dredged annually from navigation channels at the Port of Harlingen in the Wadden Sea (Figure 24). The majority of this sediment is fine grained. The dredged sediment is typically disposed in the Sea near the harbor (or in containment facilities for contaminated sediment). A pilot project has been implemented to place clean sediment farther north in the Sea, near salt marshes (http://www.ecoshape.nl/en_GB/mudengine wadden-sea-.html) to increase suspended solids and sedimentation in the adjacent marshes. Since dredging occurs frequently, nearshore placement of mud can be an ongoing source of mineral sediments to stimulate marsh expansion. The 3-year pilot project will place approximately 260,000 cy/year of fine-grained dredged sediment in the nearshore. A monitoring program for the Mud Motor has been developed to better understand how large-scale strategic placement of mud can be optimized to increase marsh function. Placement strategies were informed using sediment transport models to predict transport directions and fate.
3.10.2 Objective
The objectives of placement in the north part of the Sea near Koehoal (Figure 24) are to (1) reduce maintenance dredging by moving the sediment away from the navigation channels, (2) promote growth and stability of salt marshes, and (3) stabilize the foreshore of the dykes, thus reducing the amount of maintenance required. The second and third objectives are strategic placement opportunities. By increasing mud volume delivered to the salt marsh, the marsh is expected to expand through increased sedimentation. Besides the ecological benefit, the expanded salt marshes will have coastal protection value. Since dredging at the Port of Harlingen occurs frequently, the Mud Motor can become a semi-continuous source of sediment to the marshes.
ERDC/CHL SR-19-3 45
3.10.3 Results
This pilot project is currently being implemented, and monitoring is ongoing. Between September 2016 and April 2017, approximately 400,000 cy of sediment were placed in the Mud Motor site. Monitoring includes physical processes (currents, waves, wind, suspended solids, bed elevation, etc.), biological response to placement, and a tracer study to evaluate the fate of placed sediment. Unpublished modeling results predicted that placed sediment will disperse over a large area, with only a fraction (approximately 10%) being retained in the marshes. Preliminary tracer study results have been published (Vroom et al. 2017). Tracer data analysis confirms model predictions of dispersal of placed sediment over a broad area within and outside of the marshes. This analysis is consistent with known behavior of fine-grained sediments, which can remain in the water column for hours to days, even in shallow water. The sediments are therefore dispersed over a broad area. Tracer data also indicate that accretion from a single fine-grained sediment placement event will not significantly increase elevation in the marsh, and multiple ongoing placements would be required to support salt marsh accretion.
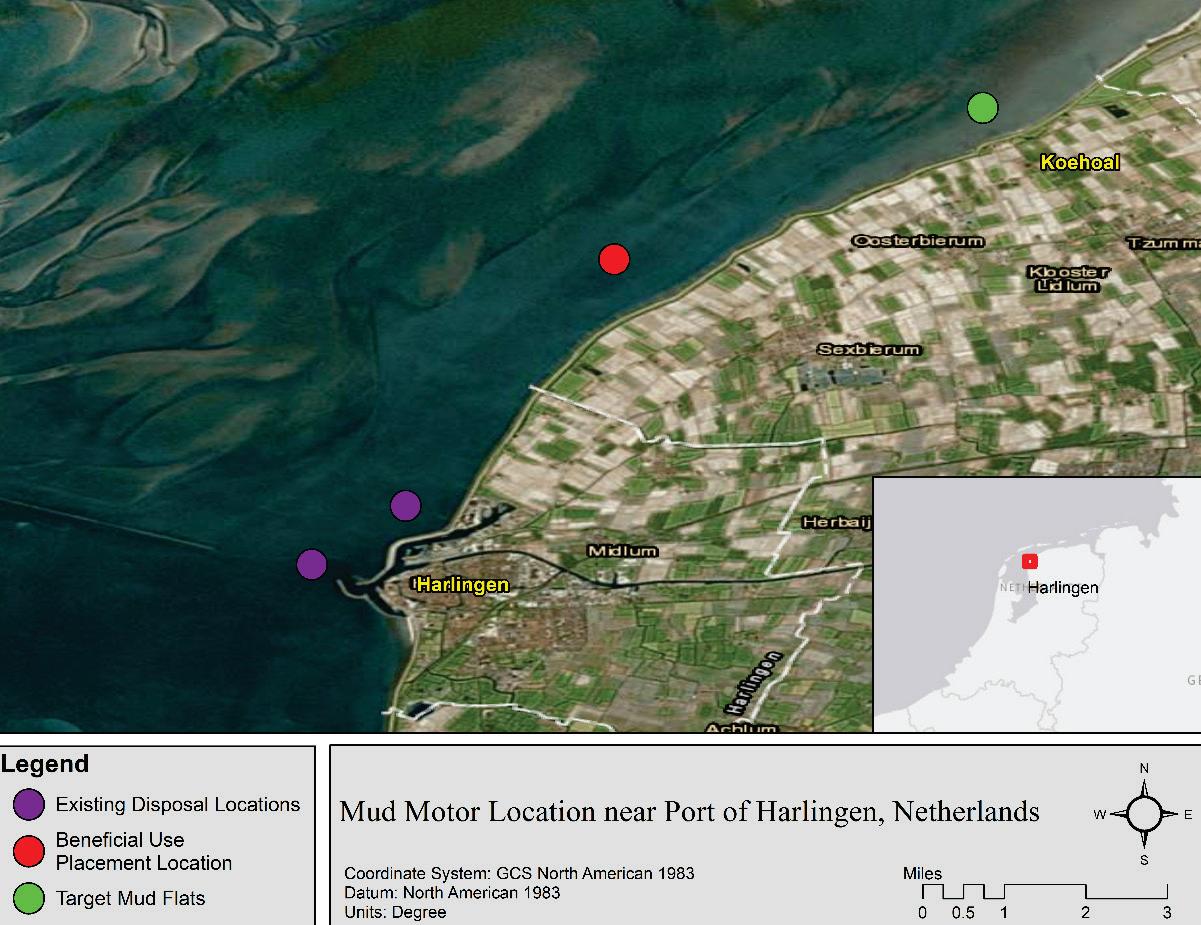
ERDC/CHL SR-19-3 46
Figure 24. The Mud Motor, Wadden Sea, The Netherlands, disposal and placement locations.
This pilot project is part of a larger study developed to evaluate potential BUDM practices in the Wadden Sea to develop salt marshes. The study is funded by the European Union’s Ecoshape program
(https://www.ecoshape.org/en/projects/mud-motor/). Process understanding and data developed through monitoring will be used to improve models that predict marsh response to increased sediment loadings. The Mud Motor pilot project, coupled with other Ecoshape efforts, aims to develop the required technological, physical, and ecological understanding to sustainably use dredged sediment to nourish salt marshes at large scales.
3.11 Horseshoe Bend Island, Louisiana
3.11.1 Practice
Horseshoe Bend Island, Louisiana, is a natural bend located in the Atchafalaya River approximately 20 miles south of Morgan City, Louisiana (Figure 25). The USACE New Orleans District maintains the navigation channel from Morgan City to Atchafalaya Bay. The hydrological cycles and tidal conditions of Atchafalaya Bay, coupled with river flow, represent complex but fairly well understood river-lake-estuary-bay system hydrodynamics (Wang 1984). The channel at the Bend is a sink for sediment. Therefore, dredging typically occurs on an annual or bi-annual basis with 17 dredging events occurring between 1990 and 2013. Dredge volumes for each event ranged from 0.5 to 1.8 Mcy. (Details of these placement events are provided in Berkowitz et al. [2014].)
ERDC/CHL SR-19-3 47
The predominant practice during the 1990s was conversion of nearchannel open water placement areas into wetland through direct placement of the dredged material. However, economically feasible alternatives for wetland creation were lacking by the end of the 1990s. Atchafalaya Bay was too distant to make open-water placement economically feasible. As an alternative to wetland creation, mid-channel placement of dredged material was proposed. The intent was that natural hydrodynamic forces in the river would move the man-made sandbar toward a naturally occurring sandbar downstream. The practice, initiated in 2002, coincided with rapid expansion of the downstream sandbar and creation of an 87 acre island (Figure 26). Evidence indicates that the island (now called Horseshoe Bend Island) formation is significantly enhanced by the strategic dredged sediment placements. Criteria used to determine success are provided in Berkowitz et al. (2014) and are based on acres of habitat created as well as habitat diversity. The Island continues to grow as additional sediment is placed upstream. This growth is documented with morphology measurements and aerial photography. As the Island grew, vegetation was established through natural processes, and birds now use the Island as a breeding ground. The 86-acre ecosystem that developed

ERDC/CHL SR-19-3 48
Figure 25. Horseshoe Bend Island, in the Atchafalaya River, Louisiana.
from the sand bar over the past decade has been meticulously documented in Berkowitz et al. (2014).
3.11.2 Objective
The objective of the project was initially to place sediment in a location that would keep it moving downstream and avoid further infilling of the channel. Some island development was expected but not to the extent that occurred. Details of the island evolution are provided in Berkowitz et al (2014) and Kim and Suedel (2015).
3.11.3 Results
The strategic placement project reduced demand on limited dredging resources by selecting a least-cost option for dredged material management while simultaneously providing a sustainable solution that produced environmental benefits. These benefits are quantified by Berkowitz et al. (2014). The island formation had an added benefit to the navigation program (Figure 26). Reduction in the cross section of the river reduced shoaling in the natural river channel, thus reducing dredging requirement. The processes of island formation and reduced channel infilling were measured and also modeled using the Curvilinear Hydrodynamics 3-Dimensional hydrodynamic and General Transport (GTRAN) sediment pathway models (Kim and Suedel 2014; Chapman et al. 1996; Smith et al. 2008).
ERDC/CHL SR-19-3 49
The modeling effort demonstrated that sand placed upstream from the sand bar will migrate toward and accumulate on the bar. The model also demonstrated increased velocities and reduced sand accumulation in the channel. The modeling approach, although in this case performed as a forensic study, is important to other proposed riverine strategic placement projects. This effort demonstrates that the models are sufficiently mature enough to be used as a predictive tool to evaluate benefits derived from various strategic placement options in complex river-tidal systems.
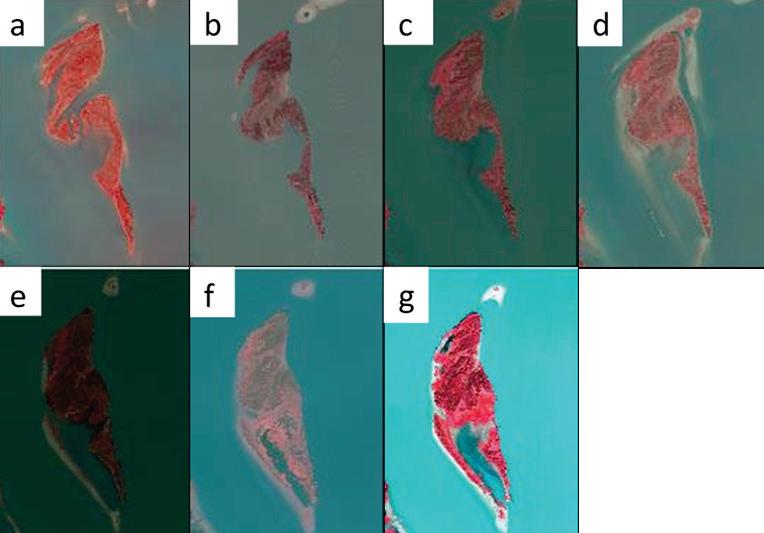
ERDC/CHL SR-19-3 50
Figure 26. Horseshoe Bend Island, Louisiana, in (a) 2008, (b) 2009, (c) 2010, (d) 2011, (e) 2012, (f) 2013, and (g) 2014
4 Implementation of Strategic Placement Plan (SPP)
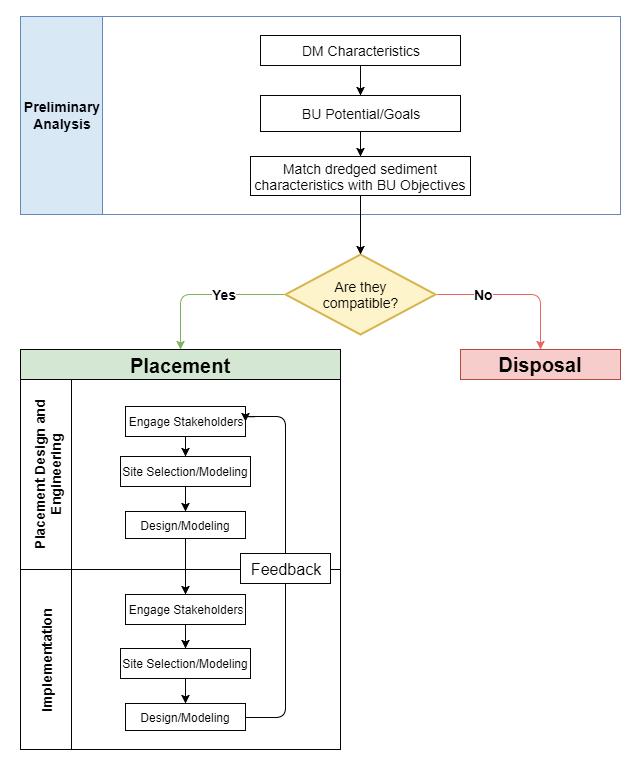
4.1 Developing an SPP
Properly designed strategic placement projects will support sustainable RSM and EWN strategies. These projects will also enhance NNBFs that deliver benefits to flood risk reduction and environmental restoration missions of the USACE. Projects should be designed to maximize benefits and manage risk. Therefore, significant understanding of sediment pathways, transport rates, and local ecology are required to appropriately apply strategic placement solutions. An SPP should be developed to characterize benefits, identify performance metrics, incorporate RSM/EWN practices, identify monitoring and adaptive management, and address key regulatory requirements and risks. An outline of steps taken to develop the SPP is provided in Figure 27.
ERDC/CHL SR-19-3 51
Figure 27. SPP outline for BUDM.
Each feature over which the sediment will traverse while moving from the placement site to the receptor site should be evaluated for ecological and physical response. This effort is generally part of the Environmental Impact Statement (EIS) that quantifies expected benefits and risks of the project to surrounding habitat. The EIS requires an understanding of the habitat at each of these features and especially at the strategic placement site and the receptor site. The EIS must also quantify the expected transport pathways and rates (exposure) as well as the effects of this exposure on resources. In addition, the dredged sediment will be placed at the strategic placement site in an as-dredged condition. Costs will generally prohibit pre-placement sorting of any kind. Therefore, sediment evaluation will include the following:
1. Available sediments: Dredged sediment physical and chemical characterization must be made. If material has some level of contamination (but still approved for open water placement), federal, state, and local regulatory agencies must evaluate the chemical concentrations to approve the strategic placement. Fraction of sand, silt, clay, and gravel will also be essential in evaluating strategic placement alternatives.
2. Placement site characteristics: Placed sediment must be compared to native bed sediments. Benthic habitat will also be a factor in determining how sediments may be placed (berms, thin layers, etc.). Placement methods must also be evaluated to address the potential for increased turbidity/suspended solids impacts on surrounding habitat during and after the placement process.
3. Needed sediments at the receptor site: This includes desired sediment classifications (sand, silt, and/or clay) and acceptable rate at which each class of sediment should be introduced to the site. Also relevant are allowable levels of contamination.
4. Sediment Pathways: The sediments will traverse possibly multiple regimes between the placement site and final destination. Effects on the native habitat in these regimes must be addressed in the EIS. An evaluation is required to determine what resources exist and how they may be affected by sediments being transported through each regime. This evaluation may require an understanding of rates at which various sediment classes will traverse each regime and temporary sedimentation in each regime for each sediment class.
5. Dosing: Dosing is the rate at which sediment is delivered to the designated receptor site and all other sites that receive sediment from
ERDC/CHL SR-19-3 52
the placement site. Dosing is key to determining if sufficient sediment is being delivered to induce accretion or stabilization of a feature. It is also critical to quantifying the effects incoming sediment will have on habitat at the feature and surrounding areas influenced by transport from the strategic placement site.
4.2 Developing a Conceptual Site Model (CSM)
Strategic placement sites are dispersive. Therefore, sediment transport pathways from the placement site to the receptor site(s) and other locations must be identified. A robust CSM must be developed for hydrodynamics and sediment transport. The CSM, at any given time, represents the best understanding of the dynamics of the system. Fate of each class of sediment and total sediment loadings to the receptor site should be described and possibly quantified in the CSM. The CSM evolves as understanding of a specific site improves. The final CSM can be represented in a number of forms. Often, the form will be dictated by the site complexity and available data. A combination of narrative, text, pictorial, data analysis, and results from computer models is used to develop the CSM.
An example pictorial component of a CSM for a bay/barrier island system is provided in Figure 28. Each significant sediment loading to the system is indicated. In addition, regions of net erosion and net sedimentation within the system are identified. Evaluation of system loadings to the bay indicates annual net deposition of 3.7 Mcy of sand and 1.1 Mcy of silt deposit. However, dredging extracts 6.0 Mcy of sediment from the bay each year. Therefore, unless dredged sediment is managed in-bay, there is a bay-wide net sediment budget deficit of 1.3 Mcy. This pictorial assists stakeholders to understand the system and can be used to demonstrate the benefits of sediment management practices that include in-bay strategic placement.
ERDC/CHL SR-19-3 53
The initial CSM will include existing data and will act as a guide to additional studies needed for refinement. The CSM is continually updated and tested as new data become available. Development of the initial CSM is the first step in developing an SPP and should be done in coordination with stakeholders. Evaluation of the CSM is performed after each update to determine if it is adequate for decision making. If critical gaps in understanding remain, they are identified through the CSM, and further evaluation is performed. Available data and hypotheses must be put into a framework to make the CSM usable for decision support. The CSM will incorporate information from various sources, including numerical models, field data, lessons learned at other sites, and expert Best Professional Judgment (BPJ).
BPJ is a critical component of developing CSMs and making decisions related to future plans. Strategic placement sites typically have complex physical and biological processes, and interactions. BPJ of experts, the project manager, and stakeholders should all be considered when developing and improving the CSM. Once developed, the CSM should be tested as much as possible to demonstrate that it is a robust tool for
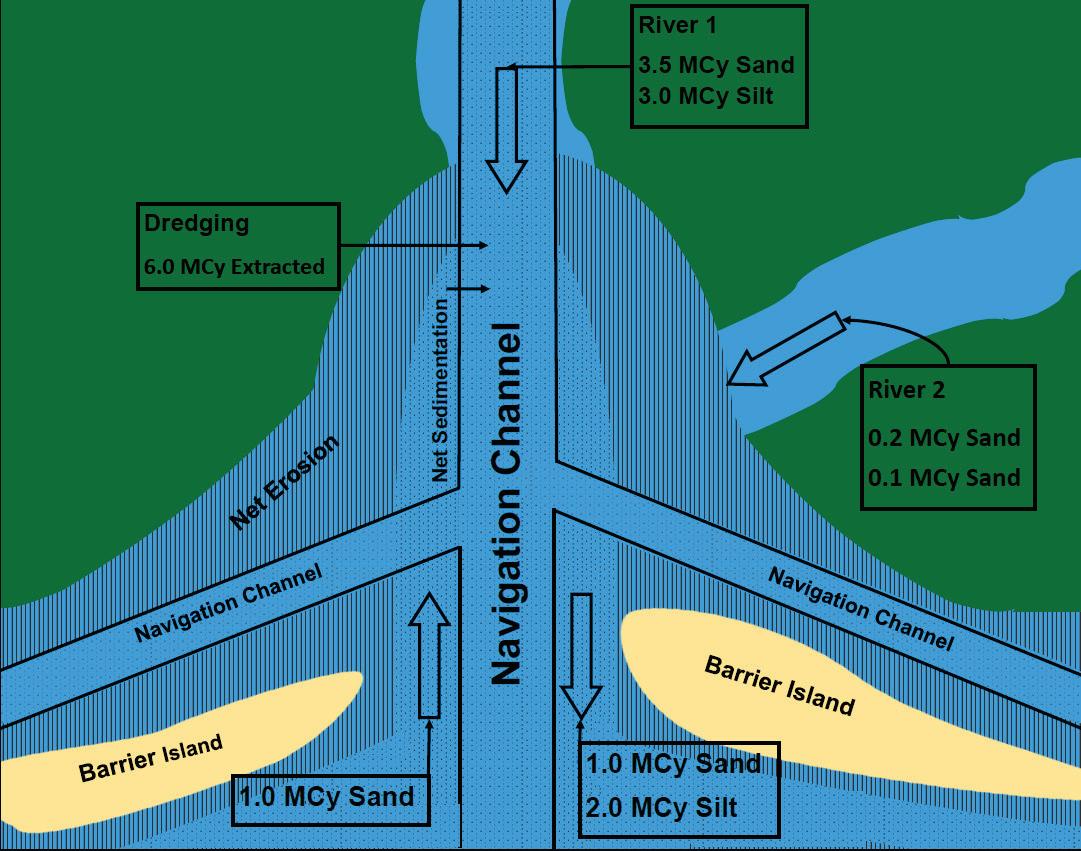
ERDC/CHL SR-19-3 54
Figure 28. Pictorial schematic for CSM for SPP development.
decision support. The CSM will eventually identify all first-order sources and pathways to the receptor of interest. It will also identify pathways by which sediment is removed from the receptor site. CSM complexity should match the complexity of questions being addressed, the availability of site data, and the complexity of the site. Therefore, conclusions from feasibility studies, the EIS, and other investigations may have to be incorporated into the CSM.
4.3 Selecting a site
Strategic placement site selection is dependent on multiple issues. First, just as with any placement site, regulatory approval must be obtained. An investigation of environmental impacts prior to, during, and subsequent to placement is typically required. An EIS will be performed for all major projects. An Environmental Impact Assessment will be performed for smaller projects. Strategic placement sites are often in areas of rich natural resources. The proposed placement may be approved if it is determined that the environmental impacts are acceptable and benefits outweigh any negative impacts that may occur. Proposed strategic placement activities should be coordinated with appropriate local, state, and federal agencies from the beginning (Figure 27). Appropriate agencies must understand the benefits of strategic placement so they can be weighed against other environmental considerations when reviewing approval requests.
In coastal environments, offshore (deep water) disposal sites generally involve nominal sediment transport except during storms. Transport pathways and characteristics generally do not significantly vary over the site or surrounding areas unless, for example, the site is on a steep slope. Nearshore (shallow water) sites, including most strategic placement sites, are dynamic, and adjacent locations may have significantly different sediment transport rates and pathways. Fate of mobilized sediments can vary significantly based on small differences in the placement location. Properly placed sediment, for example, may feed an island or feature that promotes flood risk reduction. Poorly placed sediment in the same regional system may re-enter the channel (causing a navigation risk and increasing navigation maintenance costs) or may move offshore, providing no benefit to the designated receptor site. Therefore, a high level of transport processes understanding must be included in the CSM to be able to distinguish between placement scenarios compared for site selection.
ERDC/CHL SR-19-3 55
The project manager must be able to distinguish the relative degree of system response (impact and benefits) across alternative designs. In addition, the project manager needs to be able to quantify cost-benefit of various SPP options for comparison purposes. The CSM will be used as a tool to select potential sites for strategic placement. Data from advanced numerical models are often used to improve the CSM. However, the fidelity provided by these numerical models may go beyond the CSM’s ability to inform the project manager. The CSM must maintain a level of complexity that is understandable to a broad audience of stakeholders, not all of whom are immersed in the project at a level similar to the project manager. Therefore, the numerical models may have to be analyzed in more detail independent of the CSM to evaluate placement alternatives because the fidelity of solution required to support placement location decisions may be greater than the complexity of a CSM. These results, while summarized in the CSM, will be detailed in a feasibility study and may require the project manager to refer to this documentation.
4.4 Performance metrics
Performance metrics are indicators of system response that can be used to estimate the anticipated benefits of alternative strategic placement scenarios with respect to particular planning or engineering objectives (USEPA/USACE 2004, 2007b). The metrics describe the information that will be collected, modeled, gathered from experts, or otherwise developed and represented to decision makers to characterize plan performance and engineering designs. Performance metrics must provide the ability to distinguish the relative degree of system response (conveyed in terms of impacts and benefits) across alternatives and designs, either qualitatively or quantitatively, in a logical manner that will help decision makers compare alternatives. A base-case scenario is often required for comparison purposes. For strategic placement scenarios, the base case is often dredged material disposal a scenario where no benefit is achieved.
Metrics will vary with strategic placement goals. For example, influence of enhanced beach morphology (or widening) on flood risk management may be a metric for nearshore berms placed to nourish beaches. Increased salt marsh acreage may be a metric for a muddy sediment strategic placement. Specific quantifiable metrics may include the following:
1. Flood risk reduction: Assets such as infrastructure (including communities) are protected from specific return period flood events by
ERDC/CHL SR-19-3 56
nourishment to beaches and wetlands. Human safety and infrastructure protection benefits from each strategic placement option can be quantified using predictive models that evaluate flood storage capacity and reduction to storm surge elevation in communities or near assets that can be damaged by flooding.
2. Protection of infrastructure from wave attack: Wetlands and other nearshore/near-bank features increase wave attenuation. Reduced wave action on levees, roads, or other nearshore or near-bank infrastructure will reduce maintenance costs and increase design life. Reduced maintenance costs can be quantified by comparing damage for specific events from the no-action scenario to various strategic placement options.
3. Ecological benefits: Although more difficult to quantify, the enhancement, creation, and restoration of ecological function to an area are benefits that should be documented. USACE and other organizations are evaluating procedures to monetize benefits of habitat based on acreage, diversity, and location.
4. Human benefits: Nourishment of receptor sites can provide direct benefits to humans such as recreation and enhanced fisheries. These services can provide economic development opportunities to communities near the receptor site.
4.5 Demonstration
Most strategic BUDM placements will require varying levels of field data collection, data analysis, and predictive modeling to evaluate expected outcome, optimize site selection and design, and manage risk. Such studies can be performed a priori (through predictive models or tools) or as demonstration projects after construction (through a combination of modeling and monitoring).
4.5.1 Modeling
Strategic placement solutions rely on hydrodynamic forces to transport sediment from the placement site to receptor site. Planners must address issues associated with sediment transport, including derived benefits and potential risks. Numerical hydrodynamic and sediment transport models can provide useful information on transport time lines, transport rates, and sediment fate. These models may be essential to obtain regulatory approval. Models can be implemented to compare various placement alternatives. Relevant model predictions include mobility, transport rates,
ERDC/CHL SR-19-3 57
sedimentation, turbidity, and fate for each sediment class. Predictive models and tools range from screening level cross-shore transport evaluators to fully three-dimensional hydrodynamic and sediment transport studies.
The level of study required depends on site-specific conditions, acceptable uncertainties, and regulatory requirements. For example, nearshore berms may not require fully three-dimensional, multi-grain transport models because the screening level and two-dimensional approaches are sufficiently mature to reliably predict fate of sand berms under many hydrodynamic conditions. BPJ should be utilized and subject matter experts consulted when making decisions about modeling requirements and when interpreting model data. Numerous organizations maintain mature modeling tools to evaluate sediment transport. Some USACE tools useful for evaluation of strategic placement sediment transport are described below. Additional models that quantify the ecological response and economic benefits of construction project alternatives can be applied to compare strategic placement alternatives once sediment accretion at the receptor site is quantified using sediment transport models. These ecological and economic models are not described in this document.
4.5.1.1 Sediment Mobility Tool (SMT)
The SMT (McFall et al. 2016) is a scoping level tool developed through the USACE Coastal Inlets Research Program and RSM Program that allows the user to determine the frequency of sediment mobility, as well as the general direction of transport. The SMT assists users in preliminary siting of nearshore placement areas with predominately sandy (non-cohesive) sediments. Linear and nonlinear stream function wave theories are used to predict frequency of mobility of sediment based on user input of grain size, water depth, wave characteristics, shoreline orientation, and current velocity approximated 3.3 ft above the bed.
4.5.1.2 Dean Number
The Dean Number is a dimensionless parameter that is used to determine onshore or offshore migration of material based on an empirical number determined by Larson and Kraus (1995). The Dean Number is provided in Equation 1, where Hb is the breaking wave height (feet), ω is the sand fall velocity (feet per second), and T is the wave period (s).
ERDC/CHL SR-19-3 58
Based on data from the USACE Field Research Facility, it was found that if the Dean Number is greater than 7.2, offshore migration of the sand bar is expected, and if it is less than 7.2 , onshore migration is expected. Finally, a wave rose is created to determine the axis of wave-dominated transport to illustrate approximate alongshore direction of sediment transport. While just a scoping level tool, the SMT provides a preliminary indication of how likely sediment will move, as well as the general sediment transport direction.
4.5.1.3 Gridded Transport (GTRAN) model
The GTRAN model (Smith et al. 2008) is similar to the SMT in that it predicts transport magnitude and direction for predominately sandy dredged sediments. The main difference is that GTRAN input includes hydrodynamics and waves from regional models, and GTRAN calculates transport direction and magnitude over a structured or unstructured grid covering a domain, not at a point. Typically, the grid used is from the hydrodynamic model. Advanced hydrodynamic models already exist for many regions with navigation infrastructure and include regions where dredged sediment would be placed. For these scenarios, application of GTRAN can be a screening level approach that takes advantage of modeling work already established for the site. GTRAN uses various formulae for combined wave/current transport of sandy sediments, and selection of the appropriate formula is performed automatically by the model. Different formulae are used for wave-dominated and current-dominated environments, for example. When transport is calculated on a relatively tight grid, sufficient transport calculation points exist to develop sediment transport pathways that will support strategic placement decisions.
4.5.1.4 Particle Tracking Model (PTM)
The PTM is a Lagrangian particle tracker developed for simulation of particle transport processes (McDonald et al. 2006 https://doer.el.erdc.dren.mil/ptm.html). PTM was developed for applications to dredging and coastal projects including fine-grained dredged sediment dispersion. Model input includes user-specified, time-varying hydrodynamic and wave conditions as well as dredged material properties. Output includes sediment transport rates, pathways, and fate. PTM can be
ERDC/CHL SR-19-3 59 ���� = �������� �������� (1)
used to quantify time-varying accumulation of dredged sediment at the receptor site(s) after resuspension from the placement site.
Since PTM imports spatially and temporally varying hydrodynamic and wave model output, multiple placement alternatives can be evaluated without requiring hydrodynamic simulations. This permits rapid evaluation of alternatives because PTM requires less computational time compared to Eulerian models such as the ADaptive Hydraulics (ADH) model (described below) or other Eulerian models within the Coastal Modeling System (CMS) or Geophysical Scale Multi-Block (GSMB) modeling system. However, these efficiencies are sometimes offset by additional uncertainties associated with Lagrangian models (compared to Eulerian models). BPJ should be used, and subject matter experts should be consulted when deciding if a Lagrangian approach is acceptable for a specific project.
4.5.1.5 Coastal Modeling System (CMS)
The CMS is an integrated two-dimensional numerical modeling system for simulating waves, currents, water level, sediment transport, and morphology change at coastal inlets and nearshore regions (Sanchez et al. 2014). Of the types of strategic placement discussed in this report, its most appropriate application would be for a nearshore berm project to illustrate hydrodynamic conditions induced by the placement. Such hydrodynamic conditions may include wave dissipation over the berm crest, changes in longshore current magnitude, and flow patterns caused by the presence of the berm. In addition to hydrodynamic data, the model can give the user a qualitative visualization of berm migration by mapping time-series survey data. Because cross-shore sediment transport is a three-dimensional process and CMS is a depth integrated tool, it is unable to quantitatively determine on or offshore movement of the berm. However, in the future, a Cross-SHORE two-dimensional (C2SHORE) transport model (Grzegorzewski et al. 2013) will be integrated with CMS to allow better resolution in terms of cross-shore sediment transport.
ERDC/CHL SR-19-3 60
4.5.1.6 Geophysical Scale Multi-Block (GSMB)
The GSMB modeling system 1 and the ADH model (Berger et al. 2008) are fully three-dimensional hydrodynamic and sediment transport models for simulating transport of clay, silt, and sand mixtures. These models are computationally and data intensive. However, application is often the primary method to obtain regulatory approval for placement of mixed cohesive dredged sediments because the models quantify fate of sand, silt, and clay fractions as well as the interactions between these sediment types. GSMB was applied at Mobile Bay, Alabama, in the strategic placement BUDM example described previously.
4.5.2 Monitoring
If pilot or demonstration studies are approved, they offer an excellent opportunity to monitor the placement sites for evidence of transport and fate. Unfortunately for rapidly dispersive sites, monitoring capabilities are limited because the signals (morphology, suspended solids concentration, etc.) of dredged material rapidly mixes with signals from surrounding sediments. Moderately dispersive sites or sites with large volumes can generally be monitored to evaluate transport direction by considerations of morphology, sediment tracer studies, and sediment samples.
1. Morphology: As described in examples for Fort Myers Beach, Florida; Egmont Key, Florida; and Perdido Key, Florida, morphology measurements were performed to demonstrate migration of the nearshore berm toward the beach. This type of morphology measurement is feasible for some situations, particularly when the dredged sediment feature stands in stark contrast to the surrounding bathymetry and migration is sufficiently slow to permit a time series of measurements to demonstrate migration direction.
2. Sediment tracer studies: There are several types of sediment tracers that can be utilized to evaluate the fate of dredged sediment. The dredged material may have a unique chemical signal such as beryllium decay or a host of other elements and chemicals that define site-specific sediment mixtures. These elements can be used to qualitatively determine sediment pathways by which the dredged
ERDC/CHL SR-19-3 61
1 Hayter, E., R. Chapman, P. Luong, G. Mausolf, and L. Lin. 2015. Sediment Transport Modeling for the St. Louis River Estuary 40th Avenue Shoals and Islands Design. ERDC Letter Report. Vicksburg, MS: U.S. Army Engineer Research and Development Center.
sediment is transporting. If naturally occurring tracers are not appropriate for a specific site, the dredged sediment site can be seeded with a fluorescent or magnetic tracer to evaluate the fate. These tracer studies are expensive but provide information on sediment fate that may not be obtainable by other means for some conditions (thin layer placement or rapidly dispersive sites with poor morphology signal, for examples). However, tracer study limitations, including qualitative verses quantitative evaluation must be recognized.
3. Sediment samples: Sediment sampling is a method to demonstrate that the desired sediment is transporting toward the resource target of the strategic placement, if the signal provided by sampling can be differentiated from that of background sediment. Samples can either be suspended or from the bed. Evidence of coarsening and fining of areas near the strategic placement site can provide solid lines of evidence that sand migration and silt/clay dispersion is occurring. This method, like any method, has limitations, and BPJ is critical to evaluation.
ERDC/CHL SR-19-3 62
5 Conclusions
This document has been developed to provide the user with a general outline of the concept of strategic placement and how it can be implemented. Strategic placement is not new to the USACE as demonstrated by the multiple examples provided in this report. However, expanding strategic placement applications will help address sediment budget deficits, receding shorelines, environmental restoration and sustainability, limited capacity in existing disposal facilities, and constrained budgets. Strategic placement aligns well with the USACE RSM and EWN initiatives by keeping sediment in the regional system and beneficially using sediment by harnessing hydrodynamic forces to move and sort these sediments in a manner that better resembles transport that would occur in the absence of anthropogenic activity.
Conclusions from this investigation include the following:
1. Strategic placement of dredged sediment to support the regional sediment system, reduce shoreline erosion, and nourish beaches has been practiced by USACE for decades.
2. Strategic placement supports USACE RSM and EWN strategies.
3. If properly applied, strategic placement can be part of a sustainable dredged material management solution because placement site capacity is renewed through transport of placed material offsite.
4. USACE navigation, flood risk reduction, and environmental restoration missions can be supported by strategic placement.
5. Strategic placement permits natural forces to perform the forcing functions required to transport sediment from the placement site to the receptor(s) of interest.
6. Strategic placement may require cost-share partners for incremental costs incurred by USACE above least-cost disposal options that adhere to the Federal Standard.
7. Sediment transport after strategic placement must be evaluated to optimize benefits and manage risk.
8. Strategic placement permits natural sorting of sediments by local hydrodynamic processes. These processes permit desired sediment classes to deposit in targeted receptor sites while other sediments are dispersed.
ERDC/CHL SR-19-3 63
9. Beneficial use of predominately sandy sediment through strategic placement is better understood and more widely practiced than beneficial use of muddy sediments.
10. Regional hydrodynamic conditions are used to evaluate fate of strategically placed sediment. These conditions can be quantified and better understood through models and field data.
11. CSM should be developed to increase benefits from strategic placement and manage identified risk.
12. Stakeholders and regulators should be an integral part of the team identifying and investigating strategic placement alternatives.
ERDC/CHL SR-19-3 64
References
Bailey, S. E., T. J. Estes, P. R. Schroeder, T. E. Myers, J. D. Rosati, T. L. Welp, L. T. Lee, W. V. Gwin, and D. E. Averett. 2010. Sustainable Confined Disposal Facilities for Long-Term Management of Dredged Material. ERDC TN-DOER-D10. Vicksburg, MS: U.S. Army Engineer Research and Development Center.
Berger, R. C., J. N. Tate, G. L. Brown, and G. Savant. 2008. Guidelines for Solving TwoDimensional Shallow Water Problems with the ADaptive Hydraulics (ADH) Modeling System Vicksburg, MS: U.S. Army Engineer Research and Development Center
Berkowitz, J. F., N. R. Beane, D. E. Evans, B. C. Suedel, and J. M. Corbina. 2014. Use of Strategic Placement of Dredged Sediments to Support Horseshoe Island in the Atchafalaya River, Louisiana: A Preliminary Ecological Survey. TN-EWN-14-4. Vicksburg, MS: U.S. Army Engineer Research and Development Center.
Bridges, T. S., J. Lillycrop. J. Wilson, T. Fredette, B. Suedel, C. Banks, and E. Russo. 2014. Engineering With Nature promotes triple-win outcomes. Terra et Aqua. 135: 17–23.
Bridges, T. S., P. W. Wagner, K. A. Burkes-Copes, M. E. Bates, Z. A. Collier, C. J. Fischenich, J. Z. Gailani, L. D. Leuck, C. D. Piercy, J. D. Rosati, E. J. Russo, D. J. Shafer, B. C. Suedel, E. A. Vuxton, and T. V. Wamsley. 2015. Use of Natural and Nature-Based Features for Coastal Resilience. ERDC SR-15-1. Vicksburg, MS: U.S. Army Engineer Research and Development Center,
Brutsché, K. E., and C. E. Pollock. 2017. Strategic Placement of Mixed Sediment in the Form of a Nearshore Berm along Fort Myers Beach, Florida. ERDC TN-EWN17-1. Vicksburg, MS: U.S. Army Engineer Research and Development Center. http://dx.doi.org/10.21079/11681/21616
Brutsché, K. E., P. Wang, T. M. Beck, J. D. Rosati, and K. R. Legault. 2014. Morphological evolution of a submerged artificial nearshore berm along a low-wave microtidal coast, Fort Myers Beach, west-central Florida, USA. Coastal Engineering 91: 29–44. doi:10.1016/j.coastaleng.2014.04.010
Brutsché, K. E., P. Wang, J. D. Rosati, and T. M. Beck 2015. Evolution of a swash zone berm nourishment and influence of berm elevation on the performance of beachnearshore nourishments along Perdido Key, Florida, USA. Journal of Coastal Research 31: 964–977.
Byrnes, M. R., and F. Li. 1998. Regional Analysis of Sediment Transport and Dredged Material Dispersal Patterns, Columbia River Mouth, Washington/Oregon and Adjacent Shores. Final Report. Prepared for U.S. Army Corps of Engineers, Waterways Experiment Station. Applied Coastal Research and Engineering, Inc., Mashpee, MA.
Byrnes, M. R., J. L. Berlinghoff, and S. F. Griffee. 2013. Sediment Dynamics in Mobile Bay, Alabama: Development of an Operational Sediment Budget. Prepared for Mobile Bay National Estuary Program Applied Coastal Research and Engineering, Inc., Mashpee, MA.
ERDC/CHL SR-19-3 65
Chapman, R. S., B. H. Johnson, and S. R. Vermulakonda. 1996. User’s Guide to the Sigma Stretched Version of CH3D-WES: A Three-Dimensional Numerical Hydrodynamic Salinity and Temperature Model. HL-96-21. Vicksburg, MS: U.S. Army Engineer Waterways Experiment Station.
de Schipper, M. A., S. de Vries, G. Ruessink, R. C. de Zeeuw, J. Rutten, C. van GelderMaas, and J. F. Stive. 2016. Initial spreading of a mega-feeder nourishment: Observations of the Sand Engine Pilot Project. Coastal Engineering 111: 23–38.
Gelfenbaum, G., C. R. Sherwood, C. D. Peterson, G. M. Kaminsky, M. Buijsman, D. C. Twichell, P. Ruggiero, A. E. Gibbs, and C. Reed. 1999. The Columbia River littoral cell: A sediment budget overview Proceeding of the 4th International Conference on Coastal Engineering and Coastal Sediment Processes. Long Island, NY: American Society of Civil Engineers.
Grzegorzewski, A. S., B. D. Johnson, T. V. Wamsley, and J. D. Rosati. 2013. Sediment transport and morphology modeling of Ship Island, Mississippi, USA, during storm events. Proceedings of Coastal Dynamics 2013, Archachon, France, 1505–1516.
Hamm, L., M. Capobianco, H. H. Dette, A. Lechuga, R. Spanhoff, and M. J. F. Stive. 2002. A summary of European experience with shore nourishment. Coastal Engineering 47(2): 237–264.
Isphording, W. C., and G. C. Flowers. 1987. Mobile Bay: The right estuary in the wrong place. Symposium on the Natural Resources of the Mobile Estuary MississippiAlabama Sea Grant Consortium. MASGC-W-87-002. National Oceanic and Atmospheric Administration. https://repository.library.noaa.gov/view/noaa/13678
Kim, S-Chan, and B. Suedel. 2015. Hydrodynamic and sediment transport modeling for Horseshoe Bend Island creation in the lower Atchafalaya River, Louisiana. Proceedings of the Western Dredging Association and Texas A&M University Center for Dredging Studies: Dredging Summit and Expo 2015 Houston, TX.
Larson, M., and N. C. Kraus. 1995. Prediction of cross-shore sediment transport at different spatial and temporal scales. Marine Geology 126(1–4): 111–127.
Lillycrop, L. S., J. W. McCormick, L. E. Parson, and M. A. Chasten. 2011. Adaptive management through regional sediment management Proceedings of the Western Dredging Association (WEDA XXXI) Technical Conference and Texas A&M University (TAMU 42) Dredging Seminar. Nashville, TN.
MacDonald, N. J., M. H. Davies, A. K. Zundel, J. D. Howlett, Z. Demirbilek, J. Z. Gailani, T. C. Lackey, and J. Smith. 2006. PTM: Particle Tracking Model – Report 1: Model Theory, Implementation, and Example Applications. ERDC/CHL TR-0620. Vicksburg, MS: U.S. Army Engineer Research and Development Center.
McFall, B. S., S. J. Smith, C. E. Pollock, J. Rosati, and K. E. Brutsché. 2016. Evaluating Sediment Mobility for Siting Nearshore Berms. ERDC/CHL CHETN-IV-108. Vicksburg, MS: U.S. Army Engineer Research and Development Center.
ERDC/CHL SR-19-3 66
Moritz, H., T. Puckette, J. Marsh, R. Boudrea, M. Siipola, and M. Ott. 2011. Utilizing sediment tracer studies to evaluate transport pathways at the mouth of the Columbia River. Proceedings of Coastal Sediments 2011. Singapore: World Scientific Publishing Company.
Mulder, J., and P. K. Tonnon 2011. Sand Engine: Background and design of a meganourishment pilot in The Netherlands. Proceedings, Coastal Engineering 2011, 32.
National Dredging Team (NDT). 2003. Dredged Material Management: Action Agenda for the Next Decade. EPA-842-B-04-002. Washington DC: U.S. Environmental Protection Agency
https://nepis.epa.gov/Exe/ZyNET.exe/300063PX.TXT?ZyActionD=ZyDocument&Client=EPA&Ind ex=2000+Thru+2005&Docs=&Query=&Time=&EndTime=&SearchMethod=1&TocRestrict=n&Toc =&TocEntry=&QField=&QFieldYear=&QFieldMonth=&QFieldDay=&IntQFieldOp=0&ExtQFieldOp= 0&XmlQuery=&File=D%3A%5Czyfiles%5CIndex%20Data%5C00thru05%5CTxt%5C00000008%5 C300063PX.txt&User=ANONYMOUS&Password=anonymous&SortMethod=h%7C&MaximumDocuments=1&FuzzyDegree=0&ImageQuality=r75g8/r75g8/x150y150g16/i425&Di splay=hpfr&DefSeekPage=x&SearchBack=ZyActionL&Back=ZyActionS&BackDesc=Results%20p age&MaximumPages=1&ZyEntry=1&SeekPage=x&ZyPURL
Parson, L., N. Lovelace, E. Godsey, K. Reine, and J. Gailani. 2015. Regional Sediment Management Strategy for Mobile Bay, Alabama. ERDC/CHL CHETN-XIV-41. Vicksburg, MS: U.S. Army Engineer Research and Development Center.
Sánchez, A., W. Wu, H. Li, M. Brown, C. Reed, J. Rosati, and Z. Demirbilek. 2014. Coastal Modeling System: Mathematical Formulations and Numerical Methods. ERDC/CHL TR-14-2. Vicksburg, MS: U.S. Army Engineer Research and Development Center.
Simpson, M., S. John, J. Brien, and A. Birchenough. 2005. A winning formula for port development in a sensitive environment. CEDA Dredging Days 2005 –Dredging: The Extremes Rotterdam, the Netherlands.
Smith, J. M., D. K. Stauble, B. P. Williams, and M. J. Wutkowski. 2008. Impact of Savannah Harbor deep draft navigation project on Tybee Island shelf and shoreline. ERDC/CHL TR-08-05 Vicksburg, MS: U.S. Army Engineer Research and Development Center.
Tate, J. N., and R. C. Berger. 2006. ADH Sediment Transport Module. TN-SWWRP-066. Vicksburg, MS: U.S. Army Engineer Research and Development Center.
U.S. Army Corps of Engineers (USACE). 1992a. Authority for Project Modifications to Improve the Environment. Washington, DC: U.S. Army Corps of Engineers. https://planning.erdc.dren.mil/toolbox/library/PL/sec1135.pdf
USACE. 1992b. Section 204, Water Resources Development Act of 1992, as Amended
Beneficial Uses of Dredged Material. Washington, DC: U.S. Army Corps of Engineers. https://planning.erdc.dren.mil/toolbox/library/PL/WRDA1992-Section204.pdf
USACE 1995. Simulation of Dredged Material Disposal at Coos Bay Ocean Dredged Material Disposal Site F, with Attached Follow-Up Study Documenting Observed Bathymetry Change. Portland, OR: U.S. Army Engineer District, Portland.
ERDC/CHL SR-19-3 67
–
USACE. 2012. Environmental Assessment: Proposed Nearshore Disposal Locations at the Mouth of the Columbia River Federal Navigation Project, Oregon and Washington. Portland, OR: U.S. Army Engineer District, Portland.
USACE/U S. Environmental Protection Agency (USEPA) 2016. 2017 Annual Use Plan: Management of Open Water Dredged Material Placement/Disposal Sites, Mouth of the Columbia River, Oregon and Washington. Portland OR: Report by the U.S. Army Corps of Engineers, Portland District, and U.S. Environmental Protection Agency Region 10.
USEPA/USACE. 2004. Evaluating Environmental Effects of Dredged Material Mangement Alternatives – A Technical Framework. Report EPA842-B-92-008
Washington DC: U.S. Environmental Protection Agency, and U.S. Army Corps of Engineers.
USEPA/USACE. 2007a. The Role of the Federal Standard in the Beneficial Use of Dredged Material from U.S. Army Corps of Engineers New and Maintenance Navigation Projects EPA842-B-07-002 Washington DC: U.S. Environmental Protection Agency, and U.S. Army Corps of Engineers. https://www.epa.gov/cwa404/role-federal-standard-beneficial-use-dredged-material
USEPA/USACE. 2007b. Identifying, Planning, and Financing Beneficial Use Projects Using Dredged Material: Beneficial Use Planning Manual. Report EPA842-B07-001. Washington DC: U.S. Environmental Protection Agency, and U.S. Army Corps of Engineers.
Vroom, J., B. van Maren, J. Marsh, and A. C. ven der Lelij. 2017. Effectiveness of the Mud Motor near Koehool – Results and Interpretation of a Tracer Study. Report 1209751-004. The Netherlands: Deltares, Delft.
Wang, F. C. 1984. The dynamics of a river-bay-delta system. Journal of Geophysical Research 89(C5): 8054–8060.
Welch, M., E. T. Morgen, and L. Beeney. 2016. A Literature Review of the Beneficial Use of Dredged Material and Sediment Management Plans and Strategies. Publications and Reports No. 34. Portland OR: Portland State University. Center for Public Services. http://pdxscholar.library.pdx.edu/publicservice_pub/34
ERDC/CHL SR-19-3 68
Unit Conversion Factors
ERDC/CHL SR-19-3 69
Multiply By To Obtain cubic yard (cy) 0.7645549 cubic meters feet 0.3048 meters miles per hour 0.44704 meters per second pounds (force) per square foot 47.88026 pascals square feet 0.09290304 square meters square miles 2.589998 E+06 square meters yards 0.9144 meters
The public reporting burden for this collection of information is estimated to average 1 hour per response, including the time for reviewing instructions, searching existing data sources, gathering and maintaining the data needed, and completing and reviewing the collection of information. Send comments regarding this burden estimate or any other aspect of this collection of information, including suggestions for reducing the burden, to Department of Defense, Washington Headquarters Services, Directorate for Information Operations and Reports (0704-0188), 1215 Jefferson Davis Highway, Suite 1204, Arlington, VA 22202-4302. Respondents should be aware that notwithstanding any other provision of law, no person shall be subject to any penalty for failing to comply with a collection of information if it does not display a currently valid OMB control number.
PLEASE DO NOT RETURN YOUR FORM TO THE ABOVE ADDRESS.
1. REPORT DATE
June 2019
4. TITLE AND SUBTITLE
2. REPORT TYPE Final Report
Strategic Placement for Beneficial Use of Dredged Material
6. AUTHOR(S)
Joseph Gailani, Katherine E. Brutsché, Elizabeth Godsey, Ping Wang, Michael A. Hartman
3. DATES COVERED (From - To)
5a. CONTRACT NUMBER
5b. GRANT NUMBER
5c. PROGRAM ELEMENT NUMBER
5d. PROJECT NUMBER
5e. TASK NUMBER
5f. WORK UNIT NUMBER BL015G
7. PERFORMING ORGANIZATION NAME(S) AND ADDRESS(ES) (see reverse)
8. PERFORMING ORGANIZATION REPORT NUMBER
ERDC/CHL SR-19-3
9. SPONSORING/MONITORING AGENCY NAME(S) AND ADDRESS(ES)
U.S. Army Corps of Engineers
Washington, DC 20314-1000
12. DISTRIBUTION/AVAILABILITY STATEMENT
Approved for public release; distribution is unlimited.
13. SUPPLEMENTARY NOTES
14. ABSTRACT
10. SPONSOR/MONITOR'S ACRONYM(S) USACE
11. SPONSOR/MONITOR'S REPORT NUMBER(S)
The U.S. Army Corps of Engineers (USACE) and the U.S. Environmental Protection Agency are changing their perception of dredged material, from a byproduct of the dredging process to a valuable resource. The negative perception of navigation dredged material is codified under the 1972 Clean Water Act Section 502, which specifically defines “dredge spoils” as a pollutant, along with solid waste, sewage, and garbage. However, navigation dredged material is typically a mixture of sand, silt, clay, and possibly gravel. These sediments resources are critical to controlling flood risks and providing environmental benefits. This document provides details regarding the use of dredged material to support NNBF through strategic placement. Strategic placement is the process of placing sediment at one location with the expectation that hydrodynamic and possibly aerodynamic forces will transport specified classes of that sediment to desired locations. Strategic placement is a beneficial use option that may have less negative impact on the final receptor sites and often can be performed at a reduced cost when compared to direct placement (such as beach nourishment). Cost controls are critical to developing sustainable dredged sediment management plans that address the Federal Standard, which guides the disposal and placement of dredged material.
15. SUBJECT TERMS
Dredging, Dredged material, Dredging spoil, Sedimentation and deposition, Sediment control, Sediment transport
REPORT DOCUMENTATION PAGE
No.
Form Approved OMB
0704-0188
16. SECURITY CLASSIFICATION OF: 17. LIMITATION OF ABSTRACT SAR 18. NUMBER OF PAGES 80 19a. NAME OF RESPONSIBLE PERSON ili a. REPORT Unclassified b. ABSTRACT Unclassified c. THIS PAGE Unclassified 19b. TELEPHONE NUMBER (Include area code) 601-634-4851 Standard Form 298 (Rev. 8/98) Prescribed by ANSI Std. Z39.18
PERFORMING ORGANIZATION NAME(S) AND ADDRESS(ES) (continued)
Coastal and Hydraulics Laboratory
U.S. Army Engineer Research and Development Center
3909 Halls Ferry Road
Vicksburg, MS 39180-6199
Mobile District, U.S. Army Corps of Engineers
109 St. Joseph Street
Mobile, AL 36602
University of South Florida
Coastal Research Laboratory CHE 215
Tampa, FL 33620
7.