
June 2024
Report by
Dr. Sondeania Johnson
Dr. Christopher Swanson
Desiree Taylor
Tiffani Martin
Jon Farley
Bill Hudson


June 2024
Report by
Dr. Sondeania Johnson
Dr. Christopher Swanson
Desiree Taylor
Tiffani Martin
Jon Farley
Bill Hudson
This work was made possible through funding from the Maryland State Department of Education, Division of Early Childhood and private funders.
A group of leaders served as an advisory committee to the project. The authors thank the following individuals for their service:
Christina Peusch, Executive Director, Maryland State Child Care Association
Ruby Daniels, Executive Director, Maryland State Family Child Care Association
Molly McGriff, Senior Director, United Way of Central Maryland
Lacey Eidman, Director, Maryland Family Network
Linda Zaldivar, Executive Director, Latino Child Care Association of Maryland/ FCC Owner-Operator
Christina Lopez, President, Maryland Association for the Education of Young Children; currently Director of the Maryland Early Childhood Leadership Program
The authors thank the Family Child Care Alliance of Maryland Leadership and Board of Directors for their support in this work.
The authors wish to thank Dr. Sally Farley for statistical support. Design and layout by Be Kinetic, be-kinetic.com

Maryland has implemented a historic focus on early childhood with the Blueprint for Maryland’s Future. This legislation has created an unprecedented opportunity to expand preschool to all of the state’s three- and four-year-old children through a mixed-delivery system across the continuum of public, center, and family child care (FCC) providers.
While the “Blueprint” brought many positive opportunities, including funding, for all early care and education professionals, it increased requirements for participation in Pre-K expansion grants. To understand the potential barriers in meeting the requirements under Blueprint, and potential unintended consequences from implementation, the Family Child Care Alliance of Maryland commissioned this study. Using a mixed method research design, a survey sample of 294 responses were collected in English and Spanish with 171 fully completed from FCC providers across the state, accompanied by 25 focus group interviews and 8 individual cost-profile constructed models.
Several key findings emerged:
• Approximately 44.2% of survey respondents indicated a risk of closing in the next three years, adding to the continuing downward trend line in Maryland’s FCC supply which disproportionately impacts children of color, those with developmental differences, those who are economically disadvantaged and those who live in rural areas more than other groups.
• The top three cited reasons for leaving were “burn out,” “New/additional requirements,” and FCC being “financially not viable.”
• Only 10% of the FCC field met the Maryland EXCELS criteria for participation in Pre-K expansion, let alone remaining requirements around teacher credentials and certification which were all cited as major barriers by participants.
• The theme of burden: having too many competing demands for typically one owner/operator to reasonably perform kept emerging across survey and focus group responses, with current support systems not effectively meeting the needs of the provider community.
• There is a shifting demographic of providers requiring more bi-lingual resources and materials. Additionally, there is a trust and information gap that exists between providers and the agencies and support systems meant to serve them, leading to wide-spread misinformation.
• Six of the eight constructed cost-models based on interviews and analyzed cost data reveal those providers earning less than minimum wage, functioning below defined guidelines of poverty and Asset Limited, Income Constrained, Employed (ALICE) – with one provider operating at a loss.
• None of the providers, even the two most profitable, are able to provide benefits to themselves or employees.
• Even for those providers that qualified for participation in Pre-K expansion, it would be economically disadvantageous to do so given the established reimbursement rate and current risk of dis-enrollment of children given grant compliance and reporting administration burdens.
• While this study was commissioned to examine Pre-K expansion and FCC, because FCC is often a mixed-aged enrollment model, the continued loss of FCC programs threatens the supply of infant and toddler care, which further challenges Maryland’s ability to returns employee’s to the workforce; particularly women where the state trails its neighbors.
A set of seven recommendations are suggested for implementation to address these challenges:
1. Develop a continuum-wide definition by program-type of the unique benefits and focus of each type of child care/early education program within Maryland’s mixed delivery system: to enable a strong recommendation system to better match a child with a specific program type, focusing on inherent strengths and unique attribute of each program.
2. Implement a “Provider Hub+ Model:” to reduce the burden felt by FCC providers, build upon the concept of “Hubs” defined in the recent Maryland House Bill 1441to establish the type of robust and comprehensive support system public schools benefit from by being within a Local School System, by offering centralized logistical operational and managerial support, while also addressing challenges and costs around the need for substitute pools, shared services to lower expenses, bulk vendor service agreements, and to improve communication and coordination with entities like MSDE, school-systems, and the network of third-party technical assistance providers.
3. Fund FCC by the slot with guaranteed payments: to address the financial uncertainties that come from the high-level of under-enrollment when children frequently transition and/or have non-uniform start dates as is typical in K-12. Payment by the slot provides greater revenue stability for these private businesses, which is needed to reduce the risk of making the investments necessary to meet the Blueprint requirements.
4. Create a managed enrollment system: to better mitigate under-enrollment and improve program matches based on individual child needs across the entire continuum of Maryland’s early care and education delivery system. A universal enrollment system that allows all providers, resource and referral entities, and consumers to see real-time vacancies and strengths of a given program for a recommended “child profile” would help inform consumer choice and reduce both child recruitment but also mismatched placements that harm child progress.
5. Establish alternative competency professional pathways: to address the realities of the field’s current readiness to obtain degrees based on pre-requisite educational levels, available time and expense, and perceived return on investment. Given the current wage gap between FCC and local school systems and the staffing shortages in the latter, mandating degrees for all FCC may in fact exacerbate the FCC supply shortage as those providers find higher wages with benefits and less intensity working in the public schools while simultaneously pushing out experienced FCC providers who are towards the end of their careers and don’t see the benefit of investing in education when weighed against the financial and personal costs.
6. Establish professional supports: to address perceptions from providers of discrepancies between their professional standing and their K-12 colleagues, through models such as local business discount programs and establishing paid employee benefit pools.
7. Create a culture shift: to address the trust deficit and communication gaps, a systemic culture shift needs to occur that focuses on relationship building versus more informational sharing. Strategies such as creating opportunities for authentic engagement between providers and policy-makers and other key stakeholders; ensuring representation of perspectives across initiatives prior to decision-making; and creating forums for leadership to have frank and open dialogue with stakeholders to dispel factual inaccuracies that take root amongst the provider community are critical to creating an effective, collaborative, and impactful early childhood system in Maryland.
A child’s experience between birth and the start of kindergarten can shape the rest of their life. From increased graduation rates, life expectancy and lifetime earnings to reduced incarceration levels, strong early childhood programs have been shown to significantly yield both individual and societal benefits.1 In the United States, these known benefits have spurred national attention on improving the quality of early childhood care and education (ECEC) programs; increasing access to these programs, particularly for children facing adverse childhood experiences (ACEs); and creating, at minimum, universal pre-kindergarten (Pre-K) experiences for three and four-yearolds, with many advocating for addressing the needs of infants and toddlers too. Despite the recognized critical importance of this age, the U.S. system of child care is fragmented with highly variable regulation and requirements across the nation. Pre COVID-19 pandemic, there were approximately 3.8 million ECEC settings serving 12.1 million children from birth to age five: roughly 58.7% of the 20 million U.S. children under age 5. 2 While there are multiple ECEC options, such as center-based, publicpreschool, nursery school, and income eligibility driven Head Start programs, the vast majority of child care is provided in the home of a non-parental individual, comprising nearly 97% of all available care.3 Family Child Care (FCC), can be licensed or legally operating unregulated programs that provide care for children of mixed ages, out of the home of a paid child care provider. Most states have enrollment caps, but that number varies across the country and by age of children. FCC accounts for 27.5% of all home-based care; employing about 1,037,000 before the pandemic. About 11% of children under age 5, more heavily weighted toward infants and toddlers, were enrolled in FCC.4 That leaves the bulk of home-based care, 72.5%, to be a mixture of friends, families, neighbors, and in-home nannies who provide informal, often unregulated supervision for pay or no-cost, of more than 5 million children. Incidents of abuse, neglect, and death are more likely to happen in unregulated care environments.5 Despite this risk, families report choosing both regulated and unregulated FCC because of affordability, flexibility in hours to match work schedules, the home-like setting, smaller size, parental comfort with the provider, and access, as there are often higher numbers of FCC providers than other types of ECEC programs, particularly in rural communities.6 Additionally, FCC has a history of providing cultural
1 McCoy et al. 2017
2 CED 2019
3 Hussar et al. 2020
4 NSECEPT 2016
5 Cohn 2013; Wrigley & Dreby 2005; Swanson eds. Morphew et al. 2024
6 NACRHHS, 2023; Pattnaik and Lopez 2023
and linguistic environments reflective of the children they serve.7 Of the options families have for child care, FCC has remained a critical part of the U.S. model, providing both ECEC and before and after-school programming. In 2019, roughly 5% of the U.S. population below age 19, just over 4.3 million children nationwide, were enrolled in approximately one million FCC programs.8
As such, the movement toward universal Pre-K has often featured a mixed delivery model, relying on increasing access to quality Pre-K programming through a variety of settings. This includes expanded settings within public schools, but also reliance on community-based settings – privately operated center-based classrooms, regulated FCC providers, and Head Start programs.9 Such an approach not only addresses the consumer reality of preferred settings for their child, but also practical realities of availability of slots for children. Even before COVID-19, America’s ECEC system was in crisis. Pre-pandemic, studies found nearly half the U.S. suffering from “child care deserts’’ defined by having more than 3 eligible children per available slot,10 and there were downward trends in the number of regulated FCC providers leading into COVID,11 with the industry having contracted by about 20% between 2014 and 2017. Since 2019, the U.S. lost another 11% of its FCC supply.12 This is particularly impactful on Black and Latino families who rely more heavily on FCC than those who are White.13 While nationally the number of center-based child care programs have increased over pre-pandemic levels, the number of ECEC workers remains significantly below 2020 levels. Child care is one of the slowest industries to recover, with over 40,000 vacancies remaining,14 and continued labor shortages having a significant impact on states’ ability to offer ECEC slots at large, and Pre-K enrollments in particular. In the 2018-2019 school year, 37 percent of four-year-old and 6 percent of three-year-old children were enrolled in publicly funded preschool programs.15 After significantly dropping during the pandemic, enrollment levels have nearly returned at 32 percent of four-year-olds and 6 percent of three-year-old children.16 Still, this demand comes in the face of dramatic labor shortages. Likewise, it comes at a time when there is not widespread implementation of practices widely regarded as critical to achieving the positive outcomes associated with quality early childhood experiences. The National Institute for Early Education Research (NIEER) has
7 Muenchow et al. 2020
8 Administration for Children and Families 2021; Pattnaik and Lopez 2023
9 Garver et al. 2023
10 CED 2019
11 Henly and Adams 2019
12 Child Care Aware 2022
13 Henly and Adams 2019
14 Crouse, Ghertner, and Chien 2023
15 Friedman-Krauss et al. 2020
16 Friedman-Krauss et al. 2023
published a respected set of 10 quality standards essential to impactful preschool experiences. Only six publicly funded Pre-K programs in five states met all 10 standards in academic year 2021-2022, the most recent for which data is available, and 37% of children nationwide attend public Pre-Ks with less than half of the standards in effect.17
While numerous studies have shown significant benefits for children who attended high-quality ECEC programs, Vanderbilt researchers, in a scientifically rigorous randomized controlled longitudinal study, found the opposite to be true for Tennessee preschoolers who attended public Pre-K programs that met nine out of the 10 NIEER standards. Following these children most recently to sixth grade, they fared worse on academic and behavioral measures than peers who attended Head Start and community care ECEC programs, both FCC and centerbased, or even had parental/relative care during their preschool years.19 Other studies have shown fade-out effects, suggesting benefits were short-term, though counter-arguments have noted the dramatic differences in environments of the early childhood versus K-12 experience in those studies.20 While the researchers did not specifically test aspects of the other ECEC environments compared to the public Pre-K classrooms, they did provide some considered points as possible explanations.
17 Friedman-Krauss et al. 2023
18 Lovejoy and Gibbs 2023
19 Durkin et al. 2022
20 Bailey et al. 2017
NIEER’s minimum standards for states’ implementing high-quality Pre-K
Cited in Lovejoy and Gibbs (2023, 12)18
Establish early learning and development standards that are comprehensive, aligned, supported, and culturally sensitive.
Include curriculum supports that incorporate an approval process for curriculum selection and support for curriculum implementation.
Require lead teachers in every classroom to have at least a bachelor’s degree.
Require lead teachers to have specialized preparation that includes knowledge of learning, development, and pedagogy specific to preschool-age children.
Require assistant teachers to hold a Child Development Associate (CDA) credential or have equivalent preparation based on coursework.
Require both teachers and assistant teachers to have at least 15 hours of annual in-service training. In addition, some professional development must be provided through coaching or similar ongoing classroom-embedded support.
Limit class size to 20 children.
Permit classrooms to have no more than 10 children per classroom teaching staff member.
Require that preschool programs ensure children receive vision and hearing screenings and at least one additional health screening as well as referrals when needed.
Require that data on classroom quality be systematically collected and that local programs and the state both use information from the QIS to help improve policy or practice.
1) The public Pre-Ks in the sample were relatively uniform, utilizing a state implemented curriculum, teacher training requirements, class-size, program structure, and length of day. The other ECEC experiences were generally smaller, allowing for more intensive adult to child interaction and support.
2) The authors point to the difference between “constrained” versus “unconstrained” skills. Constrained skills are those which are concrete and definable for mastery – e.g. you know all 26 letters of the alphabet; you know all days of the week; you can count numbers – as compared to Unconstrained skills which are more application based, and constantly evolve through opportunities to build and refine meaning. Examples here include reading comprehension; word problems; and critical thinking skills. 21 Additionally, attention and working memory – part of our executive functioning ability that also helps regulate behaviors – are unconstrained skills. As public Pre-K programs are under pressure to demonstrate gains in schools readiness as measured by tests that tend to assess constrained skills, curriculum and instruction in these environments are geared toward that modality, which produces short-term gains without long-lasting skills development.
3) Play-based, experiential, exploratory programming with strong child-engagement and interactions characterize developmentally appropriate practices (DAP) in high-quality ECEC, and these methods are associated with cultivating unconstrained skills, 22 yet too often these methods are sacrificed for traditional instruction believed to prepare students for success on academic tests.23 The non-public Pre-K attendees who outperformed their peers were likely exposed to more consistent DAP practices associated with growing unconstrained skills, as those are practices often associated with FCC, center-based ECEC and Head Start, and are consistently measured for implementation through third-party monitoring via statewide quality rating and improvement systems (QRIS), early childhood accreditation, and an array of other technical assistance and inspection personnel. At the same time, even in studies that have shown faded academic advantages by third-grade – as measured by constrained skill assessment results – for children who attended “quality” Pre-K compared to peers – reexamining for sustained benefits in unconstrained skills has shown to have a lasting impact. 24
21 Paris 2005
22 Danniels and Pyle 2023; Zosh et al. 2022
23 Harvey and Ohle 2018; Schachter, Strang and Piasta 2017
24 Johnson et al. 2022
4) As these unconstrained executive functioning skills have been linked to lifelong positive outcomes, 25 it is clear where the linkage between benefits and strong ECEC experiences needs to focus. The question is not whether universal Pre-K benefits children, but what are the most effective ways to implement such a model, given the realities faced by the field?
This report, commissioned by the Family Child Care Alliance of Maryland (FCCA), with funding from the Maryland State Department of Education (MSDE), Division of Early Childhood, and solicited private funding, examines associated barriers, potential supports, and known costs incurred by Maryland FCC providers in trying to meet the state’s objectives of expanding Pre-K programming through a mixed delivery model. A historic focus on ECEC was included in Maryland’s transformative educational legislation: The Blueprint for Maryland’s Future. 26 This landmark legislation, passed in 2021, includes a focus on early childhood education as one of its five core pillars; with Pre-K expansion one of the main goals. Of course, this came at a time when Maryland was still feeling the effects of COVID, and the state was not immune to the national challenges previously described. This coincided with a time of leadership transition within the state, changes from the governor to the superintendent of education to leader for the state’s early childhood efforts, and the director for the Office of Child Care. Prolonged vacancies exasperated a sense from Maryland ECEC providers of the unknown – not knowing how the new legislation, new leadership, and new realities moving forward from COVID would impact them.
The FCCA was formed in 2019 as a nonprofit family child care network. Its founding focus was to serve as a backbone organization to assist FCC providers at the operational level, augmenting existing organizations’ policy and advocacy work, and complementing other groups broader ECEC training and technical assistance. Anticipating the coming legislative mandates of the Blueprint, MSDE engaged the FCCA to implement a Pre-K training and technical assistance program called ASPIRE designed to prepare FCC providers to meet Pre-K expansion requirements. From that position, FCCA heard and saw first-hand the challenges the FCC providers they worked with faced, and they also were receiving feedback about ways FCC providers could be better supported to deliver high-quality universal Pre-K that reaps the long-term benefits associated with such programming. As such, FCCA sought to understand the experiences and perspectives across the entirety of Maryland’s FCC workforce. What follows are the results of an online survey collection conducted in both English and Spanish through the summer of 2023 designed to identify top barriers and potential supports for all of Maryland’s FCC providers’ participation in Pre-K expansion efforts. Supplemental interviews with key leaders and volunteer FCC participants offer
contextual understanding around potential policy and practice implications connected to the Blueprint’s implementation and associated costs for FCC providers.
The results of this study revealed the following high-level challenges facing Maryland FCC providers in implementing Pre-K expansion:
• Even with the increased investment afforded by the Blueprint and added monies through federal stabilization funding, there is a perception of not enough economic incentive to drive wide scale adoption of requisite changes needed to be eligible to participate in Pre-K expansion – and no confidence that governmental reimbursements will be sustained to help providers recoup their expenses.
• The FCC community reports communication between MSDE, local school systems and the FCC community needs improvement. A theme with the FCC members interviewed was a feeling of not being understood by those agencies and not being prioritized.
• There is a feeling of impossibility – that the demands of meeting the Blueprint requirements are too much, both administratively and pedagogically, and actually detract from the providers’ ability to meet the needs of children and families. While none of the interviewees cited empirical research, many spoke to pressure to implement a Pre-K program that would shift them away from developmentally appropriate practices.
This study also identified several promising ideas and strategies providers felt would be helpful toward FCC’s participation in Pre-K expansion. Top-level recommendations are:
• Creating a Provider Hub+ Model that functions like a “virtual school system” – building upon the H.B.1441’s concept of support hubs, this would be a statewide, centralized model, to which all FCC providers were a part. A commonly expressed sentiment by respondents was wearing too many hats: owner/operator, business office, principal, nurse, cook, teacher, administrative staff – roles that are distributed organizationally across local educational agencies and public schools, and even many centers. Having a common, centralized entity to assist with administrative and logistical efforts, that clearly understands FCC as small business operators, while also supporting their ability to implement DAP was a top request.
• Restructuring the funding process to FCC providers to allow more upfront investment versus reimbursements; easier, faster, and more reliable disbursement mechanisms; and moving from a competitive grant process to a qualified application model.
• Improving all communication efforts, which is partly solved via the virtual school-system, but also ensuring multi-lingual distribution is the norm.
Ultimately, Maryland has many of the ingredients necessary to implement a robust and impactful mixed-delivery universal Pre-K system, but it runs the risk of repeating Tennessee’s outcomes if the appropriate infrastructure is not put into place that meets consumer needs, ensures DAP that grow unconstrained skills, and supports FCC as a valued and critical partner within the system.
This will be explored through the following sections:
• Background: The Maryland Landscape
• Methodology
• Results
• Discussion
Maryland is a mid-Atlantic state comprised of 24 counties.
Maryland is a mid-Atlantic state comprised of 24 counties, including Baltimore City, each with their own Local Education Agency (LEA) which is the governing public school-system for each jurisdiction. Maryland is the 42nd largest state, comprised of rural, urban, and suburban communities, sometimes within the same county. In 2023, Maryland had a total estimated population of 6,180,253. 27 The population is 48.3% White; 31.7% Black or African-American; 11.5% Hispanic or Latinx; 7.1% Asian; 3.2% multi-racial; .7% Indigenous American; .1% Native Hawaiian/Pacific Islander. The state has 2,318,214 households with approximately 352,274 children under age five. While 9.6% of the overall population is living in poverty per the federal definition, that number increases to 11% for children under five;28 and jumps to 30% when looking at households that are economically disadvantaged, defined as having an income less than $55K for a family of four. 29 There were approximately 206,762 infants and toddlers; and 143,082 three and four-year-olds in 2022.30 About 72.7% of children under three live in two-parent households; 24.7% are in single-parent homes; and 2.6% do not live with a parent.31 Maryland is below the national 3.7% unemployment level with a 1.8% rate.32 The state is nearly 50/50 in terms of gender composition of the workforce, with about 1.7 million male and female workers respectively. On average, males work 40.4 hours per week while the mean for female workers is 37.1 hours.33
Approximately 74% (n=299,000) of children under six have all available parents in the workforce.34 There are 68.4% of Maryland infants and toddlers with a mother in the workforce.35
27 U.S. Bureau of the Census 2023
28 The Annie E. Casey Foundation 2023
29 Cole, Trexberg and Schaffner 2023
30 The Annie E. Casey Foundation 2023
31 Cole, Trexberg and Schaffner 2023
32 Bureau of Labor Statistics 2023
33
34
U.S. Bureau of the Census 2022
U.S. Bureau of the Census 2023
35 Cole, Trexberg and Schaffner 2023
While Maryland has a 65.2% labor participation rate (LPR), the measure of both employed and unemployed individuals seeking employment, which is better than the national average, there are several implications in this figure for Maryland’s ECEC providers. First, this number helps explain the labor shortage being felt by ECEC providers, including FCC operators looking to hire additional staff. Maryland has 3.1 job openings for every 1 job seeker compared to the national rate of 1.3 openings per candidate.36 Secondly, while there has been a decreasing trend since 2013, COVID accelerated the LPR decline, particularly for Maryland women. In 2021, 18% of women aged 25-34 were no longer participating in the workforce. Since the start of the pandemic, Maryland saw a 2% loss of employment for women aged 16-24 and 25-34, equating to about 100,000 fewer women in Maryland’s workforce.37 Not only does this reduce demand for ECEC programs, with rising child care costs in turn being cited as a reason for women leaving the workforce, but it also further constrains potential ECEC workforce supply. The alarming concern is Maryland is not recovering these workers as quickly as the nation or surrounding states, and surveys indicate many may opt not to return to the workforce. As nearly 500,000 women in Maryland have households with all children under six, 38 it is not a surprise when women exiting the workforce cite the rising cost and availability of child care as drivers to their decision to not work.39 Maryland’s higher than the national average median household income rate of $91,431,40 ironically paired with the widening wage disparity between female and male earners, incentivizes many households to shift to a stay-at-home parent model, where cost of child care represents an average expense of 22.4% of total household income, making it within the top two household expenses across all Maryland jurisdictions,41 and far exceeding the 7% “affordability” recommendation set forth by the U.S. Department of Health and Human Services.42 Per the Maryland Comptroller Report,43 many of the women surveyed are leaving the workforce to care for children with a rationale that losing one income is less costly than having two incomes while still paying for child care services. Not only is this problematic for maintaining the supply of child care for families, but it also deprives children of the benefits of being exposed to quality developmentally appropriate practices.
36 Comptroller of Maryland 2023
37 Comptroller of Maryland 2023
38 Maryland Family Network (MFN) 2023
39 Comptroller of Maryland 2023
40 U.S. Bureau of the Census 2022
41 Maryland Family Network (MFN) 2023
42 U.S. Department of Health and Human Services 2023
43 Comptroller of Maryland 2023
The United States Chamber of Commerce found a national trend of 32% of unemployed women citing the need to provide care for a family member as the reason they would not return to the workforce.44 This aligns with research from the Maryland Family Network that shows a correlation between increased cost of child care and decreased participation by women in the workforce.45 Overall, Maryland is the eighth most expensive state for child care in the country,46 on a multi-year trend of increase. Between 2019 and 2023, the average cost of Maryland child care rose between 14-30% across all provider types.
Maryland had 8,090 child care and early education programs in June 2023.47 This represents a near return to pre-pandemic child care supply levels, but a reduction of capacity as Maryland’s early childhood workforce remains nearly 25% below prepandemic levels.48 Maryland is a regulated care state requiring licensure and ongoing inspection to legally operate any child care business. Licensing sets safety, efficacy, and supervisory expectations, and states that utilize regulated care have lower incidences of child abuse, neglect, and death than those that do not.49 Licensing establishes ratios of care – the number of children who can be served by an adult according to program type and size and child’s age.
Maryland licenses the following types of child care and early education programs, which can have subset types:
• Child Care Centers (Centers)
Letter of Compliance Facilities
Nursery Schools
Preschool Only
Infants and Toddler Only
School-Age (Before and After School and non-school day programming)
• Family Child Care (FCC)
Large Family Child Care Homes
44 Ferguson 2022
45 Maryland Family Network (MFN) 2023
46 Ferguson 2022
47 Maryland Family Network (MFN) 2024
48 Maryland State Child Care Association (MSCCA) 2023
49 Swanson 2024
Table 1 shows the allowed ratios and maximum number of children in Child Care Centers per class by age in accordance with the Code of Maryland Regulations (COMAR) 13A.16.01:50
Table 1. COMAR Licensing Ratios for Child Care Centers
FCC have two categories of licensed programs, “typical” FCC and Large Family Child Care Homes that are legally allowed to operate at higher capacity based on their physical space and staffing requirements (See COMAR 13A.18.01-.16).51 Ratio and staffing requirements for these programs follow:
• FCC can have up to eight children present for care in the home at one time; Large FCC can have up to 12 children, inclusive of related children.
• A ratio of two children under age two may be present for each MSDE qualified and approved staff member, with a maximum of four children under two regardless of staffing. Most FCC are owner/operator solely staffed. Large FCC adhere to the 1:3 ratio of Centers with a maximum of six children per class.
On March 27, 2020, by order of the governor, all Maryland child care was closed, with a program to allow for re-opening through the Essential Personnel Child Care (EPCC) and Essential Personnel School Age (EPSA) programs. These ultimately allowed 3,778 child care providers to resume operation by May 2020 under COVID mitigation and protection protocols, and serving about 25,000 children of Maryland’s essential personnel workforce.52 While Maryland’s supply of early education programs has mostly recovered, the distribution of program types has been uneven, with FCC providers continuing a declining trend seen since 2018. In 2018, Maryland had 5,938 licensed FCC providers. At the start of the pandemic in 2020, that number had declined to 5,126, and is currently at 4,023 in 2023.53 Figure 1, from the Maryland Child Resource Network 2023 Child Care Demographics Report, 54 shows the trendline with a future projection for FCC market contraction through 2027.
50 Code of Maryland Regulations 2020
51 Code of Maryland Regulations 2015
52 Maryland Family Network (MFN) 2020
53 Maryland Family Network (MFN) 2024
54 Maryland Family Network (MFN) 2023
of Family Child Care Providers
Comparatively, Maryland licensed Child Care Centers, defined as those which serve children from infants to school-age and operate on 8-12 hour schedules, numbered 1,551 in 2020; spiked to 1,790 in 2022 before coming back down to 1,680 in 2023. While there are a number of factors for these trends, some of which are explored through this report, the loss of FCC is consequential as it disproportionately impacts families of color, families who are economically disadvantaged, and families who already have access challenges to child care and early education. 1,789 of FCC providers accept children receiving Child Care Scholarship, Maryland’s subsidy program for the cost of child care for income-eligible families. This is compared to 1,091 Child Care Centers.56 FCC providers are often where families turn when their child has development and learning needs, with 1,290 serving children in this category compared to 726 of Centers.57 In both categories, we also know the need is far greater, with the recently increased number of children participating in the Child Care Scholarship to 40,632 (MSDE DEC, 2024)58 reflecting approximately 53% of Maryland families who should be eligible (using Weingarten, 2023 reporting of 16,693 = 22% of need).59 In terms of children with and at-risk for developmental delays, 17% of children
55 Maryland Family Network (MFN) 2023
56 Maryland Family Network (MFN) 2024
57 Maryland Family Network (MFN) 2024
58 Wright and Cook 2024
59 Weingarten 2023
under five present with some form of a developmental disability, yet only 3% and 4% of infants and toddlers and preschoolers respectively are formally identified for services.60 In short, the declining FCC supply threatens ensuring access to the types of effective early care and education programs that families seek to benefit some of the most vulnerable learners.
Maryland has other provider types, but their capacity is limited. Nursery schools, defined in the Code of Maryland Regulations as a “(a)tax-exempt religious organization which does not have a certificate of approval from the State Board of Education”61 and “an educational program: (a) For children who are 2 years old, 3 years old, 4 years old, or any sequence of these ages; and (b) That, unless approved by the Department before July 1, 2007, to operate for more than 6 hours per day, may not operate in excess of 6 hours per day.”. 62 In 2023 there were 438 of these programs.63
Head Start and Early Head Start are free, federally funded programs serving children who are economically disadvantaged. Head Start serves children between the ages of 3-5 while Early Head Start serves those under three. There were 149 Head Start and 44 Early Head Start programs operating in Maryland in 2023.64
Lastly, Maryland has 687 public Pre-K sites. Per COMAR, Pre-K classes can have a maximum enrollment of 20 children at a ratio of 2 staff:10 children. These are publicly funded and operated programs serving children ages 3 and 4, usually housed within a public elementary school.65 For the 2022-23 school year, they served approximately 30,716 children.66 This represents 20% of the State’s 152,669 population of children aged 3 and 4.67 Maryland does not collect publicly available enrollment data for private child care, but looking at capacity, the number of slots programs are legally allowed to enroll under state licensing regulations, Maryland had an additional available 177,855 slots as of June 2023 that could be for preschool aged children, and also inclusive of younger children.68 That number is calculated from a count of all Maryland licensed capacity slots associated for 8–12-hour licensed Child Care Centers, FCC, Head Start, and Nursery School programs in June 2023.69 There are several critical considerations to this point:
60 U.S. HHS and DOE 2023
61 COMAR 2020
62 COMAR 2020
63 Maryland Family Network (MFN) 2024
64 Maryland Family Network (MFN)2024
65 MSDE DEC 2022
66 Duque et al. 2023
67 U.S. Bureau of the Census, 2022
68 Maryland Family Network (MFN) 2024
69 Maryland Family Network (MFN) 2024
1. For the same comparison time period, Maryland had 205,809 infants and toddlers.
2. Maryland had 981 programs licensed exclusively for infants and toddlers such as Early Head Start, Centers or FCC exclusively serving those ages, for 9,901 slots. This means the bulk of infant care is provided in 4,350 programs in combination with services for older children.
3. Not all programs enroll all ages by choice or by licensed allowance but are still reflected as allowed to expand by licensed program type included in this count.
4. Not all programs enroll to their full capacity, by program or consumer choice.
5. Maryland had 413,845 children under the age of six in 2022. Of those:70
a. 73.7% (305,003) lived in households with all custodial parents working –with this serving as a proxy of need for child care and early education.
b. 6.9% (152,669) were preschool age
c. 20% (30,716) of preschoolers were served in public Pre-K classrooms – leaving a delta of 121,953 preschool aged children to be served by private providers
d. Using the 74% proxy calculation – which is not stating whether that many, more, or fewer children actually utilized, but demonstrating potential need, we’d expect:
i. 152,298 infants and toddlers requiring care
ii. 112,975 preschool aged children requiring programming
Based on these estimates, and compared to available licensed slots, Maryland’s early care and learning supply and demand capacity can be seen comparatively in Figure 2. What this depicts is the clear need for Maryland to rely on its network of community care providers to meet its supply demands, and the reality that infant care, based on licensing requirements and costs, is inherently reliant on mixed-age programming. Even though Maryland exceeds capacity by age slots to serve children aged three and four, a mixed-age delivery model is necessary to ensure a supply of providers to serve infants and toddlers, where there is already a shortage in being able to meet the full population need if demanded.
70 Maryland Family Network (MFN) 2024
Proxy
Infants and Toddlers
Actual Child Population Size
Preschool Age Mixed Age Infant and Toddler Delta
74% Proxy Potential Care Need Population Size Based on Working Custodial Parents
MD Licensed Child Care Capacity
Figure 2. Comparing 2022-2023 Population and Program Data by Potential Need and Maryland Capacity by Early Childhood Age-Group.
In short, while it is not possible to precisely gauge enrollments and vacancies in Maryland’s supply of child care and early education programs based on available data, what is known is having availability of licensed, quality child care and early education programs makes a difference in the lifetime of children – especially those who face specific disadvantages; and it is an economic driver enabling workers to return to the workforce. Maryland is lagging behind other states in this regard, with women particularly impacted. As the early childhood workforce is overwhelmingly female, this creates a perpetuating and downward cycle in capacity to serve the number of children who could be enrolled. Ultimately, all of these issues are intertwined as more women leave the workforce and the cost of child care becomes unaffordable, more families opt to provide self-care or turn to unregulated care options. Demand continues to decline, further exacerbating the pressures driving the closure trend seen in FCC. That in turn adds to less access, especially for the children who need it most, and continues to drive families into unregulated and illegal care options which can have catastrophic consequences for that child. This recent tragedy in Tennessee underscores this pattern: https://www.wsaz.com/2024/02/11/baby-dies-after-beingfound-unresponsive-illegal-day-care/.
Understanding the critical importance the early years play in the futures of children, Maryland passed one of the most significant pieces of educational legislation with a historic focus on early learning with the Blueprint for Maryland’s Future in 2021 (HB-1300).71 The “Blueprint” is well-intentioned in its attempt to ensure the benefits of quality early care and education, recognizing access is contingent upon a mixeddelivery model across public and private programs, but the law as it stands at the time of this report is producing several potential unintended threats to its own aims that are examined in this report. What follows are the broad requirements of the Blueprint, with an emphasis on its implications for early learning, which leads into Maryland’s efforts around Pre-K expansion. When examining Pre-K, it is important to keep in mind the need to rely on a mixed model of private and public child care, the gap in infant coverage and the need for FCC to serve mixed ages to be financially viable. Meaning disruptions to potential enrollments of 3’s and 4’s in private care could ultimately impact the availability of care for infants and toddlers.
The Blueprint is the result of recommendations made by the Commission on Innovation and Excellence in Education, known as the Kirwan Commission for its chair, Dr. Brit Kirwan. The Commission spent three years, 2017-2019, examining data, conducting root-cause analyses, scouring exemplary models, and engaging stakeholders to determine what practices, and funding models, were necessary to prepare Maryland students for the 21st century workforce. The Commission’s report became the basis for the Blueprint for Maryland’s Future, ultimately signed into law in 2021 as HB-1300. The legislation’s focus on five key pillars, 1) Early Childhood Education; 2) High Quality and Diverse Teachers and Leaders; 3) College and Career Readiness; 4) More Resources for All Students to Be Successful; and 5) Governance and Accountability, had general bi-partisan conceptual support, but the legislation was opposed mostly along party lines with then-governor, Larry Hogan (Republican) vetoing the initial passage in 2020 based on the $4 billion cost, only to be overturned in 2021. Still, concerns over costs remain, now inherited by Hogan’s Democratic successor, Governor Wes Moore. Governor Moore’s FY25 State Budget breaks about even, with Blueprint implementation costs rising from $1.4 billion in FY24 to a projected $4.1 billion in FY29.72
Figure 3, as cited in Hacker, Walker, and Jalil (2024), depicts the projected Blueprint annual cost and subsequent annual State budget deficit.73
71 Maryland General Assembly 2021
72 Department of Legislative Services 2024
73 Hacker, Walker and Jalil 2024
The Blueprint for Maryland is estimated to cost millions from the state’s coffers in coming years. At the same time, the Department of Legislative Services anticipates growing deficits in the structural budget.
Numbers represent dollars in millions
3. Relationship between Blueprint annual cost and state budget deficit
The budget’s implications are significant, particularly in the context of early childhood as many aspects of the Blueprint call for both public schools and private child care providers to make investments that could incur long-term cost obligations if state funding mechanisms were to be disrupted.
In wanting to achieve college and career ready graduates from Maryland schools, the Blueprint rightfully embraced a focus on starting early in a child’s life; much more so than many past educational reform efforts. The early childhood priorities defined under Pillar 1 of the Blueprint, by implementation timeline, are shown in Figure 4 from the Accountability and Implementation Board (AIB),74 an entity created through the Blueprint for monitoring and enforcement of the Blueprint’s aims.
74 Accountability and Implementation Board 2022
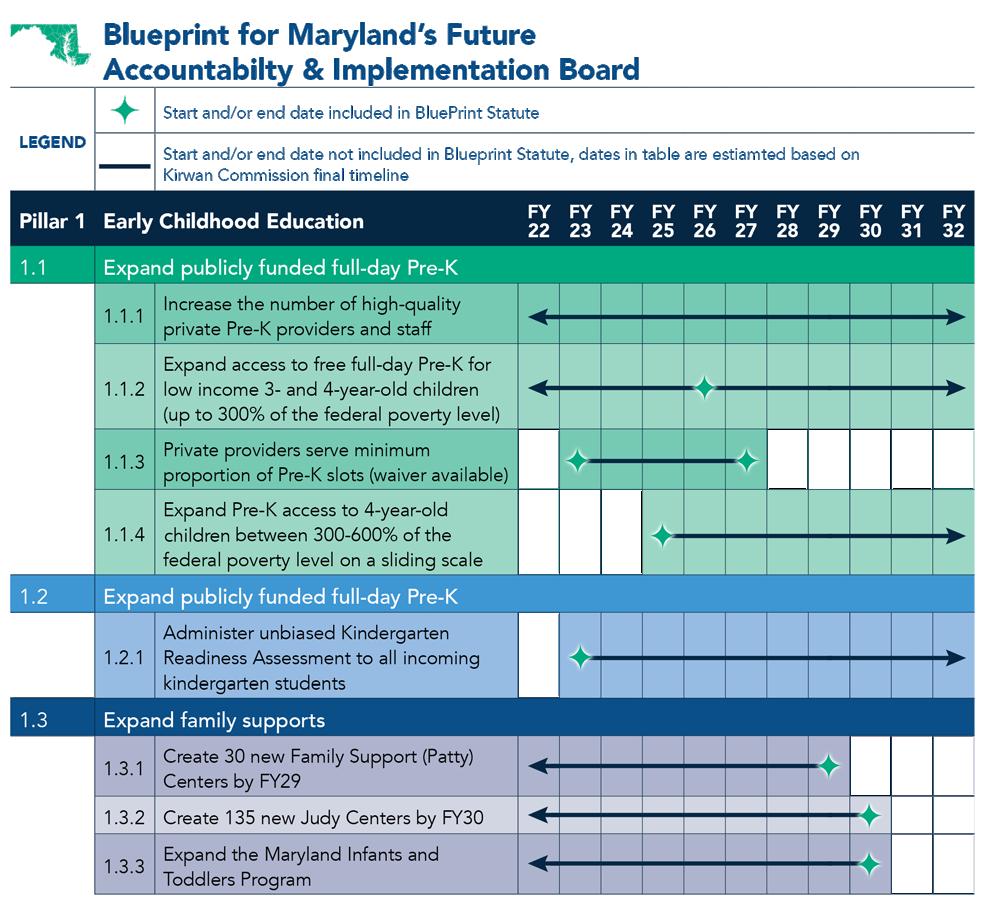
4. AIB Blueprint Pillar 1: Early Childhood Education Implementation Goals and Timeline
Saving the explanation around Pre-K for the next section, the Kindergarten Readiness Assessment (KRA), which has a companion assessment for 3- and 4-yearolds called the Early Learning Assessment (ELA), has served as a de facto guide of Maryland preschool programming since the KRA’s introduction in 2014. Created by the Johns Hopkins Center for Technology in Education and WestEd, the KRA measured five primary domains across 50 items collected through both observation and direct assessment administered in the fall of kindergarten, measuring knowledge, skills, and behaviors expected of students at that point (See: https://marylandpublicschools.org/ about/Pages/DAAIT/Assessment/KRA/index.aspx). As such, the formative assessment ELA measured progress of preschool aged children toward those skills. Critics raised
concerns that the assessments over emphasized constrained skills over unconstrained, was difficult to administer, and took away time from other developmentally appropriate practices for young children. The ELA was mandated for use with the Maryland Infants and Toddlers Program for children who received services through an Extended Individualized Family Services Plan (IFSP) or for children aged 3-4 who qualified for special education services through an Individualized Education Program (IEP). All other use was optional. Likewise, legislation passed that allowed Maryland school systems to administer the KRA to a sample of kindergarteners instead of district wide. That became the predominant model until the passage of Blueprint. With Blueprint and coming out of COVID, the state wanted to have a way to measure growth for all children – including impacts of the expanded preschool efforts – so an amendment to COMAR was passed. COMAR 13A.08.01.02-3,75 “Kindergarten
Readiness Assessment (KRA) procedures,” returned the assessment to a statewide mandated administration for the 2023-24 school-year. A recent report submitted to the AIB by the KRA developers reveals biases in the assessment.76 While the implications for the future of the KRA and the impact on the ELA are unclear, the emphasis for all preschool providers to focus on kindergarten readiness remains.
Maryland’s “Judy” Centers, so named for the Judith P. Hoyer Center Early Learning Hubs, have been a staple of community schooling since 2001.
Maryland’s “Judy” Centers, so named for the Judith P. Hoyer Center Early Learning Hubs, have been a staple of community schooling since 2001. These programs are co-located in Title 1 schools in every Maryland county, and are accessible to all families – whether or not their child attends that school – with families who use private child care often benefiting from their services too. They provide professional development for early educators – FCC, Center-staff, and public teachers, as well as family support and training, with an emphasis on promoting strong family functioning toward helping children thrive. Additionally, twenty-four Patty Centers exist in 14 Maryland counties aimed at providing comprehensive community health services, adult and child service coordination and referrals, comprehensive assessments for both children and families, and targeted supports including training and interventions. Both of these established support programs aim to be expanded through Blueprint, and both have reputable histories of supporting children, families, and professionals across the spectrum of child care program options. Along with these
75 COMAR 2022
76 WestEd & Center for Technology in Education (CTE) 2024
efforts to provide more wrap-around supports and services for children and families, Blueprint also increases funding to support Maryland’s Infants and Toddlers Program, the state’s implementation of the federally required services for children at-risk or identified of having a developmental delay in order to provide early interventions and supports to the child and family. Research shows this is one of the best methods for improving long-term outcomes and reducing the need for more intensive special education later in the child’s educational career.
The remaining priority within Pillar 1 is the expansion of public full-day Pre-K to Maryland children. This is the most significant initiative in terms of cost and scale, as it requires a mixed-delivery approach of public school and private operators to meet the need. The Blueprint calls for expanded Pre-K statewide at no or reduced cost for many families using a three-tiered model based on federal poverty level. Tier I includes all families with household incomes up to 300% of the federal poverty level (FPL). FPL is a changing calculation based on family size, and published annually by the U.S. Department of Health and Human Services (HHS) in the Federal Register in January accounting for calculated household costs and inflation. When it was passed, Tier II of Blueprint was to be a sliding scale method for families with household incomes between 301% and 600% of FPL, to be determined by the MSDE through an evaluation and review process. After conducting a four-option modeling exercise,77 MSDE proposed to the AIB and State Board a sliding scale that caps at the federally recommended 7% top rate for cost of care as a proportion of gross household income. Figure 5 depicts the agency’s recommended scale adoption by the State Board.78 Tier III families above 600% of FPL could pay full tuition when enrolled in private care.
*Annual incomes reported are for a family of four. †Monthly amount based on 10 months
Figure 5. MSDE Proposed Blueprint Pre-K Expansion Tier II Slide Scale Family Cost
Recognizing that Maryland’s public schools did not have the established infrastructure to absorb the current 152,639 preschool aged children at the time of Blueprint’s passing, let alone the 205,809 infants and toddlers on the horizon, with an
77 Duque et al. 2023
78 Cook et al. 2024
estimated increase of 5.5% over the next decade,79 the Blueprint mandated a mixeddelivery approach to Pre-K implementation. Using a phased model that aims for Local Education Agencies (LEAs) to move from 70% of their Pre-K enrollment in public schools to a 50/50 split between public and private programs by the 2026-2027 school year, LEAs are reporting significant challenges in meeting this goal 80
The last publicly released data from MSDE reported nearly 2,000 Maryland teacher vacancies.82
The challenges have been two-fold. Maryland’s overall public education sector has faced intense workforce pressures. While the state is not unique in this challenge, with 86% of U.S. public schools reporting staffing challenges,81 the last publicly released data from MSDE reported nearly 2,000 Maryland teacher vacancies.82 The state employed 27,502 elementary teachers as of October 2022 to serve over 479,762 children from Pre-K to grade 6,83 with some elementary schools going to that grade,84 and had 358 known vacancies starting that school year.85 While current public data on specific vacancy rates is not readily available, MSDE published a report, “Demographics of Maryland Teachers and Students” in December 2021 in which 23 of the 24 LEAs reported having vacancies in the areas of: Early Education, Elementary Education, or Special Education PreK-12.86 This is consistent with current media reporting citing the ongoing staffing challenge.87 The challenge is exasperated by a declining trend in Maryland colleges’ teacher preparation programs by 33%.88 This is significant in the context of the other prong of the challenge – engaging private child care providers to participate in Pre-K expansion – as it creates conditions where public schools are incentivized to compete against that mandate to address their own staffing needs - given that both groups are competing over a tight labor market that now requires the same credentials.
The other area of struggle for Blueprint implementation has been for public schools to engage their community private child care providers, both Center and FCC, in becoming approved Pre-K expansion sites. The Kirwan Commission recognized the practical need for maintaining a robust supply of private child care. As the Maryland
79 Maryland Department of Planning 2020
80 Asbury, Strauss, and Wiggins 2023; Ford 2023; Friedman and Weger 2024
81 NCES 2023
82 Choudhury 2022
83 MSDE 2022
84 Maryland Family Network (MFN) 2024
85 Choudbury 2022
86 MSDE 2021
87 Hughes 2024
88 Choudbury 2022
Association of Counties (MACo) noted in their 2023 summer conference session, “Embracing without spacing: Pre-K expansion and early childhood education,” public schools lack the infrastructure to readily absorb the increased enrollment demand for full-day Pre-K.89 From staffing to physical space to transportation, the public school system is not readily capable of fulfilling that need.90 All 24 LEAs have to submit Blueprint implementation plans to the AIB for approval. Looking at the six counties that comprise the Baltimore-metro area (Baltimore city and county; Anne Arundel, Carroll, Harford, and Howard), all but Carroll cited meeting Pillar 1 Pre-K expansion as one of their top three Blueprint implementation challenges, with Harford explicitly noting lack of available physical space to establish more classrooms.91 At the same time, the current budget crisis makes resources scarce to invest in these needs even if LEAs wanted to. As Blueprint implementation is a required shared cost between counties and the state, the budget challenges of both with the expanding costs of Blueprint are proving a fiscal balancing act to navigate.92 Prince George’s County chief administrative officer, Tara Jackson, voiced the concern shared by many counties where their required Blueprint cost-share is excessively exceeding their standard operating budgets, causing tough decisions around service reductions or
89 MACo 2023
90 Friedman and Weger 2024
91 Price 2024
92 Asbury, Strauss, and Wiggins 2023; Hacker, Walker and Jalil 2024

increased taxes,93 noting that her county and Baltimore City, two of Maryland’s lowest wealth counties, disproportionately pay Blueprint funding increases based on the current county contribution formula.
All of this reinforces what Kirwan anticipated by advocating a mixed-delivery system. Additionally, the Commission understood the intrinsic relationship between ensuring a supply of infant and toddler care through the private marketplace, and the child care industry’s need to have a supply of enrolled preschool aged children to remain financially viable. Likewise, they examined the data around utilization, including how private care, FCC in particular, is used by many historically marginalized families. What Kirwan could not anticipate but became illustrated for the world was the critical role the private child care sector played during a nationwide quarantine. In Maryland, when all public schools were ordered closed effective March 16, 2020, with continuations extending to an eventual announcement for closure through the rest of the 2019-2020 school year, it was the 3,778 private child care providers operating under the Essential Personnel Child Care (EPCC) and Essential Personnel School Age (EPSA) who ultimately enabled the state’s recovery via allowing essential personnel to remain at work while their children were safely in programs. As the 2020-2021 school year resumed with mostly virtual instruction or hybrid models for at least the first half, it was the expanding resumption of provision of private child care that enabled more work-from-home parents desperately trying to juggle home-schooling and career while maintaining some sense of developmental and educational benefits for their children. While most reputable experts would not dispute quarantining and social distancing mitigation efforts were the best strategy at the time given known information, lack of immunities, contagion, virulence, and mortality, there’s no denying COVID had a lasting and deleterious effect on a generation of children. It showcased the fragility of our nationwide early education and K-12 systems, but it also demonstrated the vital role a mixed-delivery model plays in ensuring continuity of services through a network of smaller site-based providers that can be more insularly contained in the event of an outbreak without disrupting the entire system.
Unfortunately, despite these benefits, and the focus and incentives afforded through the Blueprint, enticing the private child care sector to participate in Pre-K expansion has proven difficult. MSDE launched the Prekindergarten Expansion Grant program to provide support to the private child care sector in meeting Blueprint requirements to be an approved public Pre-K expansion site operated by a private care provider. In school year 2022-2023, MSDE received only 90 applications from the 6,455 programs that could have been eligible to apply. Of those, 30 programs were selected.94 This report clarifies the barriers for FCC participation, and as there is an
Workforce Program
Ensuring Services for Children with Diverse and Specialized Needs
expansion
Curriculum and Instructional Practices
economic reality for FCC providers to participate, the associated operational costs they will incur.
As the contextual factors of policy, efficacious practices, consumer demand, workforce supply, and the realities of historical and current pressures on both public education and the private early care and education space demonstrate, root causes of barriers to participation are deep and multi-faceted. Next, we will describe the specific requirements providers must meet in order to participate in the Pre-K expansion program in order to understand the subsequent analyses.
The Blueprint defines specific expectations for Pre-K expansion, with phased implementation requirements. The MSDE grant program aims to support child care providers in meeting these expectations, and is structured around attempting to coordinate a variety of established initiatives into a cohesive model. At the time of this report, several of these requirements are under consideration for revision based on advocacy from numerous constituency groups (see MD HB 1441, HB 1261; HB 1385 as examples).
The Blueprint has four core focus areas with regard to Pre-K expansion:
• Workforce
• Program
• Curriculum and Instructional Practices
• Ensuring Services for Children with Diverse and Specialized Needs
By focus area, the following requirements are:95
1) By 2025-26 School Year: High staff qualifications, including –
a. Teachers who, at a minimum, hold:
i. A state certification for teaching in early childhood education; or
ii. A bachelor’s degree in any field and are pursuing residency through the Maryland Approved Alternative Preparation Program, which includes early childhood coursework, clinical practice, and evidence of pedagogical content knowledge
iii. Teaching assistants who have at least:
iv. A Child Development Associate (CDA) certificate; or
v. An associate’s degree
2) Professional development for all staff.
3) A student–to–classroom personnel ratio of no more than 10:1, with a maximum class size of 20:1 in accordance with Maryland licensing, but still adhering to the 8 to 1 ratio for FCC, assuming no children under age 2 are enrolled, or 1:12 for Large Home FCC.
4) Instructional staff salaries and benefits that are comparable to the salaries and benefits of instructional staff employed by the county board of the county in which the early learning program is located.
1) Provide a full–day prekindergarten program.
2) Be at least a Maryland EXCELS Level 3+ now, with a goal to increase to Level 5 by 2028.
a. This requires participation in and eventual achievement of a recognized Maryland or national accreditation as well. FCC only has the option of accreditation from the National Association for Family Child Care (NAFCC).
3) Implement program evaluation to ensure continuous program improvement.
Curriculum and Instructional Practices
1) Classroom instruction:
a. Are aligned with State Early Learning and Development Standards; b. Use evidence–based curricula; and
c. Use instruction methods that are:
i. Developmentally appropriate;
ii. Culturally and linguistically responsive; and
iii. Individualized with accommodations and supports for all students;
2) Following evidence–based health and safety standards
Ensuring Services for Children with Diverse and Specialized Needs
1) Demonstrated inclusion of students with disabilities to ensure access to and full participation in all program opportunities
2) On–site or accessible comprehensive services for students
3) Establish community partnerships that promote access to comprehensive services for families of students
Maryland has a multitude of established initiatives in place to assist providers with these requirements, but many of these elements have been historically challenging for not only Maryland child care providers, but public schools, and the entire national early childhood field. Maryland EXCELS is the state’s quality rating and improvement system (QRIS). Launched statewide in 2013, Maryland EXCELS measures the quality of child care and early learning programs across five defined standard areas (See www.marylandexcels.org for a full review):
• Licensing and Compliance – ensuring programs are adhering to Maryland licensing requirements.
• Staff Qualifications and Professional Development – promoting ongoing professional growth of the workforce, including alignment and advancement within Maryland’s career growth system, The Maryland Child Care Credential Program, that financially incentivizes individual child care providers who go beyond the requirements of state licensing and registration regulations by obtaining additional training, education, and experience.
• Accreditation and Rating Scales – accreditation and rating ensures a process of having points of onsite validation and verification of implemented practices against established standards and measurement scales such as the CLASS assessment of adult and child interactions. These external tools serve as an additional reference point of measured quality in complement to the rest of the Maryland EXCELS standards.
• Developmentally Appropriate Learning and Practice – ensuring best practices in cultivating child development and learning are implemented; wherein programs are inclusive, responsive to the individualized needs of their learners; and programming optimizes the best outcomes for all enrolled.
• Administrative Policies and Practices – addressing the operational management of programs, including aspects of compensation, family engagement, and community partnerships.
Using a rubric block system wherein providers submit evidence of fulfillment of measured standards that is then reviewed through a two-tiered rater process, with guided feedback and technical assistance for improvement provided, Maryland quickly became one of the leading states in the country with regard to voluntary participation in this initiative by its provider community.96 Part of the influx of participants was driven by incentives such as cash bonuses and public advertising to family consumers, and also driven by requirements to participate for any provider who accepted the Child Care Scholarship subsidy reimbursements. Even still, while Maryland had participation rates as high as 80% pre-pandemic, the concentration of providers has always remained toward the bottom of the five-level scale.
Per the MSDE’s March 2024 Maryland EXCELS Monthly Data Report published on its website, 68% of all licensed Maryland programs and public preschools are participating in Maryland EXCELS. This represents 82% of Centers, 60% of FCC, and 60% of public preschool. A program is considered “participating” if they are within their allotted timeframe to obtain a publicly published rating. When looking at the programs that have obtained that, the numbers adjust to 78% of Centers and 54% of FCC. Data was not indicated for public Pre-K. Nor was data presented to show a disaggregated view of percentage of programs at each quality level by program type, but Table 2 depicts the overall distribution of program counts by quality rating and county.97 Examining the totals, 59% are Quality Rating 1; 8.4% are Quality Rating 2; 18.9% are Quality Rating 3; 3.7% are Quality Rating 4; 9.6% are Quality Rating 5. Meaning only 32.2% are within the Level 3+ eligibility for Pre-K expansion. That represents 1,449 programs.
In disclosure, one of this study’s authors formerly worked closely with Maryland EXCELS and recognized these data distributions as historically consistent, but MSDE also published Maryland EXCELS Quality Ratings by County, with September 2022 being the most recent available (MSDE: https://earlychildhood.marylandpublicschools. org/data).98 These data did disaggregate by Center, FCC, and Public Pre-K. The total program count was 4,155, within the margin of comparison to the March 2024 count of 4,483.
Table 3 depicts the state sums by program type and quality rating. Percentage of each type’s distribution by rating is noted parenthetically, with the total percentages reflecting those sums as proportion of the 4,155 programs. Two notes, by policy, public Pre-Ks do not have standard criteria below Quality Rating 4, and the total percentage does not equal 100% because a fourth category of programs, school-age providers of before/after school-care, are not reflected here.
As Table 3 shows, the bulk of programs’ quality ratings were below Level 3 with FCC at 72.5% and Centers 51.6% Quality Rated 1 respectively. Previous research has shown major barriers for programs of all types to move beyond Quality Rating 2 include more stringent criteria for meeting the needs of children with developmental delays and special education services; moving into active pursuit of accreditation, especially for FCC providers when they only have one national option that is often backlogged; and meeting staffing qualifications requirements.99 While public Pre-K had the highest concentration of Quality Rating 5 in 2022, it is important to remember several factors. The public Pre-K Maryland EXCELS standards are fundamentally different than those that apply to Centers and FCC, including the fact that they only begin at Level 4. Overall, 136 public Pre-K are a fraction of the Maryland EXCELS programs at 3.2% in this dataset, though unlike private child care centers, families can enroll in their neighborhood public Pre-K at no cost regardless of Maryland EXCELS level. Finally, achieving the highest EXCELS levels is particularly challenging for FCC providers who are most frequently a singular person serving as owner, operator care provider/teacher, nurse, janitor, etc. Without the support that larger organizations have, meeting the requirements for higher levels requires a disproportionate individual effort to achieve.
That said, public Pre-K is not immune to many of the challenges felt by their private sector colleagues in terms of meeting the needs of children. The U.S. Departments of Education and Health and Human Services just issued a joint policy
99 Darling et al. 2023; Swanson et al. 2014
statement reiterating the need for inclusion of children with disabilities in early childhood programs (2023).100 The research on the benefits of such for both children with and without developmental differences is established, yet the agencies cite several Letters of Finding and Case Law where these benefits have not been realized based on exclusionary practices within public schools. The federal Administration for Children and Families issued their Policy Statement on Expulsion and Suspension Policies in Early Childhood Settings in response to a finding of 10% of preschoolers in public settings were suspended or expelled in a given year;101 that’s a rate three times higher than K-12 students, yet research shows just one suspension of expulsion can have a lifetime of negative effects for this age group, and these consequences are more often applied to children of color, those living in poverty, and coming from non-English speaking homes, reinforcing biases and perpetuating systems of inequity. MSDE followed suit, implementing its own policy guidance and legislation in 2017.102
Additionally, as noted earlier, unconstrained skill development, cultivated through play-based, experiential, exploratory, and strong child-engagement and interactions, characterize developmentally appropriate practices (DAP) in ECEC, yet too often these methods are sacrificed for traditional instruction believed to prepare students for success on academic tests.103
High-stakes academic measures have been the norm since No Child Left Behind, creating downward pressure on ECEC to focus on academic skills. While cognitive development has always been a hallmark of high-quality ECEC, it is the method of instruction and curricular expectation that determines appropriateness. Researchers have found a greater incidence of “push-down academics’’ in public preschools, a model that has been adopted to emphasize what have been historically elementary grade skills and curriculum in preschool at the expense of focusing on foundations to learning like social-emotional and executive functioning skills.104 Ironically, those cognitive abilities have long been associated with life-long academic success,105 with children in poverty and facing other disadvantages exhibiting larger gaps in these areas in the absence of targeted interventions most often associated with high-quality ECEC and shown to directly intervene for those children who have experienced Adverse Childhood Experiences (ACEs). Gordon and colleagues’ meta-analysis of child outcomes by early childhood setting type found the research supported overall academic gains for those children who attended centers and public
100 USDHHS and USDE 2023
101 USDHHS and USDE 2016
102 COMAR 2018
103 Harvey & Ohle 2018; Schachter, Strang & Piasta 2017
104 Keshkin 2018; Wasmuth & Nitecki 2017
105 Domitrovich et al. 2017
Pre-K,106 while numerous studies demonstrated improved behavioral, social-emotional, and foundational skills for those who attended FCC. Ultimately, the authors concluded we needed to think differently about how we structure our early learning experiences; be it hybrid approaches or trying to emulate the best of each more broadly, or better matching specific children by need to program type.
MSDE has implemented the Prekindergarten Expansion Grant program to try and support providers in addressing these areas of needed growth. At present, the requirements as published in the MSDE FY25 Prekindergarten Expansion Grant Information Guide are:
This funding opportunity is designed for those who deliver prekindergarten services and are accredited and participate in the Maryland EXCELS program, including:
Local Education Agencies (LEAs) or qualified vendors (as defined in COMAR 13a.06.02) and private providers (including, Head Start, Center Based, and Family Child Care programs) who:
• hold a valid license;
• have not incurred any serious health or safety violations;
• are Head Start programs.
Priority will be given to programs with the following Maryland EXCELS ratings (in order of priority):
• published at Level 5 with a plan to maintain this level;
• publish at level 4 with a plan to achieve Level 5 within 5 years (if you fall into this criterion, you must include a plan to reach level 5 as part of your application); or
• published at Level 3 with a plan to achieve Level 5 within five years (if you fall into this criterion, you must include a plan to reach level 5 as part of your application).
Priority will be given to high-quality programs that:
• are seeking renewal or expansion of existing programs with a demonstrable track record of success;
• are in areas of the state that have an unmet need for prekindergarten services; or
• include parental/guardian engagement and educational activities beyond the classroom.
106 Gordon et al. 2013
Additionally, proposals must contain the following to be considered for funding:
• Clear goals and outcomes that demonstrate how the program will provide an educational program and meet the requirements of the grant;
• A description of how the income verification forms and family-provided documents will be collected and maintained on-site. The income eligibility criteria are based on the Federal Poverty Levels (FPL);
• A plan for how the needs of students with disabilities, students experiencing homelessness, and students who speak a home language other than English will be met;
• A description of the program’s family engagement strategies in accordance with the Maryland Early Childhood Family Engagement Framework;
• Verification of published Maryland EXCELS level with a plan in place to maintain or achieve Level 5 by the identified deadline;

• A description of the professional learning activities for instructional staff (teacher and assistant) that consist of 15 total of hours and support school readiness, including alignment with the Maryland Early Learning Standards in early language and literacy, the science of reading, early mathematics and social foundations;
• Identified community partners and specific roles as they relate to the program;
• A qualified individual in key personnel listed as responsible for instructional oversight, and whose resume demonstrates their qualification to do so;
• All lead teachers in prekindergarten classrooms must hold a bachelor’s degree. If a teacher has not been identified by the date of the proposal submission, a job announcement must be included that demonstrates education requirement and salary;
• A director cannot be regarded as the teacher unless he or she is working in the classroom full-time for the 6.5-hour instructional day;
• Lead teachers who have their teaching certificate must be paid a salary commensurate with the LEA in the respective county;
• For classrooms with more than 10 students, there must be an Assistant Teacher who holds a minimum of a high school diploma;
• At least one meal per day must be provided. It’s recommended that meals served meet the Child and Adult Care Food Program (CACFP) requirements, but not required;
• All grant requirements must be met prior to the start of the grant year.
• Lead teachers must be hired by July 1, 2024, in order to avoid a disruption in grant funds;
• Invoices will not be paid unless all grant requirements have been met.
Note: Final awarding of the grant will be contingent on the applicant meeting all grant requirements.
The FY25 application period closes at the end of April, so it is not known how many awards will actually be made, though the solicitation notes an expected 60 awards. The expected average award amount is $400,000 with a defined $13,000 per slot funded. Table 4, published by MSDE from the Blueprint,107 shows the expected rate of funded slot for each child in Tier I of Pre-K Expansion. So given this model, in FY25, for example, a FCC provider that enrolls all 8 of their slots as preschool children in Tier I would receive $104,000 from the state.
Table 4. Blueprint Pre-K Expansion Slot Funding Rates by Fiscal Year (MSDE April 2022).
FY2023
FY2024
FY2025
FY2026
FY2027
FY2028
FY2029
FY2030
Subsequent Years
$10,094
$11,594
$13,003
$14,473
$15,598
$16,811
$18,118
$19,526
The prior fiscal year increased by the inflation adjustment
Maryland has multiple established support models for providers. Maryland Family Network, a nonprofit advocacy, research, and training organization, operates the state’s Child Care Resource and Referral Network (CCRR). CCRRs are federally mandated technical assistance and family support hubs. In Maryland, federal and state funds support CCRRs to assist child care providers in opening, operating, improving their quality, and obtaining training in numerous targeted topics. Maryland Family Network also operates LOCATE, a referral and search system that helps families find child care that meets their needs.
FCC and Centers each have respective professional organizations. The Maryland State Family Child Care Association (MFCCA) and the Maryland State Child Care Association (MSCCA) both engage in advocacy, training, policy development, and research for their respective constituent groups. The Family Child Care Alliance of Maryland, described earlier, also serves as an advocacy, training, and technical assistance group for FCC, in addition to its work as a resource and service hub. In this capacity, it developed the ASPIRE model specifically designed to prepare and support FCC providers in meeting Pre-K expansion requirements.
The state also enjoys a rich network of two- and four-year public and private colleges and universities with research, technical assistance, personnel preparation, and policy expertise and focus in the early childhood arena. This is augmented by a number of independent and national experts, trainers, and organizations who routinely work within the state.
The MSDE, through its Division of Early Childhood, convenes a statewide Early Childhood Advisory Council, which is composed of both regulatory and governor
appointments; and each of Maryland’s 24 jurisdictions have a local advisory council, though some are more active than others based on funding availability. Under the MSDE Division of Special Education and Early Intervention Services, the Maryland Infants and Toddlers Program is operated, also with a statewide advisory council and local representative model. The governor maintains the Children’s Cabinet, consisting of the secretaries from the Departments of Budget and Management; Disabilities; Health; Human Services; and Juvenile Services; as well as the MSDE State Superintendent of Schools; along with other appointments and invited experts. The specific focus of the cabinet varies by administration, but addressing child poverty and inequity, and implementing the Blueprint have been publicly stated goals of both the Moore administration and the current state legislature. MSDE provides several funding streams to support providers that are leveraged within the Pre-K Expansion grant.
• The Child Care Accreditation Support Program assists licensed programs with application fees associated with obtaining or renewing accreditation.
• The Child Care Quality Incentive Grant (CCQIG) supports projects that improve the professionalism and quality of child care programs. The program also supports initiatives that improve children’s school readiness.
• The Maryland Child Care Credential Program recognizes individual child care providers who increase their qualifications beyond the requirements of state licensing and registration regulations. There are six staff credential levels and four administrator levels offering various recognition of achievement based on a child care provider’s professional development/education, years of experience, and professional activities. Providers can receive a mix of one-time and recurring annual payments based on their level. Bonus payments associated with this program are ending effective June 30, 2024 barring legislative action.
• The Child Care Career and Professional Development Fund (CCCPDF) is a tuition assistance program for child care providers to obtain a college education at participating colleges/universities in Maryland. Funding is available for child care providers to earn a college degree in the following areas:
Child Development
Elementary Education
Special Education
The fund does not reimburse participants as the payments are made directly to the college or university.
• The Maryland EXCELS Bonus is for eligible programs to receive bonuses ranging from $1,000 to $13,500 based on the type of program, quality rating, and capacity. Currently, between July 1, 2023 and June 30, 2024, programs will receive bonuses for each time they accomplish the following:
Publish any quality rating for the first time
Re-publish a quality rating 4 or 5
Bonuses are subject to funding availability
In summary, understanding both the national trends and Maryland’s individual landscape for early childhood helps to contextualize this study. Recognizing the need of a mixed private / public solution to address the capacity gap in child care, the critical role that FCC can provide in filling that gap, and the historically very low application rate to participate in Pre-K expansion (1.4%), a study was conducted to better understand how to encourage FCC participation. Specifically, we sought to understand the barriers and potential supports to achieve this. As this background examination shows, Maryland’s network of private community care providers at large are an essential and critical part of not only the State’s ability to meet the Pre-K expansion requirements in terms of volume, but also in ensuring a continued supply of infant and toddler care, and ultimately this extends into an economic viability benefit. Maryland’s workforce recovery, and subsequent economic outlook, is intrinsically connected to its ability to provide safe and impactful, accessible and affordable, effective and beneficial care and early education to all children across the state. Private providers are an integral part of meeting this aim, both in affording flexibility to meet shifting population trends and consumer needs in ways that are harder for public schools to adapt to. Ultimately, as Gordon et al. found,108 a vibrant early childhood system needs robust options that meet the continuum of needs of children and families.
FCC face especially unique challenges given their structure, historical purpose and workforce composition, and the gap between operating budget and needed investment, yet programs like ASPIRE have already demonstrated the potential for FCC contributions, and the broader body of research suggests the value of mixedservice delivery models for developmental, operational, and systemic reasons. Taking both the requirements and goals of Pre-K expansion, the baseline context surrounding Maryland FCC, and targeted areas of known “pain points,” this report examines several areas of consideration for policy makers in terms of addressing FCC needs while preserving the benefits of their participation within an expanded Pre-K delivery model. These will be unpacked in the following sections.
To identify key barriers, supports, and associated costs, a mixed methods design featuring qualitative interviews and a representative quantitative sampling of FCC providers was conducted. The following research questions were investigated:
1) What are the top barriers cited by FCC providers to participation in Pre-K expansion?
2) What are the top potential supports cited by FCC providers to increase participation in Pre-K expansion?
3) What are the potential revenue-expense models associated with FCC providers participation in Pre-K expansion?
Research Question 3 was ultimately modified based on the initial focus group and pilot testing to more broadly attempt to define the operational revenue-expense model for FCC providers generally and by age-group. Limitations to this query will be presented in the next chapter.
An expert advisory group (n= 8) was established featuring representatives from across Maryland’s Early Childhood Education and Care (ECEC) stakeholders. This included:
• Leaders of professional associations representing Centers and FCC
• Leaders of the Child Care Resource and Referral (CCRR) network
• Leaders of community advocacy, training, and support organizations; including ECEC philanthropic funders
• FCC providers, including providers specifically representing Maryland’s Latino FCC community
Representatives of local Institutes of Higher Education were invited but declined, though several members of the advisory group also have affiliations as instructors or appointments with area colleges and universities.
Invitations were also issued to representatives from MSDE but they were unable to serve at the time based on policies of the then Superintendent of Schools.
In the fall and winter of 2022, prior to the start of this study, members of the study team in their capacity serving with the ASPIRE program, had ongoing community forums with FCC participants in that initiative (n= 46), as well as feedback data from those providers who were not participating as to reasons they were not interested in becoming a Pre-K expansion provider. The team brought this information
to an initial ideation session in January 2023 featuring members of the advisory group, additional FCC stakeholders, FCCA leadership, and MSDE representatives. An openended brainstorming session was held by Dr. Sondeania Johnson around perceived barriers and potential supports for FCC providers’ participation in Pre-K expansion. The study team was formally convened in March 2023 comprised of FCCA members Dr. Johnson, and her colleagues Desiree Taylor and Tiffani Martin, both ASPIRE coaches supporting FCC providers’ progression in that program, along with Dr. Johnson, in their normal capacity with FCCA. The team was joined by Dr. Chris Swanson and Jon Farley, both previously with the Johns Hopkins School of Education, where Swanson was faculty and executive director of the IDEALS Institute and Farley was chief operating officer, and now both are co-founders of the nonprofit C-IMPACT.
The study was conducted in four phases:
• Instrument Design
• Survey Pilot and Focus Groups
• Survey Data Collection and Interviews
• Analysis and Reporting
Figure 6 shows the study timeline by phase.
Instrument Design
Survey Pilot and Focus Groups
Survey Data Collection and Interviews
Analysis and Reporting
*Previously collected data informed instrument design
Per Section 45 of the Code of Federal Regulations (CFR), part 46: “Basic HHS Policy for Protection of Human Research Subjects” (45 CFR part 46, subparts B, C, and D),109 the 2018 Amendment for IRB Exempt Research specifies (nonrelevant parts omitted): “§46.104 Exempt research. (a) Unless otherwise required by law or by department or agency heads, research activities in which the only involvement of
human subjects will be in one or more of the categories in paragraph (d) of this section are exempt from the requirements of this policy, except that such activities must comply with the requirements of this section and as specified in each category. (d) Except as described in paragraph (a) of this section, the following categories of human subjects research are exempt from this policy:
(2) Research that only includes interactions involving educational tests (cognitive, diagnostic, aptitude, achievement), survey procedures, interview procedures, or observation of public behavior (including visual or auditory recording) if at least one of the following criteria is met:
(i) The information obtained is recorded by the investigator in such a manner that the identity of the human subjects cannot readily be ascertained, directly or through identifiers linked to the subjects.
(ii) Any disclosure of the human subjects’ responses outside the research would not reasonably place the subjects at risk of criminal or civil liability or be damaging to the subjects’ financial standing, employability, educational advancement, or reputation.”
Based on this, it was determined the study met IRB exemption requirements. All participant phases included informed consent, with focus group participants providing signed consent, and survey respondents prompted to indicate consent before continuing with the survey. While overall participation in any phase posed minimal risk, some participants expressed fear of retribution by governing organizations for making public criticisms. All participants were guaranteed deidentification of collected data as responses or comments to a given individual or organization, but not complete anonymity as focus group respondents were offered 2 MSDE Professional Activity Units (PAUs), units of professional recognition within the Child Care Credential program, and a $40 gift card. Survey respondents were offered 1 PAU and the chance to be entered into a random drawing for 30, $20 gift cards, if they provided their contact information at the end of the survey. Focus group participants voluntarily applied for participation. Participants were provided with direct contact information for MSDE as the funder if they had any concerns about the study, and all had the option to end participation at any point without consequence.
Using the previously collected data from ASPIRE’s ongoing forums and the January stakeholders’ session, the study team aligned the identified areas of barriers, supports, and defining costs by categorical topics aligned to Blueprint requirements for Pre-K expansion. A survey was constructed featuring 27 questions. The Barriers and Supports sections were rank ordered via Likert design constructed using the
online data collection system Qualtrics, with both a web and mobile collection display. These featured 14 stem questions with 130 specific response choices formed from the previous input forums. Each question also allowed an Other open response entry. The cost section was 16 mostly short answer questions with some multiple-choice categories around demographics. Table 5 details the distribution of response choice associations by stem question and topic, categorized by Barrier or Support.
Table 5. Delphi Survey Version Categories of Topics and Response Option Counts by Barrier or Support Category.
8 * these categories were merged into broader operational and implementation support recommendations identified consistently through the input sessions
A Delphi process was used to establish agreement amongst the advisory group around the specific questions, response options, sequence, and wording to include in a pilot construction. A Delphi process is a technique originally promoted by Dalkey and Helmer used to define consensus opinions across a panel of independent experts.110 In a Delphi review, experts independently review material to determine their recommendations, providing their comments and feedback, which is then presented anonymously to the whole group for review in successive rounds. The implication is to encourage independent application of expertise and perspective, while giving an opportunity for individual reflection in the absence of potential threats of group-think public pressure. Consensus is determined in the context of each application.111
A three-round Delphi process was planned with the survey distributed electronically to each individual member of the advisory group. Members were given upfront draft collateral that would be the directions intended for the survey’s census distribution to the field. They were also given specific direction respective to the Delphi process. Each reviewer was asked to complete their review within 72 hours via the online Qualtrics link.
110 Dalkey and Helmer 1963 111 Barrett and Heale 2020
The reviewers’ surveys enabled open text commentary about the draft directions intended to accompany the census survey. Specifically, reviewers were prompted to consider factors such as readability, clarity, and length. Note, the Delphi survey was in English, with three reviewers being bilingual in English and Spanish. A Spanish language version of the survey was made based on the final instrument design, but the bilingual reviewers were asked to specifically consider implications of the instrument that would be lost in translation. For the specific questions, each reviewer was asked to do the following:
1. Rank the question overall in terms of importance by barrier, support, cost.
2. Score the question on a scale of 1-5, 1 being not useful to 5 being highly useful, in terms of determining actionable information to address in terms of removing barriers, implementing supports, or identifying costs.
3. Rank the presented response options in order of perceived importance by the expert.
4. Score each presented response option on the same 1-5 as the overall question stems.
5. For any score below 3, provide a rationale for why the question/response is not useful, provide a rationale for the score and any suggested edits to make the question/response more useful.
6. An open text response was included per question to allow feedback on overall wording, recommended additional response options or other suggested modifications.
Round 1 was completed by six of the eight experts within the 72-hour timeframe. Within each 72-hour period, the study team complied the feedback into a singular new version reflecting anonymous comments for the successive round. It was planned that if there was 100% consensus in a given round, that change would be made, but without 100% participation no actual edits were made between review rounds.
The seventh reviewer missing from Round 1 completed a review of their initially received version in the interim between the end of Round 1 and start of Round 2 review. The Round 2 version was distributed with the same directions as before, and another 72-hour review period began including anonymized feedback and ranking scores of items reflective of Reviewers 1-6.
Between Rounds 1 and 2, there was consensus across all respondents on the questions ordering of importance by category and utility scores; with two cost questions universally scored as not useful.
At the Response Option level, seven responses across four questions scored outside the standard deviation of the mean and were flagged for specific attention
during Round 2. Three responses across two questions scored at a consensus of “1” – not useful and were globally ranked as the least important. These were also flagged for recommended removal or revision
Additional qualitative feedback was received around readability. A FleschKinkaid readability analysis was used both through Microsoft Word during the drafting process and within the Qualtrics software. In both instances, the Version 1 survey came to a fifth grade expected reading level. Phillips, Crowell, Whitebook, and Bellm found highly variable English literacy proficiency rates across child care providers, though there is no quantitative metric this study’s authors were aware of specific to Maryland’s ECEC workforce.112 Still, efforts were made to address concerns around general readability, and specific terminology. On that regard, the upfront collateral quoted the Blueprint requirements for Pre-K expansion, and there was near consensus feedback that many of the specific initiatives and terms would be unknown to the FCC community at-large, and especially those who are non-native English speakers. Lastly, the reviewers commented that the technical design of the survey, which allowed a drag and drop for the rank order, with the associated Likert scale by item, was difficult to navigate. Several reviewers cited past experience suggesting technology challenges for FCC providers, so a broad recommendation was to use a different functional input to enable rank order and scale scoring.
Round 2 was completed by 7 of the 8 members of the advisory council within the timeframe. Scores remained stable with no additional changes between Round 1 and 2 identified. The missing reviewer from the previous rounds provided feedback in the third round, but for the remaining reviewers, a third round Delphi was replaced with an interview session to further gather qualitative feedback around survey construction. Specifically, alternative wording was explored, with a decision made to test understanding of terminology and statewide initiatives like the Child Care Development Fund or the differences between licensing, accreditation, and Maryland EXCELS, during the pilot focus groups. Additionally, the decision was made to omit three of the seven flagged response options, collapse two into existing options, and condense the remaining two into a rewritten new option. It was agreed to omit the three lowest rated options that had consensus determination of unimportance. Questions were raised about the likelihood of FCC providers ability to answer the cost questions. It was decided to explore this further during the pilot phase.
At the time of sampling, April, 2023, using the publicly available website Check Child Care MD hosted by MSDE, there were 4,382 licensed family child care (FCC) including large-family homes.
112 Phillips et al. 2003
Using a 95% confidence level and 5% margin of error, the target sample was 354 respondents. Table 6 shows the distribution of FCC/Large FCC by count and by county, per Check Child Care MD. The sample column indicates our target recruitment to ensure representation statewide, stratified across urban, suburban, and rural regions, and reflective of FCC and Large operators. In the sampling procedure, counties that had fewer than five of a given type of operator, which only applied to Large FCC, were omitted, to preserve anonymity.
1. Minimum sample count. 2. General sample of 40 programs.
3. Large Family homes – selected from cells populations with >5 to protect anonymity.
Using the target census sampling, a 10% pilot sample was targeted. A proportionally weighted distribution recruitment was constructed targeting 10 urban, 20 suburban, 5 rural with at least 1 large FCC represented. Pilot participants would be asked to join a 2-hour synchronous virtual focus group where the survey protocol would be presented on screen, by question and response options, and a scripted protocol was used to solicit feedback from the participants around the following:
1) Understanding of the question and each response choice for clarity, meaning and familiarity from the participants’ direct perspective
2) Understanding of the question and each response choice for clarity, meaning and familiarity from the participants’ consideration of other FCC providers’ perspectives that they know
3) Invitation for participants to raise additional items at the question/response/ overall topical level for considered inclusion.
4) Invitation for participants to provide any additional feedback or comments.
A recruitment flyer explaining the study, with a QR code for more information presented online, including the study consent, in both English and Spanish, was distributed through multiple channels to reach FCC providers, including:
• Direct emails to FCC listservs by FCCA, MFN, MSFCA, and MSDE
• Sharing through social-media with tags to known FCC groups and prominent influencers
• Posting in established MSDE communications like Tuesday Tidbits, their weekly online newsletter
An electronic registration link was provided with the online consent form for interested study participants. Participants were asked to provide:
• Contact info
• Location: county, address, zip code
• License number
• How many children enrolled
• How many of those are preschool aged
• How many preschool aged funded slots currently participating in Pre-K expansion
Then participants were given 10 date and time options, with two Saturday, three evenings, and the rest weekdays at either 10 am or 1 pm, to indicate availability in order of preference. Group sizes would be capped at 7 participants. 113 respondents replied to the study solicitation. 98 met the minimum qualification of being a FCC
provider, of which they were sorted by county and flagged as Large FCC (n= 6). The 98 programs were then deidentified except for assigned participant code, county, and zip code, with the Large FCC’s participant code predicated by a L. Using the U.S. Department of Agriculture’s 2010 Rural-Urban Commuting Area (RUCA) codes dataset, the most currently available from the Economic Research Service, each program was assigned an urban, suburban, or rural designation based on zip code match. Suburban designation was determined using the RUCA data and following the suburban calculation publicized by Igielnik, Grieco, and Castillo,113 wherein zip codes that are less than 12 miles from the center of the nearest city and have a population density of 1,314 households or fewer per square mile, or are greater than 12 miles from the center of the nearest city and have a population density higher than 106 households per square mile. Table 7 describes the total count by tract and county designation.
Table 7. Pilot Focus Group Sample Pool by Location and Type Classification.
A proportional weighting was given to each county based on percentage of representation of their providers for that target. For example, Baltimore City had 9 total urban providers in the sample pool, Baltimore County had 4, Montgomery
113 Igielnik, Grieco, and Castillo 2019
County had 14; Prince George’s had 9. Respectively they represented 25%, 11%, 38%, and 25% respectively of the total 36 potential urban area programs in the pilot sample pool. As 10 programs were targeted for selection, the sought minimum sample distribution was 2 Baltimore City, 1 Baltimore County, 3 Montgomery County, and 2 Prince George’s County urban programs, with at least one being a Large FCC. Using a free online randomization tool, random.org, participant identification codes, grouped by county and area classification, were loaded in a comma delineated set into the application for each county. Once the requisite number of random participant identifications were selected based on the targeted weighted proportion, the following procedures were conducted:
1) To reach the targeted sample size for that area type, the balance of nonselected programs across counties were grouped together and entered into the random selection tool with the required number needed then chosen.
2) If at least one Large FCC had not randomly been selected prior to the above step and had expected representation by area (urban or suburban), then a grouping of only Large FCC noted codes were entered for selection before adding in the balance of remaining unselected FCC providers. This technique was only needed for the suburban category.
3) The entire process, from proportional weighting to selection, was repeated by geographic area type until the 35-program sample was completed. An oversampling of 5 programs per category was done to create a rank ordered list of alternates should one of the prime selected participants no longer want or be able to participate.
To protect anonymity, the final specific participant counts by county and area type are not displayed, but the proportional representation of 10 urban, 20 suburban, and 5 rural with 2 FCC providers was achieved, and all high-density counties of Baltimore City and County, Frederick, Harford, Howard, Montgomery, and Prince George’s were represented with 11 other counties. Interviews were conducted over 7 of the offered 10 dates with group sizes ranging from two to seven participants. All sessions were conducted in English though a Spanish language session option was made available at registration but not selected by any participant. Nine participants identified as bilingual, with three being Spanish speakers. Each session was both recorded and auto transcribed via Zoom technology as well as contemporaneously captured in notes by three independent study team members and the session facilitator. These notes would then be compared immediately afterward in a post-session debrief and shared electronically. Giorgi’s Descriptive Phenomenological Method was used for analysis based on the following procedures:114
114 Giorgi 1985
1) The formulation of the research questions – in this case the survey protocols
2) The data-collection of the interviews
3) Familiarization – researcher reading verbatim transcriptions of the interviews to understand the perspective of the subject (termed co-researcher in phenomenology), without applied bias or subjective interpretation from the researcher
4) Division into meaning units – looking for themes that emerge by each coresearcher’s transcript of feedback and commentary that can be assigned topical meaning and chunked. This allows for comparative analysis.
5) Meaning unit analysis or transformations – here the researcher begins to apply interpretation, or what has been termed “Imaginative Variation” – the ability to try and gauge broader meaning, association, or applied context to the various “meaning units” identified in the previous step. Polkinhorne describes it as, “Imaginative variation is a type of mental experimentation in which the researcher intentionally alters, through imagination, various aspects of the experience, either subtracting from or adding to the proposed transformation. The point of free variation is to imaginatively stretch the proposed transformation to the edges until it no longer describes the experience underlying the subject’s naïve description. The use of these processes is to enable the researcher to produce meaning transformations on which there is consistent intersubjective agreement.”115
This step allows the examination of common trends across different respondents who speak from their own personal context, but with examination, common connections can be seen.
6) Situated structure statement and general structure statement – where the situated structure statement synthesizes the Meaning Units for each coresearcher (subject) and gives the broad themes for that individual, while the general structure statement draws universal take-aways across all participants. Sometimes an additional examination looks at each situated structure statement and draws general analysis of commonality, but there’s debate about the difference between this and the general structure statement.
Key themes and findings from the focus group interviews will be presented in the next chapter. Somewhat unexpectedly but in ways validating the need for a support system, many of the pilot participants wanted to spend more time talking
115 Polkinhorne 1989
about issues facing FCC at-large, but specific to informing the study implementation, the following major points were identified:
• 51% of participants were not familiar with all referenced terms and requirements indicated in the Blueprint such as the differences between the Maryland Child Care Credentialing program and MSDE TEACH Hub for teacher certification, or the roles of MSDE licensing versus the Maryland EXCELS and Accreditation processes versus the broader technical assistance and training supports. In response, a companion descriptions chart was added to the final survey defining specific terms, requirements, initiatives, and entities, with hyperlinks to official pages for more information.
• General readability of questions and prompts was not problematic, though phrasing of 7 response options were consistently flagged as confusing as worded, with two specifically unclear in terms of the differences between them. In response, five of the questions were reworded, and the remaining two were combined into a reworded singular option, with all emailed back to participants for feedback. Thirty-three of the thirty-five participants replied and all agreed with the changes. Note – there was a generally raised concern about understanding of certain terms and concepts specifically for non-English speakers. It was shared that the census survey would be natively translated into Spanish, with a link to Google Translate for other languages.
• The final major category of feedback concerned the cost section of the survey. This will also be discussed further in the next chapter, but specific to the survey design, there were significant concerns around the accuracy of any financial information collected through the survey. Participants shared examples of other self-reported financial collection efforts where they or others either intentionally or mistakenly misreport for various reasons. It was clear in reviewing questions there was not a consistent understanding of terms like gross and net revenues, nor were all providers tracking the differences between overall household incomes and expenses versus those specific to their child care operations, let alone disaggregated by child population served. There was also a broad feeling of suspicion in sharing financial information publicly. As a result, it was agreed that the better approach would be to use the survey as an opportunity for respondents to indicate their willingness to be contacted for follow-up individual guided interviews designed to help explore specifics around associated operational costs with being a FCC provider generally, and in provision of Pre-K programming.
Based on feedback from the pilot focus group, a modified version of the survey was distributed to the advisory group for final review in June 2023. With no further suggested changes, the survey distribution began utilizing the same advertising distribution for the pilot recruitment. A single PAU was offered for any respondent that provided their name and contact information with entry into a random drawing for one of thirty $25 gift cards. The survey launched only in English with a translated Spanish version being made during initial launch. Survey recruitment materials in English and Spanish, with the Spanish language version noting that survey coming soon, were released concurrently at the start of July 2023. The target sample was 354 responses. A paid social media campaign was renewed bi-weekly based on response rates. Response collection was extended through September 2023, when three successive weeks produced no new respondents. In total, 274 responses for the English language version were received, 20 responses for the Spanish language version. The lower number of respondents from the target increased the margin of error to 5.5%.
In addition to the surveys, a series of online interviews were planned. Costmodel interviews were scheduled with FCC survey respondents who indicated interest in follow-up conversation. A select number of key leaders conversations were conducted with individuals directly connected to policy and practice for FCC providers.
Thirty-one respondents on the survey indicated they were open to follow-up conversation regarding their cost model, but only 26 provided their specific contact information for follow-up. Using demographic questions from the survey, a series of profiles were constructed for interviews stratified by:
• Geographic area: urban, rural, suburban
• Years of experience: 1-3 years, 3-10 years, 10+years
• Population served: only Pre-K aged, mixed aged, no Pre-K aged
• Future plans: plans to leave the filed within the next three years: leaving, maybe leaving, not planning to leave
Looking at these dimensions, the pool of respondents narrowed to 22 based on complete survey answers. Nine profiles were sought, three from each geographic area differentiated by population served, with the overall sample reflecting at least one respondent from each of the remaining conditions, including at least one Large FCC. Figure 7 shows the minimum profile types sought.
Serving only infants in a rural, urban, and suburban location.
Serving only preschoolers in a rural, urban, and suburban location.
Serving only mixed ages in a rural, urban, and suburban location.
At least one Large FCC
At least one from each experience level: 1-3 years; 3-10 years; 10+ years
At least one from each job status condition: leaving field in next 3 years, maybe leaving, not planning to leave.
Based on the respondents’ profiles, there were 19 distinctive profiles but not enough participants were available to complete the desired distribution of profiles by geographic area. It was decided to proceed so long as there was representation of each geographic area and enrollment condition in the final group. Fifteen costmodel interviews were scheduled; seven participants did not appear or respond to subsequent attempts to reschedule. Table 8 shows the matrix of the eight interviewees’ profiles that were conducted. Shaded cells indicate no participant met these criteria. Cells with a horizontal line represent a profile that did not appear for the scheduled interview. Four Large FCC providers did respond, representing two different geographic areas, both with 8 preschoolers enrolled, in addition to other ages.
Each interview was conducted using a scripted protocol with participants informed of four key aims of the questions:
1) Understanding their enrollment goals and annual level of enrollment they maintain
2) Understanding the costs involved in running their business, both in terms of general overhead and in terms of cost per child.
3) Understanding any investments needed to participate in the Blueprint for Maryland’s Future
4) Understanding any strategies currently being used to reduce costs / subsidize revenue
A 45-question interview followed with a single facilitator also taking notes. This method was used to minimize discomfort for the interviewee in discussing sensitive private financial information in front of an audience. These sessions were also not recorded, but answers were captured digitally into an electronic template setup by associated participant identification. The questionnaire used a branching logic based on the specific profile of that provider, for example asking about costs for specific ages they serve. Interviews took approximately 1-2 hours and were individually scheduled based on the requested availability of the participant. The eight participants who appeared for their interviews each received a $25 gift card.
NOTE: Shaded cells represent no respondents
Five key leaders’ interviews were conducted with organizational representatives in positions of support and advocacy for FCC providers. None of the leaders were in regulatory compliance enforcement roles, but all were extremely familiar with the Blueprint; all had previously given expert testimony around various aspects of Blueprint implementation; and three of the five had direct experience as FCC providers at some point in their careers. A request was submitted to interview MSDE representatives for this study, and leadership from the Division of Early Childhood was receptive but directed the research team to the established protocol for approval by the superintendent. A formal request was submitted with follow-up inquiries. During this time MSDE was undergoing significant leadership changes with eventual turnover of the state superintendent and other top lieutenants, so it is not believed that the agency’s lack of response was more than a product of procedural uncertainty in a time of transition. For the interviews that were conducted, each was facilitated by a member of the study team who acted as the note-taker and not recorded to encourage the respondents’ comfort to be candid in their feedback. A standardized interview protocol consisting of 10 questions arranged around the categories of barriers and supports was used, though respondents were allowed to add additional commentary as they saw fit. Interviews ranged from 1 to 3 hours. Interviews were not transcribed verbatim, but the interview notes were examined for general themes and perceptions and reported in the next chapter.

For the quantitative analysis, descriptive statistics using analytical software SPSS were conducted on the collected survey data. Independent sample t-tests on dependent measures were conducted between means of groupings by experience level at a 95% confidence interval (CI), using one-tailed test with p values below .07. The data was visualized through a variety of graphing techniques to examine comparative trends between the response option frequencies and rankings.
Qualitative analysis was applied to the examination of the pilot phase focus group responses via Giorgi’s Method for Descriptive Phenomenology. Trends and themes were noted from the key leaders interviews and examined within the context of the quantitative findings from the survey. Lastly, cost model profiles were constructed based on eight archetypes of FCC respondents.
All findings are presented next in this report and summarized in a companion Executive Briefing document and presentation. The report has taken longer to complete than initially proposed, having been planned for submission by the end of September 2023. Delays arose as the level of effort to complete was greater than the allocated resources, so the FCCA, as the fiscal sponsor, graciously allowed more time to complete. This report is the product of a sponsored contract and is submitted to the FCCA as a contract deliverable, with further distribution at their discretion. No part or aspect of this study, from methodology and design, data collection, analysis, reporting, interpretation, and recommendations, has had any direct influence, demand, or impact by the FCCA leadership. FCCA staff were members of the study team who contributed expertise and perspective, but all findings are reported without any modification or adjustment as collected from the participants. Dr. Swanson served as study lead and primary author.
Results are reported by focus area of barriers, supports, and costs. Focus group qualitative findings and survey quantitative findings are presented by each section. Descriptive statistics were conducted and reported in the demographics section by participants from the field test focus groups and for the aggregated English and Spanish language surveys unless specifically noted.
For the survey, descriptive statistics were conducted on demographic questions and all other dependent measures. A total of 294 participants initiated the survey (274 English language, 20 Spanish language), but a sizable portion did not finish it (n=171 completed surveys as defined by making a selection for all barrier/support questions and at least 80% of demographic questions). Figure 8 shows a heat map by zip code of survey respondents locations, with light blue shading representing a singular respondent from a particular area to red representing six respondents, the greatest concentration, and hues in between reflecting counts of respondents between those values.
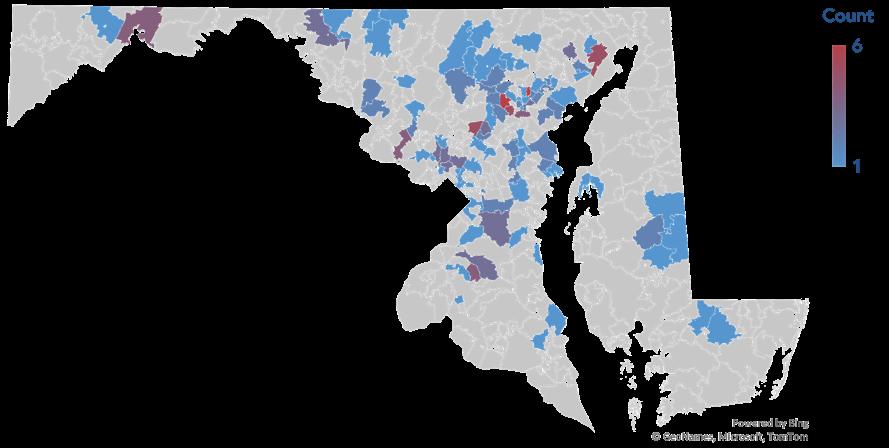
Of completed survey respondents, most have been active as FCC providers more than 20 years (35.6%); followed by between 10 and 20 years (27.0%); 5-10 years (17.8%); 1-5 (16.1%); and few with less than a year (1.1%).
Most FCC respondents had the maximum allowed two infants enrolled (50.9%); with roughly equal proportions reporting no infants (25.1%) or only one (24.0%). Most respondents enrolled no school-aged children (45.8%); while 26.8% enrolled 1-2 schoolaged children; 24.4% enrolled 3-5 and 3% enrolled more than 5 school-aged children. The majority (81.8%) of respondents had at least one preschool-aged child enrolled, with no regular FCC respondent exclusively serving Pre-K aged children. Tables 9 – 12 show the distribution of respondents by years of service and enrolled ages served.
Table 12. Survey Results for Enrolled School-Age Students by Respondents’ Years of Service.
Most respondents were either the sole employee (65.7%) or one of two employees (23.5%). Others indicated they were Large FCC, and two respondents indicated they were owner/operators of multiple regular FCC locations but selected having more than 3 employees including themselves. Table 13 shows the distribution of employee levels by years of service.
Table 13. Survey Results for Number of Employees by Respondents’ Years of Service.
In examining plans to close in the next three years, most of the 171 completed respondents did not anticipate closing in the next 3 years (69.0%), but close to a quarter were unsure (21.6%) or stated they were closing (5.26%). Table 14 shows the results by years of service in response to the question, “Do you plan on closing in the next three years?” While the majority of respondents indicated they did not have intention to close, a concerning trend is shown within the years of service bands, where at the 1-5 years, 5-10 years, 10-20 years, and more than 20 years levels of service, the combined categories of potential attrition equates to approximately a third of the supply of respondents. There is caution in overly generalizing results given the lower power-effect of the sample size, but these outcomes align with qualitative data shared in interviews discussed later and broader trends seen in the field and portends
a continuation of the exodus of FCC providers. To further explore, the analysis was reconducted based on the entire 294 received surveys.
Table 14. Survey Results Closure Plans by Completed Survey Respondents’ Years of Service. Plans to Close
To re-examine this risk of FCC closures as a reflection of the broader Maryland FCC population, the entire 294 set of received surveys were analyzed. Of those, any respondent that had a completed answer for this question: “Do you plan on closing in the next three years?” and an indicated selection that they are a “FCC Provider” (a discriminator value of “I am not a FCC provider” was included as this was an open and optionally anonymous survey, and though advertised for FCC, we could not guarantee only FCC providers responded) was included in the sample. From that, 206 surveys met criteria. Table 15 shows the modified results with blanks omitted.
In reexamining plans to close in the next three years of the 206 sample, the number not anticipating closing in the next 3 years fell to almost half (55.8%), as the number of “not sure” increased to more than a quarter (26.7%), and the number of those that said they would close rose to 17.5% of respondents. While overall the majority of respondents still indicated they did not have intention to close, an examination of the years of service bands reveals a more unsettling potential impact. As shown in Figure 9, in all levels, the sum of affirmed and potential closings exceed 30% of the population; with all but the 10-20 years level nearing or exceeding 50%.
Using Cochran’s formula for calculating sample size, the revised 206 sample remains generalizable to the broader FCC population at a 6.5% margin of error and 95% confidence level.116 Meaning these results can be generalized as being likely reflective of broader trends across the entirety of Maryland’s FCC field. This aligns with the historic closure trends and projected rates previously reported and is further reinforced in the focus group and cost-model interviews discussed later in this section. It is worth noting that there is likely an underreporting of potential closure threats. Looking at incomplete survey responses, those who indicated “Yes” to expected closing in three years were four times more likely to not complete the survey than respondents that indicated they did not plan on closing. While other incomplete survey responses are impossible to fully analyze for quantitative meaning, the sheer number of respondents who started but did not complete, who did not complete the survey in a linear manner – skipping demographics, picking select questions from the barriers and support sections – provides a qualitative insight that is reinforced again through the interviews. Many within the FCC community fear sharing “information that could identify me” stemming from perceptions of a historically weak partnership with MSDE and associated entities.
116 Bartlett, Kotrlik, and Higgins 2001
That was a sentiment shared many times in interviews. At the same time, there is significant misunderstanding and misinformation amongst the FCC community around requirements and available supports and resources. In looking at incomplete survey answers, there is a predominantly negative trend line to those responses, which begs the question of a larger threat of dissatisfaction in the field leading to attrition. As noted in previous chapters, loss of FCC has consequences in Maryland’s overall early care and education supply, ability to meet the Pre-K expansion aims of the Blueprint, and disproportionately impacts some of the most vulnerable children and families, so this is a looming threat worthy of concern.
Table 16 looks at the follow-up question to the closure plans to ask respondents to indicate their top cited reason for their choice. Again, including both complete and incomplete survey responses that had a matched response for their three-year plans and highest-cited reason for closure, the 91 sample reduced to 66 respondents. The highest cited reason (19.7%) is “New additional/requirements” – referring to changes related to the implementation of Blueprint. Tied closely behind are “Burnout” and “Financially not viable” at 18.2% each. This is seen is Table 16, where cells reflecting “Not Sure” respondents are coded in green and those that indicated “Yes” to closing are shaded blue.
These results are further affirmed in the themes that emerged during the phenomenological analyses of the focus group conversations and the cost-model interviews that will be described further on in this chapter. It is worth noting the implications on children and families from this potential supply disruption. The additional 18 “Yes” respondents are omitted in this next examination as they do not have complete data records but returning to the original 48 (39 – “not sure” and 9 “yes” to closing), without revealing specific geographically identifying data, Table 17 uses the RUCA designations to classify programs by Urban, Suburban, and Rural locations, by population served, and attrition status. Respondents were not asked to give specific enrollments, but indicate a range of enrolled children by age groupings on the following values: none, 1-2, 3-5, or >5 for toddlers, Pre-K and school-age children. Since COMAR allows no more than 2 infants, that value was restricted to a choice of none, one, or two. Given this, total potential child slot impacts reflect a range of potential upward values with a “+”. Given this, the current 48 programs at risk of closing represent a potential impact to 257+ children. Of those, 33.4% come from urban areas; 30.7% from suburban areas; and 35.4% from rural ones. Pre-K agedchildren served represent the largest potential impact, at 40.4%. This is an interesting finding in light of the “New Additional Requirements” cited reason for closing in Table 16, and supported in the interviews. The bulk of the FCC respondents provide care for preschool aged children. As was noted in Chapter 2, the majority of the field does not meet current Blueprint requirements to receive Pre-K expansion funding, and that burden seems to be driving a perceived concern about loss of enrollment to sustain their operating model.
16.
That brings up the next question asked of respondents, with regard to their familiarity with requirements and associated funding through the Blueprint. Table 18 reflects the results, back to only completed responses. Of those, the majority of respondents (60.2%) were familiar with Blueprint requirements and the associated available funding for Pre-K expansion. Still, that leaves 33.3% either unsure or not familiar. This aligns with the broader trends of FCC providers being disconnected from the broader ECEC community at-large. This is a product of several factors, including general isolation associated with their operating structures, but also reflective of the “multi-hats” FCC providers wear, as was a common theme stated in interviews and noted in the upcoming Barriers section, leaving little time for additional engagement with broader field-based initiatives.
In examining the ways in which providers are supported, Table 19 reflects respondents’ choices of all sources of supports they utilize. Respondents were able to select multiple sources of support and choose “other” and submit a specific named source. Of those 13 “other” selections, all were specific individual names, that when cross-referenced, three were licensing specialists, six were other FCC providers,
two are private trainers, two were MSDE Quality Assurance Specialists, and the remaining name was unidentifiable. Several key findings emerged. The more veteran the provider, the more established their network of supports; with 20 plus year FCC providers citing 40.2% usage of all support types, followed by 10-20 year providers at 25.2% and 5-10 year providers at 19% respectively. Relatively new to the field providers have the lowest reported use of supports,with those who are between 1-5 years of service accounting for 14.9% of the total support usage, while brand new providers account for less than 1%. Table 19 lists the type of support in descending order by total count of cited usage. The top three utilized supports: MSDE Licensing Specialist, Maryland EXCELS Program Coordinator, and MSDE Quality Assurance Specialist garnered 25.7%, 21.6%, and 14.4% of the responses. It is interesting, and will be discussed further under the Barriers results, but a question there yielded a top result of misalignment between licensing, Maryland EXCELS, Maryland Accreditation, and other initiatives as the top-rated barrier, suggesting that while these representatives are the most frequently consulted, there is a perceived need for greater coordination of information and policy amongst these independent but overlapping organizations. The bottom percentile utilized resources were College/Higher Education Staff and Local School System Staff. This again aligns with later findings around barriers where a significant number of FCC providers cite challenges working with their Local School System and corresponds with the large segment of FCC providers not enrolled in college.
Within the middle segments, clustered around the 13% usage rate, is a reliance on peers/informal supports, the Maryland State Family Child Care Association, and the MSDE Credentialing Office. Again, the more seasoned the provider, the more likely their reliance on these supports, which logically makes sense as they establish their colleague networks, participate in the association, and move up within the Maryland Credentialing System. The difference between a 20+ year veteran and a 1–5-year provider is almost 4 times as likely to rely on these types of supports.
The near equal rates of use of the Resource and Referral and Maryland Family Network Staff speaks to the overall established technical assistance structure in Maryland. Go FCC is an initiative developed by Maryland Family Network to help onboard new FCC providers into the profession, helping to establish an early connection that continues and is reflected in the mid-career utilization counts. As Maryland Family Network is the coordinating entity for the Resource and Referral (R&R) agencies, this also helps to create opportunities for early synergies between the FCC provider and their local R&R. This type of integration model, which is reflected in statistically comparable rates of usage across the service levels between the two resource types, suggests greater alignment between other initiatives could produce stronger coordination and reduce complaints of misinformation and competing interests.
ASPIRE accounts for only 9% of the cited utilized supports, but as the statewide initiative featured only 64 FCC providers in the program, this response rate reflects nearly 50% of potential participants from that initiative. Judy Centers are a free resource available to FCC providers and families they serve, with only 5.8% of the respondents noting using the resource. As will be discussed again later, Judy Centers are co-located within public school settings, and many FCC providers report challenges in accessing and working with local school resources. The remaining supports, private trainers, NAFCC specialists, and the “other” category, all polled around 3%. Maryland is fortunate to have a robust private training community, yet again, there’s a lack of coordination and informational accuracy assurance. NAFCC is the only program accreditation available to FCC. Routine complaints include major backlogs, delays in responses from specialists, and other logistical challenges. As such, there is a dearth of accredited FCC providers in Maryland, further limiting the pool of eligible programs to participate in Pre-K expansion which requires achieving Maryland EXCELS Level 5, which in turn requires obtaining a valid accreditation.
Table 19. Cited Sources of Utilized Support by FCC Providers (multi-response allowed)
Since participants were asked to indicate their level of familiarity with Blueprint using the response options “yes” “no” and “not sure” indicated in Table 18, the researchers wanted to examine if a relationship existed between familiarity
with Blueprint and sources of support, so a chi analysis was conducted. Because respondents were able to check multiple responses, the frequencies were different for each type of support and observations. To determine if individuals who reported using each of the supports differed by knowledge of the Blueprint, the “no” and “not sure” categories were collapsed into one response option and the research team completed a series of Chi-square tests for goodness of fit. For many of the supports, significantly more participants who reported using the supports were also knowledgeable about the Blueprint (reported yes) as opposed to those who were unsure or who didn’t know. Green comparisons are significant at the p < .05 level. Table 20 summarizes supports with significantly increased awareness of Blueprint by associated support source.
Of those individuals who indicated using the resource and referral staff, 67.6% were familiar with the Blueprint in comparison to 32.4% who were unsure or didn’t know, χ2(1, N = 37) = 4.57, p = .03.
Of those individuals who indicated using the MSDE Quality Assurance Specialist, 64.2% were familiar with the Blueprint in comparison to 35.8% who were unsure or didn’t know, χ2(1, N = 53) = 4.25, p = .04.
Of those individuals who indicated using the Trainer/Private Consultant, 60.0% were familiar with the Blueprint in comparison to 40.0% who were unsure or didn’t know, but this result was not significant, χ2(1, N = 15) = 0.60, p = .44.
Of those individuals who indicated using the NAFCC Specialist, 46.2% were familiar with the Blueprint in comparison to 53.8% who were unsure or didn’t know, but this result was not significant, χ2(1, N = 13) = 0.08, p = .78.
Of those individuals who indicated using the MSDE Licensing Specialist 64.2% were familiar with the Blueprint in comparison to 35.8% who were unsure or didn’t know, χ2(1, N = 95) = 7.67, p = .006.
Of those individuals who indicated using the MD Excels Program Coordinator, 65.0% were familiar with the Blueprint in comparison to 35.0% who were unsure or didn’t know, χ2(1, N = 80) = 7.20, p = .007.
Of those individuals who indicated using the MSDE Credentialing Office, 66.7% were familiar with the Blueprint in comparison to 33.3% who were unsure or didn’t know, χ2(1, N = 48) = 5.33, p = .02.
Of those individuals who indicated using the Local School System Staff, 83.3% were familiar with the Blueprint in comparison to 16.7% who were unsure or didn’t know, the result was not significant, likely due to the small frequency of responses, χ2(1, N = 6) = 2.67, p = .10.
Of those individuals who indicated using the Judy Center Coordinator, 81.0% were familiar with the Blueprint in comparison to 19.0% who were unsure or didn’t know, χ2(1, N = 21) = 8.05, p = .005.
Of those individuals who indicated using the College/Higher Education Staff, 55.6% were familiar with the Blueprint in comparison to 44.4% who were unsure or didn’t know, the results were not significant, χ2(1, N = 9) = .11, p = .74.
Of those individuals who indicated using the ASPIRE Coach, 90.9% were familiar with the Blueprint in comparison to 9.1% who were unsure or didn’t know, χ2(1, N = 33) = 22.09, p < .001.
Of those individuals who indicated using the Family Child Care Association Staff, 70.2% were familiar with the Blueprint in comparison to 29.8% who were unsure or didn’t know, χ2(1, N = 47) = 7.68, p = .006.
Of those individuals who indicated using the Maryland Family Network Staff, 65.7% were familiar with the Blueprint in comparison to 34.3% who were unsure or didn’t know, the result is not significant, χ2 (1, N = 35) = 3.46, p = .06.
Of those individuals who indicated using the Peers/Informal Supports, 82.0% were familiar with the Blueprint in comparison to 18% who were unsure or didn’t know, χ2(1, N = 49) = 22.22, p <.001.
These supports are more naturally ingrained within the FCC provider’s work structure, and as was demonstrated previously, particularly for those FCC that are more established. This reinforces the concept that creating support and communication vehicles that are more intrinsic to the daily operations of FCC are more likely to be effective in creating consistent awareness and information relay.
As previously noted, Giorgi’s Descriptive Phenomenological Method was used for analysis of qualitative data.117 As a reminder, following this method, each interviewee’s transcript is ultimately chunked into units of meaning, and this allows for comparative analysis across respondents. There were 35 participants in the Focus Interviews that served two purposes: 1) field testing the survey instrument; and 2) gathering qualitative data around the topical questions. To protect anonymity, the final specific participant counts by county and area type are not displayed, but a proportional representation as defined under the Methods in Chapter 3 of 10 urban,
117 Giorgi 1985
20 suburban, and 5 rural providers with 2 Large FCC providers was achieved, and all high-density counties of Baltimore City and County, Frederick, Harford, Howard, Montgomery, and Prince George’s were represented with 11 other counties.
Table 21 represents the Meaning Units related to barriers that had greater than 50% agreement amongst the sample of participants, reported by consensus rate.
For the purposes of this report, “general structure statements” – universal take-aways from the data – are more valuable than “situated” analysis pursuant to an individual respondent, though specific quotes/examples will be used to illustrate
larger points. Several broad themes emerge. Respondents universally cited that expectations on them as a FCC provider were already high, with the majority being a singular individual performing multiple roles that are delegated to multiple individuals in Centers and public schools, with a perception that there’s been a steady increase in demands from regulatory agencies such as MSDE without accompanying increased capacity and competency of support structures and systems, and now Blueprint has exponentially added to that burden.
Examples were given of extreme delays in receiving responses from the TEACH Portal when trying to receive the teacher certification; the fact that as a single FCC provider who is teaching, doing administrative operations, responding to regulations, there will be multiple emails coming from different entities within MSDE such as licensing, Maryland EXCELS, credentialing, all with time sensitive demands for response. Many providers pointed out the fact that public Pre-K do not receive Maryland EXCELS ratings below a Level 4 by policy, and their requirements to achieve a Level 4 are not the same as those expected of child care, so the burden is greater on private providers than on their public-school counterparts. At the same time, parents do not have a consumer choice with regard to where they send their child for public Pre-K as they do for the private care market, so the impact of the quality rating is felt less by public schools, further increasing strain and burden on the private market to manage atop the other Blueprint requirements. Likewise, a public school system has an entire infrastructure in place to manage all the aspects of compliance, staffing, and other dimensions that typically a single FCC provider is responsible for, and they do that at a significant pay differential.
Grouped in the 90th percentile, providers reported the following:
• These challenges are exacerbated by a feeling of receiving conflicting information from support entities that FCC providers are often dependent upon for meeting requirements to receive critical financial assistance that enables their participation in initiatives like Pre-K expansion. Similarly, the majority of providers report extreme difficulty in working with their local school systems.
Several providers shared stories of being told contradictory information by their licensing specialist, Maryland EXCELS program coordinator, MSDE Quality Assurance Specialist, and local Resource and Referral technical assistance support. Other examples were given where a college professor provided incorrect information regarding Maryland EXCELS and another around Maryland Credentialing. A respondent paid an “expert” consultant to help with their Maryland EXCELS application and their submitted evidence was not sufficient. The consultant was unnamed and could not be verified as to their actual expertise. Many providers reported being told conflicting things from different licensing specialists.
In sum, this creates confusion and distrust, and often leads to providers turning to informal sources of information that breeds rumors and inaccuracies being perpetuated. During the interviews, several providers made multiple incorrect statements about Blueprint requirements, about other MSDE initiative requirements, even about licensing regulations. Providers reported challenges in working with their local school systems. Most were unaware of local early childhood advisory councils or school-system Blueprint commissions that have been convened toward creating implementation plans. Again, some stated known inaccuracies about such. Likewise, many reported challenges with routine coordination with their local schools. Multiple stories were shared about not being able to receive information on a child’s IFSP or IEP, or not being invited to participate in a team to provide input on the child, and unanimously, all reported never having any local school system service provided within their program. Three providers reported being turned away when trying to attend a training hosted by a local school system because they were told it was only for “child care providers who are teaching.” No respondent indicated receiving materials or supplies from their local school system.
“I’ve been doing this a long time, I’ve had babies grow up to be doctors...I don’t know if I want to keep doing this.”
In the 80th percentile, several themes emerged:
• Providers feel a sense of isolation. They feel unvalued and not respected and are desperate for more direct help. Expressed sentiments included, “I’ve been doing this a long time… I’ve had babies grow up to be doctors, lawyers, even a politician, yet it feels like I’m being told that the way I have done my business for over 20 years is wrong. And I don’t know if I want to keep doing this.” “It feels like we’re always on our own – they [MSDE] keep telling us what we have to do without giving us tools and resources to help –just demands, like they don’t think we care. It’s not that we don’t care, but it’s really impossible to do without more help.”
• There is a broad feeling of poor partnership between MSDE and the FCC community. It was a barrier at first with this study, requiring significant demonstration that this was an independent study, and all data were confidential and would be deidentified to protect anonymity. Numerous participants expressed fears of retaliation, sharing stories of perceived punishments from public agencies in the form of being penalized in monitoring and other compliance mechanisms for arbitrary findings based upon being vocal critics in the past.
• There is a feeling of being in an impossible situation where demands are made with no one really understanding the logistical realities. That leads to feeling ill equipped to do the job well – which should be noted – there was universal pride and desire for excellence as a FCC professional. There was clear understanding of the importance of the role they play in a child’s life, and a profound want to do it well, but from realities of time and the financial model, there was a common refrain shared that this feels impossible and no “power that be” seems to care. This led to more than one statement of suspicion that “they” want to force FCC out of business and only have Center and public Pre-K. Providers noted practical realities of having children arrive as early as 5:30 am and sometimes not get picked up until after 8 pm, and the necessity of maintaining those hours for the families they serve, plus raising their own families, as impossibilities to then taking classes and doing other requirements to meeting Blueprint requirements, yet they question what data would demonstrate that they are more or less effective at preparing children for future success. Many cited ongoing statewide poor performances on the Kindergarten Readiness Assessment as a question of whether that’s the right measure of success and noted anecdotal evidence of what their clients have said about their services, their waitlists as a testament to their quality, and purported life trajectories of children who they once cared for as proof that they are at least meeting the needs of a segment of children. That sentiment was reinforced often: FCC has historically been a more adaptive option with a specific strength to not be like Center and school-based programming, and it feels like there is pressure to create a conformity model.
In the 70th percentile, the themes of the tension between FCC and other program types continued:
• Providers reported feeling they were being forced to change what had historically made their programs strong. This Unit of Meaning was categorized distinctive from being “Different for a reason” intentionally as the former often reflected statements around structural changes, i.e. being able to served mixed-age groupings, that both parents and providers saw as developmentally beneficial and practically good for consumers, but difficult to continue under the new Blueprint requirements.
• Many providers expressed concerns about the future supply of infant and toddler care as it would be financially not viable to continue providing those slots after investing in meeting Blueprint requirements, and feasibly being unable to conduct Pre-K programming and care for infants simultaneously
in accordance with the Blueprint. The latter referred to the philosophical rationale touched on in the above section – those providers felt FCC served a unique role within the mixed-delivery system of ECEC. They noted how their environments often helped children who needed smaller settings, who struggled with maturation and benefited from more one-on-one attention. This aligns with the previously reported literature in Chapter 2.
In the 60th percentile, emergent themes included:
• Providers were concerned that the Blueprint payments would not remain, so that investments they make to meet requirements would ultimately be unsupported. Several cited past discontinuations of Maryland EXCELS bonuses, reductions in other initiatives like reimbursement rates, professional development funds, and accreditation support funds. Similarly, and in part mentioned to the inefficient supports, several reported concerns with late payments, and the need to rely on a reimbursement model.
• Many of the respondents did not employ additional personnel, but when specifically prompted to consider staffing as a barrier for FCC providers at-large, a majority relayed a sentiment across their networks in struggling to find personnel. Multiple respondents noted their intention of completing their degrees and taking a job with the local school system for higher pay and benefits. Others who had been teachers in the school system expressed frustration that they left that environment because of what they perceived as a “push down” model that was developmentally inappropriate for children, and creating increased stress and anxiety with high-demand academics, only to feel that model being imposed in FCC now. Several spoke to the increase of behaviors and social-emotional needs coming out of COVID, and a worry that Pre-K expansion will only add to the early childhood mental health crisis by adding additional academic pressures at younger ages.
• A common sentiment was around a perception of double standards. Many felt that most of the Blueprint, Maryland EXCELS, Maryland Credentialing, and other initiatives are biased toward Center and public Pre-K programs, but specifically they cited the fact that public Pre-K have higher rates of pay, can have quality and licensing violations without repercussions, and have massive support infrastructures, and by the data, are not demonstrating they are doing a superior job in preparing children, yet FCC providers, who are under-resourced, feel like they are constantly under attack and criticized, and held to higher standards. At the same time, several noted the financial models are not equal. Public schools have set funding established at the
start of the year, while private FCC providers are reimbursed based on child enrollments, where families routinely move, so that a private FCC provider may incur expense in meeting Blueprint demands only to see their revenue stream leave as that child moves, whereas a public school would not be implicated in the same manner.
• Another theme centered on “too many hoops” to have to jump through to receive funding and support. This comes up again in the supports section, but examples include having to complete lengthy grant applications, without much understanding of that process, or time to devote to it. There was frustration with what is perceived as arbitrary information requests and/ or duplicative information requests across initiatives such as licensing and Maryland EXCELS and Maryland Credentialing.
• While not a specific barrier, it was a common refrain worth noting as it aligns with the larger threat of attrition in the field, expressions of “I don’t know if it’s worth it,” or “I’m not sure if I’m going to keep doing this,” to at least one provider in the focus group stating they were definitely closing. Asking the group the same question about potential future plans, approximately 30% were unsure if they’d continue, 1 provider indicated they would close, which they described as an accelerated retirement “based on all this mess,” and the remainder either did not respond or stated no plans to close. For the 11 potentially or definitively closing, their top 3 cited reasons in order were:
Burnout
New/additional requirements
Financially not viable
In the 50th percentile, one theme emerged, and it was not dominant:
• Several providers expressed a feeling that licensing regulations were too strict and wanted to see specific requirements relaxed. While there was a majority agreement around this notion generally, there was no consensus around any specific cited policy change (i.e. ratio changes, staff credential changes, background checks, etc.), though specific policies were not explicitly polled. Even still, there was robust disagreement that there should be any relaxing of licensing regulations, with several providers noting safety and well-being concerns. Generally, when conversations began amongst providers, the disagreements tended to resolve around wanting consistency versus redaction, but as a defined Unit of Meaning per individual transcript, the concept of reduced licensing regulation did originate for 54% of participants.
Overall, the focus groups reveal a need for a stronger coordination and outreach model to FCC providers that supports them consistently, proactively, and comprehensively. There is a need to foster a sense of community across the federation of independent businesses and implement logistical supports that alleviates the massive burdens felt by the profession. To further examine whether these findings were reflective of the population at-large, quantitative analysis of the survey results were conducted.
Independent samples t-tests were used to compare less experienced practitioners (those with less than 10 years of experience, n= 45) to more experienced practitioners (those with more than 10 years of experience, n=76) on dependent measures. For most measures, experience level did not affect perceptions of barriers, however, practitioners with more experience (likely older participants) rated the following as significantly more challenging barriers than less experienced practitioners (one-tailed test p values below .07):
• Confidence in being successful in completing college
• How long it takes to complete a degree
• Comfort and/or access to technology
• User-friendliness of MSDE’s TEACH portal
• Certification process is convoluted
• Locating the right Praxis materials
• Inconsistent information from colleges around certification requirements
• Licensing regulations to operate FCC are more than what public schools have to follow
• Lack of confidence in the quality/helpfulness of supports available from the local school system
• Worried about having the funding needed to meet a child’s needs
• Worried about parental concerns over instruction
• Ability to provide continuity of care when FCC serves a child from infancy through school-age based on requirements and money associated with pre-K
• Logistical burdens of hiring staff
• Expenses like payroll, insurance, compliance related expenses are static, but enrollment revenues are not
This is displayed in Table 22 by differences in means. It also corresponds to the previous data seen under the demographics where more veteran providers are at greater risk of leaving the field. It is particularly alarming given the fact that the same population is already utilizing the support infrastructure at higher intervals than their less experienced peers. This suggests a need for examining the underlying attitudinal and behavioral barriers revealed in the focus groups to make the support models more effective. Figure 10 displays the difference in means in a comparative graph, showing the provision of continuity of care from infants through school-age children as the greatest delta barrier for FCC providers with the most experience compared to the least. This aligns with findings from the focus group where respondents spoke to a strength of their model, both programmatically and financially, being the ability to provide services to a family in a cyclical manner, working with all children in the household from infancy onward. There was a feeling of worry that they would be unable to do that under Pre-K expansion yet would need to shift to remain competitive and economically viable. Comparatively, “certification process is convoluted” is the greatest cited barrier by providers with 10+ years of experience (M=3.89) but was relative to their less experienced peers (M=3.35).
< 10 Years Experience
Continuity of care (infant to school-age)
Parental concerns about instruction
More licensing regulations to operate FCC
Low confidence in local school supports
Confidence in completing college
Locating the right Praxis prep
Time to complete a degree
Funding needed to meet a child's needs
Certification process is convoluted for FCC
User friendliness of TEACH portal
Comfort or access to technology
Inconsistent info about certification
10 + Years of Experience
Figure 10. Barriers with significant differences as a function of experience level.
What follows is a reporting of means by question and summarized barrier. As a reminder, in the online survey, respondents had hover definitions that provided more explanation on each selection choice, along with hyperlinks to specific initiatives (i.e. PRAXIS, Maryland EXCELS, etc.) to clarify what was being referenced, in both the English and Spanish language versions.
Table 23 displays the reported Education Barriers’ mean values aggregated for all respondents regardless of experience level. Overall, the incurrence of upfront costs was the highest ranked barrier. Relating back to the focus groups, respondents there noted worries about cash flow to make investments and concerns over timeliness of reimbursements or guarantees that monies would be available from MSDE. This is further seen in the second highest reported barrier “Costs that are not reimbursed.” During the focus groups, respondents gave examples such as travel and even prerequisite classes necessary for them to access the required courses toward obtaining their degree.
Another highly ranked barrier (M=3.71) and one that emerged as a major cause for potential attrition from the field, was “balancing life with education.” This selection spoke to the logistics of navigating classes while operating a business and meeting the rest of life’s demands compared to the lower ranked entry: “desire to get a degree” (M=2.73). The notion of too many demands, a sense of burnout, and not enough time,
were all themes that recurred throughout the focus groups and appear as top-cited reasons for potential departures from the field. The discrepancy between desire to get a degree and the challenges in balancing the act of such reveals the burden is more logistical than attitudinal, though right below desire was the entry for “confidence” (M=2.58), with providers citing their fears or age in going back to school, and that reveals itself in the difference in means when comparing more experienced providers to their less experienced cohort. The balancing act also contribute to the length of time to complete the degree, which the U.S. Administration for Children and Families (2017) already calculates at an average of 13 years for FCC providers. Compounding these concerns are challenges with purported inconsistencies across college admissions, the MSDE TEACH Portal, and various other support entities in the field. Examples were given during focus groups of providers being told to take a given class by their 2-year degree advisor only to be told it would not transfer when they applied to their 4-year institution, or that the “degree plan” they’d receive through the TEACH Portal would be inaccurate when they went to their local universities. At the same time, other practical concerns around navigating the Child Care Professional Development Fund, using technology – with this again being a significant difference between more experienced and less experienced providers – and for those providers for whom English is not their primary language, managing a lack of native language supports – these all serve as compounding challenges to meeting the education requirements defined under Blueprint. Figure 11 depicts the comparison of means in descending order.
Upfront/out-of-pocket expenses
Costs that are not reimbursed
Balancing life with education
Length of time to complete a degree
Cost of required materials
TEACH Portal
Differences in requirements across colleges
Desire to get a degree
Confidence in going back to school
Ease of access to the Child Care Prof. Dev. Fund
Comfort with technology
Not experienced enough
English not primary language
Figure 11. Comparison of Means of Perceived Education Barriers
Table 24 displays the reported Teacher Certification Barriers’ mean values aggregated for all respondents regardless of experience level. Overall, the requirement to student teach outside of the providers’ program was the highest cited barrier (M=4.18), with the overall burden of student teaching generally being a close second (M=4.17). Like with education, with certification often having an education component, the balancing of work and life was noted as a major barrier (M=4.12). The concern of having to repay the state if participating in an alternative certification program was noted as a high barrier (M=3.88), and a specific example cited during focus groups as deterrent to participation. Respondents pointed out that given the lack of coordination and clarity with the entire system, they felt that the provider bears all the risk, incurs the costs upfront, and that was a reason to not participate in certification programs even when those costs could ultimately be defrayed by the state.
Another high-ranked barrier that was affirmed through the focus groups was burden. The complexity of the certification process (M=3.73) was noted as typically managed by school systems on behalf of teachers (M=3.63), but here, the individual FCC provider is responsible for doing so independently. Several interviewees shared anecdotes of being referred by MSDE to their local school system to submit their certification, only to be turned away by the local agency. Others reported thinking they had completed their certification only to find out later it was incomplete or had lapsed. One provider said, “I was a public-school teacher for 12 years before becoming
a [FCC] provider, and I never once had to think about my certification. My district sent me a reminder – I did what they said. Simple. Now I’m the teacher, cook, nurse, principal, billing department, HR, and apparently the entire school system all rolled up into one – for about a third of the pay. If my daughter didn’t have special needs, I’m not sure why I would keep doing this.”
Another category of barriers was around the speed and accuracy of information shared. Respondents reported lags in replies from MSDE to inquiries and determinations on certification (M=3.71), and this contributes to other sources of misinformation. Where focus group providers shared stories of beginning in one degree program, and then transferring to another, only to find that either their credits did not count, the degree did not lead to certification, or other misaligned expectations. In particular, challenges were noted around information related to the PRAXIS exams required to become certified; specifically which tests for which certifications, with focus group providers purporting receiving contradicting information from various support sources. There was a general confusion that emerged during the focus groups around the difference between a degree and the teacher certification, and in some cases, early childhood licensing and credentials. On the survey, this was one of the lower ranked barriers (M=2.25), but based on the qualitative data, that result is cautioned as there may not be widespread understanding of the differences. Finally, providers reported challenges with transferring certification (and in the focus groups, mention of degrees), from other states and countries (M=1.82). Figure 12 depicts the comparison of means in descending order.
Student teaching required outside of my program
Burden of student teaching while running a FCC business
Balancing certification with work and life
Risk of repaying state if not successful to complete degree
Complex certification process typically navigated by...
Length of time to get feedback from MSDE
Navigating certification when not in a school system
Clarity of what it takes to keep certification
Inconsistent info from different colleges
Identifying correct PRAXIS preparation is challenging
Number of times to try and pass PRAXIS
Enrolled in degree program that doesn't provide certification
Degree vs Certification understanding
Transferring certificate from other state or country
Figure 12. Comparison of Means of Perceived Teacher Certification Barriers

Table 25 displays the reported Licensure Barriers’ mean values aggregated for all respondents regardless of experience level. The highest rated barrier is around inconsistencies across all state initiatives and licensing (M=3.54). This was a highly cited theme (94% agreement) during the focus groups. Related, respondents noted cascading effects of initiatives; licensing violations implicate Maryland EXCELS rating which in turn jeopardizes a program’s Pre-K expansion eligibility (M=3.25) and (M=2.89). This was noted as not what public schools have to contend with (M=3.16), and was further reinforced during the focus group interviews where providers shared thoughts on the discrepant expectations for FCC compared to public schools.
“Inconsistent information about staffing” (M=3.09) was illustrated during focus groups by several examples where interviewees shared being told conflicting information about requirements for additional adults, substitutes, and assistants that are not consistent with COMAR. Clearly it is more than a passing concern to rank this high across the entire sample.
Aligned to the previously reported concerns about continuing to offer mixedage programming, providers worried about the physical space required to do that (M=2.97), and overall size of their home (M=2.39). Survey respondents had the option to write in additional information for any question, which most did not, but one respondent did for this specific answer, stating:
“I have a wait list and could keep my infants and expand to pk (sic) but my house isn’t big enough to have separate classes with two teachers…”
This same respondent later suggested under supports a state initiative to enable low-cost home renovations with a forgiveness on costs after a period of service similar to student loan models.
Finally, the last cited barriers focused on requirements to earning and maintaining licensure. Figure 13 depicts the comparison of means in descending order.
Inconsistencies with Maryland EXCELS, Accreditation, etc.
Impact of licensing status on Maryland EXCELS rating
More regulations than public schools
Inconsistent info about staffing
Balancing physical space requirement across mixed ages
Worries about implications of violations for Pre-K expansion
Balancing supervision across mixed ages
Having a big enough home
Earning / maintaining licensure
Requirements to become licensed
Figure 13. Comparison of Means of Perceived Teacher Certification Barriers
Table 26 displays the reported Child Needs Barriers’ mean values aggregated for all respondents regardless of experience level. The highest rated barrier is the “Required to enroll children I’m not prepared for” (M=3.64), closely followed by “Funding needed to meet child’s needs” (M=3.56). These were areas of considerable discussion during the focus groups, where providers often expressed both their experience and desire to serve a wide array of children with diverse needs and backgrounds. This is in alignment with the literature trends as reviewed in Chapter 2. Qualitatively, what providers shared in the focus groups were concerns with a perception that Pre-K expansion requires funding recipients to “accept children like the local public school,” yet as previously noted, and affirmed in the survey results, FCC providers lack confidence in receiving support from their local school system (M=3.38) nor are they often aware that such exist (M=3.31). As discussants shared, they have established networks across their peers, and work with the Resource and Referral agencies, to best match a specific child and family to a given FCC or Center provider based on capacity and competency. The concern is losing that flexibility will lead to forced situations without the requisite supports in place to ensure that child’s success or expose the provider to legal risk for being in a situation for which they are untrained (M=3.08). During the interviews, a provider shared a story about a child with autism who engaged in injurious behaviors toward other children. The provider was not specifically trained in working with children on the spectrum and was not getting responses to requests for expert support. Other families were threatening legal action against the provider. Eventually, the family removed the child from the program.
These are heartbreaking stories all around and reinforce the need for a more vigorous and coordinated support system.
The concept of “continuity of care” (M=2.74) again was cited, along with balancing mixed-age groupings (M=3.04). Global issues of training, expertise, access to space and materials were all cited as concerns. On a more positive note, issues around responsive care regardless of culture, religion, race, and gender were the lowest ranked barriers, yet they still garnered means of 1.48, .98, .80, .78 respectively, suggesting there is still room to grow as a profession in ensuring a bias-free provision of care and education.
Finally, the last cited barriers returned to the theme of time, with barriers around meeting the child’s needs (M=2.38), engaging the families around the intensity of their child’s needs (M=2.36), and being able to properly identify and get the child more supports as needed (M=1.88) all being cited. Figure 14 depicts the comparison of means in descending order.
Required to enroll children I'm not prepared for
Funding needed to meet child's needs
Lack confidence in local school system supports
Unaware of local school system supports
Legal risk
Balancing infants/toddlers and Pre-K
Space to meet needs of child
Behavioral Issues
Continuity of care
Training to meet needs of child
Modifying curriculum
Expertise needed
Time to meet child's needs
Parental concerns
Intensity of family engagement
Same aged peers
Identify if child needs help / supports
Physical play space access
Cultural Issues
Religious Issues
Race Issues
Gender Issues
Table 27 displays the reported Workforce Barriers’ mean values aggregated for all respondents regardless of experience level. The highest rated barrier is “Competition with school system benefits” (M=4.04). As was previously noted during the focus groups, several respondents shared their own contemplation of closing their business and taking teaching positions in the local school system. Similarly, others who had additional personnel or knew FCC providers who had multiple staff reported general challenges with staffing, including a bi-directional “squeeze” – increased minimum wage made other entry-level jobs more attractive cutting off the supply of early career assistants, while potential certified teachers are being recruited by the local school systems who have their own shortages. Several shared they were in fact former teachers, and when they also tried recruiting others like themselves, there’s a perception that FCC is being forced to become more like the public schools they are leaving, and at less competitive compensation packages, so the FCC providers are struggling to appeal to this labor market.
A related barrier that was also discussed during the focus groups is a concern that when hiring a certified teacher, if that individual quits or is absent (M=3.94), it is much harder to replace them, especially quickly, than in a public setting, and the rules under Blueprint are unclear of what the financial consequences would be in that situation on the FCC provider. The theme of time once again surfaced in a variety of ways, including recruitment (M=3.91) and (M=3.78), having too many roles and responsibilities as it is (M=3.67), and trying to balance hiring with the rest of the Blueprint requirements (M=3.90).
Financial concerns, particularly around upfront costs or potentially nonreimbursed costs, also recurred. The notion of cash flow, with payroll being a steady expense yet as previously noted, MSDE reimbursements are perceived as not always timely or consistent, creating an expense-revenue imbalance (M=3.89). There are costs associated with hiring (M=3.71), which the focus group noted fall into the category of non-reimbursable expenses.
Finally, the last major theme centered around logistics, be it understanding and implications of labor laws (M=3.61), general management (M=3.13) and supervision (M=2.84), or an issue that was cited frequently during interviews around zoning inconsistencies (M=3.71). Here, beyond even MSDE licensing, providers reported local housing authorities at times imposing additional regulations that further restrict or contradict whether other personnel could be utilized within the FCC program. When asked how these issues get resolved, providers unanimously stated they have to manage on their own; they do not have a central support resource to escalate to on their behalf. Given the high ranking as a barrier, it clearly is a more significant issue beyond the focus participants. Figure 15 depicts the comparison of means in descending order.
Competition with school system benefits
Certified teacher quits or is absent
Time to recruit personnel
Balancing hiring w/ overall increased Blueprint expectations
Managing personnel expenses vs. enrollment revenues
Finding personnel
Zoning inconsistencies
Cost of recruitment
Too many roles / responsibilities
Labor rules
Logistics of hiring
2nd adult logistics
Supervising concerns
Figure 15. Comparison of Means of Perceived Workforce Barriers
Table 28 displays the reported Grant Application Barriers’ mean values aggregated for all respondents regardless of experience level. The highest rated barrier is “Favor Center based response” (M=3.88). Echoing the sentiments expressed during the focus groups, the majority of survey respondents cited applying for Pre-K expansion funding as difficult because the application is inherently geared towards Centers. Subsequently, a majority of providers report not meeting eligibility requirements (M=3.53).
A theme expressed during the interviews and affirmed in the survey results was a concern with various aspects of the grant process. Be it feeling overwhelmed by the compliance and reporting aspects (M=, 3.08) goal and activity setting (M=2.91), or general lack of confidence in winning or implementing the project (M=3.05), all speak to the undercurrent theme of a lack of centralized support for FCC providers. Clearly the existing support model is not working, as evidenced from the previously noted analyses and interviews, but even here, respondents cite grants as burdensome (M=2.79), challenging to complete (M=2.91), they didn’t understand the requirements (M=2.58), didn’t know anything about it (M=2.08), and could not find help to complete (M=2.38). Add to this the continued theme of lack of time (M=3.00), it reinforces the need for a radically different approach to supporting FCC at-large.
Beyond these barriers, providers noted language access challenges (M=1.02), but also a series of attitudinal barriers: “disagree with the model” (M=2.41), “not interested” (M=2.09), and “not enough funding” (M=1.83). These speak to a larger disengagement concern, rooted in the previously reported distrust expressed throughout the focus groups. Again, this affirms the need to establish a strong coordinating support model that can help bridge the divide between the State and the confederation of independent FCC providers.
Figure 16 depicts the comparison of means in descending order.
Favor Center based response
Didn't meet requirements
Compliance and grant management requirements
Not confident in being able to win or complete if awarded
Not enough time
Worried about goals and activities
Application is cumbersome
Challenges in completing application
Long term financial obligations
Didn't understand requirements
Disagree with the model
Couldn't find help
Not enough background knowledge
Not interested
Didn't know about it
Not enough funding
Not in native language
Figure 16. Comparison of Means of Perceived Grant Application Barriers
Table 29 displays the reported Financial Barriers’ mean values aggregated for all respondents regardless of experience level. The highest rated barrier is “Cost of assistant or substitute” (M=4.56). This is closely followed by “Teacher pay and benefits” (M=4.48), which per Blueprint, is to be comparable to the local school district. As many of the focus group participants noted, they do not earn wages in line with public school teachers or carry benefits. The average FCC provider annual wage was $41,936, compared to the average public school teacher salary of $79,420 (MFN, 2024). As was noted above under workforce barriers, there are concerns over hiring (M=4.36), which needs to happen before enrolling students, and incurring those costs without guaranteeing those revenues will be generated. Similarly, if children disenroll, there is concern that the FCC provider will be obliged for the costs without continued reimbursement for that absent child (M=4.32). Another related aspect was tax implications around payroll and staffing that many FCC providers have never contended with before and reported being intimidated by (M=4.02).
Once again, themes of timeliness of payments from MSDE (M=4.01) and upfront capital emerged (M=4.00), along with the recurringly expressed worry that expenses will be incurred by providers but the state funding will not be sustained (M=3.95). Another category of financial barriers centered around meeting Blueprint requirements, be it doing student teaching which is unpaid (M=4.01), paying for college (M=3.79), or the PRAXIS exams (M=3.56). Lastly, respondents cited overall operating expenses such as modifying the home for students with specific needs (M=3.98), curriculum and materials (M=3.90), recruiting children (M=3.82), and other operating costs (M=3.99). In sum, it reflects the previous points raised about balancing multiple roles and responsibilities and helps explain why burnout was cited as the highest cause for potential attrition from the field. Figure 17 depicts the comparison of means in descending order.
Cost of assistant or substitute
Teacher pay and benefits
Carrying cost of paid teacher without assured enrollments
Covering expenses after disenrollment
Tax implications
Unpaid student teaching
Timeliness of payments
Upfront capital needed
General operational costs
Cost to modify home for disabilities
Sustainability of the state funding
Uncertain enrollments
Costs for home structural and/or curriculum investments
Recruitment costs to find students & screening
Cost of college
Fees for PRAXIS
The following section examines the qualitative and quantitative data related to the perceived supports that would enable greater participation in Pre-K expansion for FCC providers.
Table 30 represents the Meaning Units related to supports that had greater than 50% agreement amongst the sample of participants, reported by consensus rate.
Respondents universally cited the following major recommended supports:
• Moving to an automatic funding disbursement model based on slots following a qualification process without further applications. Participants noted the long discussed electronic attendance reporting system would enable real-time monitoring to ensure the provider is actually serving children, and licensing already knows when the program is open or closed, but this would be a huge stride forward in reduction of burden and producing time savings.
• Participants universally talked about wanting a shared infrastructure. Sometimes they used terminology like “shared services,” a concept many in the early childhood community are familiar with, where several participants noted being part of previous statewide workgroups dedicated to launching a shared service hub, but the common functionality they are seeking is more akin to a school-system. This is a critical point. Unanimously, the focus group respondents want an overarching infrastructure that can manage administrative and operational tasks on their behalf, coordinate communications, even support systems like enrollment, training, and curriculum/materials distribution, but they want to remain independent businesses. In essence, they are seeking to join a management service. This is different than the current industry associations that perform advocacy and general technical assistance, as it would be a more active administration of operations. It is also clear that the majority do not want to become public providers. Falling below the 50% threshold, a minority 9% (n=3) participants espoused a position of having the private care market publicly controlled. Their rationale was to create parity between the systems of resources including compensation and benefits, but the overwhelming majority were opposed to these suggestions. Instead, they seek a dedicated intermediary organization that would in essence function as a “virtual school system” statewide on behalf of independent FCC providers.
• Going along with the school system idea were tangible supports such as a provision of employee benefits to all FCC providers and the creation of substitute pools. The idea being those would be products managed and offered by the “school system” that all FCC providers would be able to access and use, overcoming the barriers inherent in being a confederation of small, independent entities and the current licensing regulations.
• Another idea that extended from this had two interconnected themes. 1) overall waive the student teaching requirement to teach outside of one’s own program; instead allowing credit for being an owner/operator of a
FCC program, utilizing some form of push-in observation mechanism from a supervising teacher; 2) recognizing benefits to observing colleagues’ instruction, and assuming there was an established substitute system and paid-time off, respondents talked about chunked student teaching models wherein they did rotations across the network of FCC providers, so there was always coverage for their program and no loss of revenue as another provider would rotate in, and they would rotate out, all gaining exposure to different environments and still receiving compensation.
• Finally, the last universal themes were around the notion of provider agency –both in terms of improving customer service for all organizations and systems which providers’ rely upon; including timeliness, accuracy, and coordination, which again, were cited as reasons for creating a cohesive “school system” model to help centralize what is currently a fragmented landscape; to ensuring providers have opportunities for their voices to be heard in meaningful ways, not just at townhalls, but in small group policy crafting and review sessions before new requirements are decided.
Grouped in the 90th percentile, providers reported the following:
• Participants coalesced around the theme that many of the burdens they feel are based on meeting demands imposed by the State to demonstrate the quality/efficacy of their programs and practices in ways that are not what families/consumers actually value. Likewise, several felt there were better ways to measure the positive impacts their programs had on the long-term success of enrolled children. A common recommendation was to adopt systems that gave greater weight to consumer input and long-term child performance beyond assessment results (i.e., ideas discussed academic performance, behavioral outcomes, health and wellness, graduation rates) over provider burden models such as program assessments that they argue do not measure actual practice and are not consistently evaluated by the state.
• While the majority desired to remain private, there was an overwhelming consensus to create stronger working relationships with local school systems. Specific suggestions were for shared funding, opportunities to participate in training, and even allowance to utilize local public school substitute personnel and materials. The dissenting opinions to this idea voiced concerns over the logistics coordination, saying they did not have time to make these connections, which often elicited agreement from their peers, so this is a concept that would likely benefit from the above intermediary entity helping to work on behalf of FCC providers to establish stronger connections with respective local schools.
In the 80th percentile, key themes were:
• Providers argued the importance of their work, as evidenced by the critical role they played throughout the pandemic and the investments being made through Blueprint, do not match the compensation they command. They know that is a burden that they cannot pass on to families who they feel already pay too much, yet many describe barely surviving themselves. There was not agreement on the mechanism, but there was commonality around the idea of subsidizing the salaries of providers versus slots. Opponents feared this would lead to unwieldy group sizes like public schools.
• To address the desire to meet the needs of a wide range of children and families, but acknowledging that not every provider is equipped with training, environment, and capacity to meet the needs of all children, there were discussions around a concept of a universal enrollment system, perhaps managed by the “virtual school system,” that would help match a child to the best placement. Providers saw this as larger than just FCC, recognizing the strength of a mixed-delivery system has in leveraging the inherent unique different capabilities of each program type to the range of child profiles. Examples given included a more flexible grouping approach that might have a child with sensory stimulation challenges recommended to a smaller group FCC setting, even for a partial day, but graduating into a partial day larger group Center setting to work on acclimation in a more inclusive environment.
• There was a robust conversation around Maryland engaging its business community to greater degrees in support of the early childhood system. However, this was not coded in the analysis because respondents did not register specific statements in transcripts. Respondents cited states like North Carolina, Minnesota, and Massachusetts that have strong connections with their business sector to help financially support ECEC in recognition that it is critical to their workforce, and there was a consensus opinion that Maryland lags behind its peers in this regard.
• Somewhat related, there was also discussion that there is not enough consideration of FCC as both an educational enterprise and a small business. Respondents noted this in terms of recognizing the demands of both, but also the benefits and contributions that FCC make from each of those perspectives. It was felt that a greater embrace of both of those identities would increase the respect and valuation of FCC.
• In addressing the workforce crisis, and in response to the new requirements under Blueprint, several participants recommended a strategy of focusing on new entrants into the field regarding higher educational and credentialing standards, and intentionally seeking to recruit those candidates from high
school through college tuition programs in exchange for their service. At the same time, they argued that current professionals in the field should be grandfathered in and serve as mentors to the incoming generation. They thought this would help to build a future workforce equipped with the readiness Blueprint requires without creating the attrition crisis that is unfolding now.
• Lastly, there were considerable recommendations around increased supports made available to help the entire child and family. There was a feeling that Pre-K expansion emphasized academics when participants are seeing exponential needs in social-emotional and mental health concerns for children and their families. They described increased financial struggles and families suddenly dealing with addiction and other challenges that they attribute to a rising tide of trauma. The providers described not feeling equipped to meet this need and not having access to resources to support families.
In the 70th percentile, support themes included:
• Providers wanted benefits like public teachers receive in terms of supports from local businesses – discount cards at Walmart and Staples, tax credits for supplies, teacher appreciation days at Dunkin’ Donuts. They noted that for all the talk of being essential to a child’s future, they are often still relegated to perceived babysitters or daycare.
• There was no consensus opinion with regard to Blueprint requirements for degrees and certification. Some respondents wanted to raise the professional qualifications of the workforce, citing that not everyone who became a FCC provider was intrinsically equipped with an understanding of bestpractices in meeting the needs of children, or in running a small business. An alternative recommendation that garnered 71% support was an implemented competency model to measure knowledge, skills, and performance sans degree to ensure those professionals who are not formally educated meet standards of expectations. There was still pushback on this in terms of who defines those competencies, who measures them, with concerns over it being MSDE, and whether that adds more burden.
In the 60th percentile, the final theme was:
• Participants recommended MSDE/decision-makers should come observe FCC providers “in action” in non-compliance visits, but just to understand daily operating realities, typical routines, and quality. This speaks to the previously stated barrier expressed of feeling that “no one understands” how FCC really operates, yet decisions and value judgments are made that directly implicate the livelihood of these individuals.
Overall, the focus groups demonstrate there is an opportunity to bridge the trust deficit by establishing a strong intermediary entity that helps reduce burden on behalf of FCC providers. The community is actively seeking ways to strengthen their contributions and sustainability, and have creative solutions that warrant further investigation, but they feel there is little outlet, or time, to pursue such. Next, these qualitative results are compared to the quantitative findings from the survey.
Independent samples t-tests were used to compare less experienced practitioners (those with less than 10 years of experience, n= 45) to more experienced practitioners (those with more than 10 years of experience, n =76) on dependent measures. For most measures, experience level did not affect perceptions of supports, however, practitioners with less experience (likely younger participants) rated the following supports as significantly more potentially helpful than more experienced practitioners (one-tailed test p values below .07):
• Replace grants – move to a funding form/application
• Offer the application and support information in multiple languages
• Increase awareness of grant opportunities and requirements
• Restructure MSDE payments into advance payments to help with payroll and expenses
• Create a “virtual school system” that supports all of FCC across Maryland by expanding the provider hub mandate in H.B. 1441 into a Hub+ model of a robust and comprehensive support system that reduces operational burden on behalf of FCC programs and helps lower costs
This is displayed in Table 31 by differences in means. It is interesting in that it is the inverse of what was previously seen in terms of utilization of existing supports, suggesting that as new providers are less likely to currently use the existing array of supports, they see greater value in potential suggested support models. As ”multi-lingual information” (M=1.14) was the highest mean difference between experience levels, and the Spanish language version of the survey was completed by 100% of respondents (n=20) with less than 10 years’ experience, this suggests part of the support access gap may be attributed to an increase in non-English speaking FCC providers without a corresponding increase in language accessible resources. Like in the focus groups, there was general high agreement for a “virtual school system” (M=.75). As noted earlier, respondents were able to provide comments on any question, and few were received, but there were four received specific to this –two were part of incomplete surveys, one was part of a respondent who provided
their contact information and requested a follow-up clarification, and one was just a question. Of the two completed surveys, they were attributable to respondents with 10+ years of experience, and all comments sought clarification on what a “virtual school system” meant, with some expressing concern that it would be operated by the local public school. An explanation text was provided with the survey, but this potentially indicates some respondents may not have understood the concept. Still, based on the focus group, and the relatively high response, it is a result worth exploring further.
Table 32. Supports with Significant Differences in Means as a Function of Experience Level
< 10 Years Experience 10+ Years of Experience
Greater awareness of grant applications Virtual school system for FCC Multi-lingual information
Replace grants with applications Advance MSDE payments
Figure 18. Supports with significant differences as a function of experience level.
Table 32 displays the reported Grant Supports’ mean values aggregated for all respondents regardless of experience level. The highest rated support is “Grant writers.” (M=4.27), followed closely by ”Automatic funding model” (M=4.20). This is aligned with the focus group recommendations to shift from an application process altogether in favor of an adopted qualification model that funds qualified slots, which is echoed in the formula funding concept (M=4.00).
Themes of making the application process easier and more supported continued to emerge, with a “Grant help desk” (M=4.17), simplified application language (M=3.86), and overall increased awareness of opportunities (M=4.03) all scoring high.
The concern over funding following the child continues to be raised, with the support recommended for “No penalty for child unenrollment/transfer” (M=3.69). Finally, “Needs based funding” (M=4.13) was a concept discussed during the focus groups where participants noted that not all providers need the same level of support, and some children require additional resources more than others. Figure 19 depicts the comparison of means in descending order.
33. Reported Grant Supports Mean Values
Grant writers
Automatic funding model
Grant help desk
Needs based funding scale
Improved awareness of opportunities
Move to automatic funding formula
Easier to understand language for grant applications
No Penalty for child unenrollment/transfer
Multi-lingual application & supports
Figure 19. Comparison of Means of Perceived Grant Supports
Table 33 displays the reported Education Supports’ mean values aggregated for all respondents regardless of experience level. The highest rated support is “Use their own program for student teaching experience” (M=4.34), followed by “MSDE TEACH Certification Hub” (M=4.29) and “FCC cohorts or degree pathways specific to FCC” (M=4.29). The suggestion to remain in-program for student teaching aligns with ongoing feedback both through the focus groups and more broadly through recent legislative action, so it is not a surprise that is the highest rated recommended support. The MSDE TEACH Certification Hub was surprising in that it also was cited as a barrier, and anecdotally named as a source of frustration during the focus interviews. It did not come up explicitly during interviews as a support, so it is hard to contextualize this finding other than the conceptual model of the Hub makes sense to providers. As was the universal theme of improved customer service/ systems, if concerns were addressed around timeliness and accuracy, the idea of a centralized interface is useful. The FCC cohort was a model that was cited specifically during interviews, with providing noting examples at Harford and Montgomery Community Colleges as exemplar programs. The ASPIRE program from the Family Child Care Alliance of Maryland also received kudos though it was not degree-based. Similarly, many providers spoke highly of the MFN Go FCC model which was also not degree-based but created a cohort approach that helped with a sense of community.
Clustered around a broad concept of trust and transparency, themes of “Confirmation law won’t change education requirements” (M=4.27), “Consistent degree requirements between programs” (M=4.26), and “Comprehensive listing of degree requirements” (M=3.94) all scored above midpoint. This speaks to the aforementioned trust gaps and detailed concerns around inconsistent information and experienced challenges with credit transfers. Similarly, the concept of a “Universal self-assessment” (M=4.24) was mentioned during the focus groups as a uniform way of determining what specific coursework is needed for a given provider to complete toward a degree. This would require articulation agreements across institutions of higher education to implement.
The next broad category represents a focus beyond the degree; with general free courses and trainings (M=4.72), specific technology trainings (M=4.21), and an overall systemic offering of “Alternatives to degrees to prove competency” (M=4.10) all receiving significant selection as desired supports. Ultimately, there’s a sought emphasis on not losing the veteran workforce (M=3.96), which aligns with the focus group recommendation to emphasize recruiting the next generation of FCC at higher standards while creating a balanced approach to maintaining the existing workforce across a continuum of professional pathways. Lastly, again, reflecting the changing demographics of the workforce, the request for more multi-lingual education opportunities was cited (M=3.20). Figure 20 depicts the comparison of means in descending order.
Use their own program for student teaching experience
MSDE TEACH Certification Hub
FCC cohorts or education paths specific to FCC
Confirmation law won't change education requirements
Consistent degree requirements between programs
Universal self-assessment
Access to free / affordable courses & trainings
Free tech workshops
Alternatives to degrees to prove competency
Retain veteran workforce
Comprehensive listing of degree requirements
More opportunities in other languages
Figure 20. Comparison of Means of Perceived Education Supports
Table 34 displays the reported Financial Supports’ mean values aggregated for all respondents regardless of experience level. The highest rated support is “Access to umbrella benefits, including retirement” (M=4.51). This was specifically asked separate from the selection choice: “Provided state income & benefits” (M=4.49). Referring back to the focus interviews, there was universal support for the concept of a crowdsourced, “virtual school system” approach to providing benefits for all FCC that remained privatized. Given the recently passed Maryland H.B. 1441, there’s an opportunity to expand on the concept of support “hubs” and create a “Hub+ model.” This approach would be more comprehensive in scope and scale, enrolling all FCC providers in order to create efficiencies in purchasing power akin to how Local School Systems can negotiate contracts and vendor supplies. Similarly, this would enable more coordinated communication, but most importantly, it would enable the reduction of burden – from administration processes, to creating centralized systems and supports like substitute pools, the major drivers of the attrition crisis would be alleviated by this intervention.
The other recurring idea was to “Pay for slot, not child” (M=4.49), offering providers some consistency in revenue streams. Along those lines, the recommendation to disconnect the Maryland EXCELS rating and licensing status (M=4.17) was also mentioned as a potential threat to operational budgeting. During the focus groups, providers described concerns with the fact that FCC only has one accrediting option: the National Accreditation of Family Child Care (NAFCC). It is perceived to have extensive backlogs and delays that can negatively affect timelines for the FCC provider that impact their Maryland EXCELS rating. Likewise, providers reported concerns over accuracy of evidence reviews or fidelity of licensing inspections that can implicate their rating level, and in turn their funding. This was also an area under the barriers where providers noted an inequity between implications for FCC and public-schools.
Providers sought access to benefits like their public school colleagues such as local vendor discount programs (M=4.35) and tax exemption cards (M=4.34).
The reality is as non-profit organizations, if that’s how they are structured, many of the providers would be eligible to receive a tax exemption card, but this is one more logistic for them to manage atop the “many hats” that was cited as a barrier, and reinforces the benefit of having a centralized support structure. Similarly, not all providers are setup as a non-stock entities, which brings its own set of challenges. The discount program is similarly a model that could be available, and businesses like Kaplan and Lakeshore that cater to early childhood do market their services at a discount, but to get local retailers to participate requires time and effort on behalf of the thousands of FCC providers to establish a recognition program.
The following identified supports: “free business training,” (M=4.24), “Advanced payments from MSDE,” (M=4.21),” Paid PRAXIS preparation and exams,” (M=4.04), and “Stipends for internet,” (M=3.70) all represent supports that are currently available in some capacity. This speaks to the gap in understanding of what resources currently exist, how to access them, and the ease by which providers receive these supports. During the focus interviews, several providers were surprised to learn these supports were currently available, while others acknowledged they were but expressed difficulties in obtaining the resources.
The final theme centered on infrastructure (M=4.24) and operations (M=4.00) funding. Keep in mind the context of the survey was to improve FCC providers’ participation in Pre-K expansion under Blueprint, with approximately 1/3 of respondents stating they were unfamiliar with the requirements of such, but the rest noting familiarity with the Pre-K expansion grants. Those funding solicitations have focused on programmatic delivery for the children, at a per student funding formula. The providers are stating they need access to funds to maintain their existence and make overall structural readiness investments before considering applying for those competitions. Figure 21 depicts the comparison of means in descending order.

Access to umbrella benefits, including retirement
Pay for slot not child
Provided state income & public benefits
State funded curriculum & materials
Discount program to vendors similar to K-12 teachers
Tax exempt cards for purchasing supplies & materials
Free business training
Infrastructure grants
Advanced payments from MSDE
Disconnect enrollment payments from Maryland EXCELS & licensing status
Paid PRAXIS preparation and exams
Fund operational needs
Stipends for internet
Table 35 displays the reported Broad Supports’ mean values aggregated for all respondents regardless of experience level. The highest rated support is “Coordinated supports with school system” (M=4.30). As feeling a lack of support from their local school system was cited as the biggest barrier, this is a logical area of desired improvement. What is not clear from the survey is if the selection of “Managed enrollments” (M=4.18) is reflective of the concept described during the focus groups, wherein a centralized model that looked to match specific children to specific program services across the continuum of ECEC, or if this is more in line with what the survey descriptor text read: “centralized support to look at vacancy and capacity rates to recommend placements to families and referring local school systems.” “Define unique benefits of FCC” (M=4.09) had a descriptor that spoke more to the aim of ensuring FCC was understood for its strengths and not expected to conform to Center and public Pre-K structures, which would create the inherent infrastructure to do the type of continuum matching previously recommended.
The ”Provision of Shared Services” (M=4.00) and “Virtual School System” (M=3.88) have unique but distinct aspects. As noted under the focus group analysis, the concept of a “virtual school system” was unanimously requested in terms of
providers seeking an intermediary entity to manage operations, coordinate with the local education agency and MSDE, support logistics, and ultimately provide supports such as substitutes, training, and financial aspects like creating employment benefit pools. Fundamentally, the virtual school system serves to reduce burden by providing the operational and managerial infrastructure and support that is currently lacking, and the intermediary coordinating services that do not exist for all of FCC. Shared Services would be more tactical infrastructure sharing such as accounting, billing, IT, and HR, functions that could be provided within the auspices of the virtual school system but bridge the divide between FCC operating as schools and small businesses. This serves to reduce costs, and as will be demonstrated in the cost-models, managing expenses is one of the few areas of potential control to try and rebalance an inverted business model for most FCC.
Semi-related, the final broad support requested was public transportation options for Pre-K access (M=3.66). This is a challenge reported across both public and private settings, and in the focus groups providers who expressed concerns with meeting enrollment issues, or maintaining enrollments to ensure funding, noted challenges around parent transportation, which again was reiterated in the cost-models for those programs that have high under-enrollment rates with frequent turn-over of children. Figure 22 depicts the comparison of means in descending order.
Table 36. Reported Broad Supports Mean Values
Coordinated supports with school system
Define unique benefits of FCC Managed enrollments
Provision of Shared Services
Virtual school system
Public transportation
Figure 22. Comparison of Means of Perceived Broad Supports
Providers noted a range of barriers, yet a few core implemented supports would potentially address a significant number of these. Establishing a more centralized support system to manage operational tasks, coordinate resources and supports, and serve as an information liaison between MSDE, local school systems, other support entities, and FCC providers would alleviate a multitude of cited barriers. Shifting funding flow models, and creating greater flexibility along professional pathways would then serve to improve a dramatic number remaining number; all of which were the most highly associated with potential attrition factors from the field. Next, an examination of cost profiles for FCC providers will further reinforce the need for a centralized infrastructure model.
Eight one-on-one cost-model interviews were conducted by invitation of a pool of FCC survey respondents who indicated through that instrument their willingness to participate in these interviews and supplied their contact information and had subsequently been verified as a currently operating FCC provider. Of that sample, 9 distinctive profiles had been defined (see Chapter 3), but ultimately only 8 participants attended their interviews. These interviews were not recorded in accordance with requests from participants, but a standardized interview script was
developed and completed per interviewee and informs these results. There are several high-level findings:
• The average pre-tax gross hourly wage across all profiles was $14.10. The range was an hourly loss of -$4 to $39.57 per hour. On average, respondents worked 65 hours per week with a range of 50 – 70 hours typical per participant. (NOTE – the 50-hour participant was the only respondent with a 3 staff member team).
• Despite concerns expressed by the Advisory Panel and during the Field Test Focus Groups, the providers were knowledgeable about their businesses. There were some observations worth noting aligned to concerns raised by the experts and in interviews:
For some interviewees, additional probing was needed to discern differences between net and gross revenues; specific and general expenses and to ensure such were not double-counted; and particularly to help providers parse out costs at a given age-group of children served.
There is potential risk that the annual Market Rate Survey commissioned by MSDE asking providers to submit tuition costs, demographic surveys conducted by MFN assessing costs that are cited in this report around average salary figures and are utilized in other policy decisions, may be misinformed. In interviewing the providers, it took conversation to ensure their salary was accounted separate from overall revenues, that net profits were reported compared to gross receipts, and this was not a universal convention across the interviewees. By constructing the profiles through an interview format where both interviewer and participant could ask questions to clarify meaning, and share screen to look at information, there is confidence in these calculations. Otherwise, to the point raised by the Advisory Panel and validated during both Focus Groups and in the Cost Model interviews directly, self-reported financial data may not be comparable from one provider to the next, and potentially conflating personal earnings with business earnings for FCC providers in some cases.
• Seven of the eight participants underperformed their annual tuition goals, by every age group, with the eighth having an exact match of forecasted and earned, which raised the question of how that process was being conducted. The average rate of underperformance was 20%, with a range of 10% - 50% under projections. This reflected a delta of forecasted revenue range from $5,960 to $83,200, with an average underperformance in forecasted tuition revenues of $23,549.43.
• The average annual tuition charges by age group were:
Infants: $14,046.67; Range = $9,100 - $19,200
Toddlers: $12,188.57; Range = $7,800 - $19,200
Pre-K: $12,600.00; Range = $7,800 - $19,200
Before/After School-Age Care: $6,613; Range = $3,900 - $9,100
• 3 out of 8 use a sliding fee scale for tuition based on family economic need; though the criteria were subjective in 2 cases, with the remainder citing the Maryland Child Care Scholarship program as their modified fee structure.
• Interviewees represented different program sizes in terms of FCC and Large FCC, child enrollments and goals, but on average, the level of underenrollment for their given targeted age-groups were:
Infants: 72.86%; Range = 50% - 100%, Mode 90%
Toddlers: 84.29%; Range = 50% - 100%, Mode 90%
Pre-K: Range: 68.21%; Range = 0% - 100%, Mode 100%
School-Age: 50%; Range = 0% - 100%, Mode N/A (0%, 50%, 100%)
• While several providers reported having waitlists with the ability to fill immediate vacancies for certain age groups, the average length of time to fill a slot across all ages was 4.75 weeks. By specific ages:
Infants: 6.3 weeks
Toddlers: 5.8 weeks
Pre-K: 6.4 weeks
School-Age: Less than a week
• Only 37.5% use a Child Care Management Software system to support their program operation and administration.
• 50% use professional bookkeeping and tax services, though none could attribute tax expenses specific to their business.
• None of the sample provided any form of benefits to themselves or employees.
• Half the sample was established as a limited liability corporation (LLC) while the other half were sole proprietorship. One of the LLCs was established as a public non-stock entity eligible as a nonprofit public tax-exempt organization.
• Across all interviewees, the group is only relying on a total of $22,580 supplemental revenues from sources like grants and the Child and Adult Care Food Program.
• The average total gross revenues were $99,221.75 per program. The range was $45,760 to $230,400.
• The average yearly expenses per program were $48,821. The range was $9,410 to $125,500.
• The average annual net business pre-tax business revenue was $44,683.06 per program. The range was an operating loss of -$15,030 to $102,876.67.
Each respondent’s information will be presented as a unique profile, followed by an overall interpretation of results. A few notes for interpretation. Actual Enrollment refers to the number of children enrolled at the time of the interview. Enrollment Goal refers to the target level of enrollment by age group the program seeks. Under Enrollment Level is the calculation of the vacancy rates the program reported in the difficulty in achieving and maintaining continuous enrollment at their goal level.
Gross Tuition is the calculated value of the projected enrollment level for the year as a product of enrollment by tuition costs, validated by the previous year’s performance, in consideration of the participant’s reported rate of disenrollment and vacancy to fill length. Total Tuition Goal is the calculated product of the tuition cost by targeted enrollment goals, with % of Goal Attainment being the proportion of difference between the gross and goal tuition values. Remaining fields are more self-evident.
Under Enrollment Level: 25%
Vacancy to Fill Length: Avg. 2 months for Toddlers
General Expenses
Staff Expenses (i.e. salary, benefits, training, schooling, certification, etc.):
$120 (note: most owner operators take pay from net profits without drawing salary)
Marketing & Family Engagement: $350
Child-Specific Expenses
Business Services (i.e. payroll, tax services, administrative software, etc.): $0
Technology (i.e. hardware, teaching software/tools, websites, etc.): $300
General Overhead (i.e. rent/ mortgage, utilities, modifications, fees, etc.):
$23,676.00
Other (including insurance, interest on loans, cleaning supplies/consumables, etc.): $3,120
Infants: $380 Toddlers: $500
Expenses: $27,566.00
Profile 2: FCC, Suburban, Mixed Age Enrollment, Not Leaving Field, 3-10 Years of Experience
Program Description
Size: 8 children
Under Enrollment Level: 10%
Vacancy to Fill Length: Avg. 4 weeks
Workforce
Revenues
Gross Tuition:
$138,960.00
Staff Expenses (i.e. salary, benefits, training, schooling, certification, etc.):
$40,800
Marketing & Family Engagement: $480
Child-Specific Expenses
Actual Enrollment: Infants – 1
Toddlers – 2
Pre-K - 3
Enrollment Goal: Infants – 2 Toddlers – 3 Pre-K – 3
Tuition:
Infants - $16,200
Toddlers - $16,200 Pre-K - $14,300
School-Aged - $9,100
Maryland EXCELS Rated: Yes, Level 5
Business Structure: LLC, For-profit
NAFCC Accredited: Yes
Degreed: Yes, Lead Certified: No
Sliding-Fee Scale: Yes Other Revenues: $0 Small Business Loans: No
Business Services (i.e. payroll, tax services, administrative software, etc.): $1,216.00
Other (including insurance, interest on loans, cleaning supplies/consumables, etc.): $12,200
Technology (i.e. hardware, teaching software/tools, websites, etc.): $1,800.00
Child and Adult Care Food Program: Yes - $9,480.00
General Overhead (i.e. rent/ mortgage, utilities, modifications, fees, etc.): $19,028
$75,524.00
Infants: $1,300 Toddlers: $1,300 Pre-K: $1,155 School-Age: N/A Total Child Specific Expenses: $3,755.00 Total Expenses: $79,279
Staff Expenses (i.e. salary, benefits, training, schooling, certification, etc.): $500.00 Business Services (i.e. payroll, tax services, administrative software, etc.): $95.00 Technology (i.e. hardware, teaching software/tools, websites, etc.): $0 General Overhead (i.e. rent/ mortgage, utilities, modifications, fees, etc.): $7,600.00 Marketing & Family Engagement: $515.00
(including insurance, interest on loans, cleaning supplies/consumables, etc.): $700.00
$21,400.00 Business Services (i.e. payroll, tax services, administrative software, etc.): $900.00
$2,000.00
(including insurance, interest on loans, cleaning supplies/consumables, etc.): $10,500.00
(i.e. hardware, teaching software/tools, websites, etc.):
$5,000.00
rent/ mortgage, utilities, modifications, fees, etc.):
$30,000.00
Program Description Size: 12 children
Under Enrollment Level: 10% Infants and Toddlers; 25% Pre-K; 50% School-Age
Vacancy to Fill Length: Avg. 1 week
–2
Business Structure: Sole proprietorship
Staff Expenses (i.e. salary, benefits, training, schooling, certification, etc.): $21,000.00 Business Services (i.e. payroll, tax services, administrative software, etc.): $700.00 Technology (i.e. hardware, teaching software/tools, websites, etc.): $1,000.00
Overhead (i.e. rent/ mortgage, utilities, modifications, fees, etc.): $10,900.00 Marketing & Family Engagement: $2,000.00
(including insurance, interest on loans, cleaning supplies/consumables, etc.): $3,900.00
$5,500.00
Staff Expenses (i.e.
benefits, training, schooling, certification, etc.): $300.00 Business Services (i.e. payroll, tax services, administrative software, etc.): $0
(i.e. hardware, teaching software/tools, websites, etc.): $1,100.00
Overhead (i.e. rent/ mortgage, utilities, modifications, fees, etc.): $15,824.00 Marketing & Family Engagement: $624.00
General Expenses
Staff Expenses (i.e. salary, benefits, training, schooling, certification, etc.):
$88,000.00
Marketing & Family Engagement:
$2,400.00
Business Services (i.e. payroll, tax services, administrative software, etc.):
$2,300.00
Other (including insurance, interest on loans, cleaning supplies/consumables, etc.): $5,650.00
Technology (i.e. hardware, teaching software/tools, websites, etc.):
$1,000.00
General Overhead (i.e. rent/ mortgage, utilities, modifications, fees, etc.):
$26,150.00
Expenses: $127,523.33
Table 36 summarizes the demographic characteristics of the cost-model profiles. The group was split evenly between FCC and Large FCC, with one profile having recently transitioned from a regular to a large FCC operation. Profiles 4, 5, 7, and 8 are Large Family FCC and will be noted with L. Two programs represented Maryland urban areas, two rural areas, and the remaining six from suburban areas. Each program came from a different Maryland county/jurisdiction. Two profiles represented 1-3 years of experience, with three programs each in the categories of 3-10 and 10+ years. Half the group served mixed-ages, with the majority inclusive of infants, toddlers, and preschoolers. One profile (#3) only served Pre-K, while the remaining two only enrolled infants and toddlers. Lastly, half the group indicated they were or may be leaving the field within three years from the original survey. That question was not specifically followed-up on in this interview. As the conversation was already dealing with sensitive information and as previously noted, there was a trust deficit between providers and MSDE, and that extended to the research team initially, it was felt that probing on a topic that had deep emotional associations might confound the requested detailed personal financial information being sought. Instead, what can be reported is all four included profiles here had previously indicated “Burnout” as the top reason for potentially exiting the field.
Table 37 summarizes the enrollments of each profile by actual at time of interview and the program’s goal. As will be discussed further, under-enrollment is a key determinant in financial viability and reinforces the cited barrier and support by providers of children disenrolling and subsequent managed systems policies to address revenue implications of such. The programs with the highest under-enrollment levels – Profiles 3 (37.5%) and 4L (50%) are at other high-risk conditions for FCC providers. Profile 3 is serving an exclusive age-group (Pre-K), limiting enrollment replacement selection when children exit. Profile 4L is in a rural area, which as noted in
Chapters 1 and 2, has seen greater declines both in Maryland and nationally for FCC in part due to challenges with recruitment. Table 38. Summary Enrollment Comparison of Actual Versus Goal by Profile
The relationship between maintaining steady and consistent enrollment and revenue is intractable. Concerns over payments following the child and not the slot were a driving barrier cited repeatedly throughout the survey and focus groups, and requests for managed enrollment systems and guaranteed payments for slots were top rated requested supports. As is seen in Table 38, the summary of tuition charges by age-group across the profiles, summed to the actual generated gross tuition compared to the goal, and what the percentage difference between goal and achievement was, shows those profiles with the lowest under-enrollment levels were significantly more likely to achieve more of their tuition goals. Profiles 8L, 2, 7L, and 6 have the four lowest under-enrollment rates in respective order of 0%, 10%, 20% and 20%. Their corresponding attainment of their tuition goals were 100%, 90%, 87.2%, and 80% respectively.
While not specific to the scope of this examination, the range of tuition charges warrants further review, with infant care at the low end reflected at $9,100 in an urban and suburban area, and $19,200 in an affluent suburb. That profile charges a consistent
rate for all ages, has wait lists, and zero under-enrollment. Implications of Pre-K tuition on Pre-K expansion participation by FCC will be discussed in the upcoming analysis. Specific tuition rates were not compared to the surrounding marketplace, but rates were compared to the published average statewide FCC rates for infant care ($13,908) and toddler/Pre-K ($12,093.12).118 In table 38, cells highlighted in green are at or below the average. Cells highlighted in red exceed the average. A published average schoolage tuition figure was not available. 50% of profiles exceeded the average in their infant tuitions. 28.6% exceeded the average for toddler tuition. 50% exceeded the average for Pre-K tuition.
= Exceeds State Average FCC tuition for Infant ($13,908) or Toddler/Pre-K ($12,093)
=Below State Average FCC Tuition for Infant or Toddler/Pre-K
Table 39 depicts the pre-tax net revenues for each profile, along with the reported number of hours worked per week, and computed pre-tax hourly wage based on net revenue. Next, an estimated tax assessment was calculated. As a tax obligation is highly variable, and as was revealed during interviews none of the FCC participants could or would share specifics about past or projected personal tax implications for their businesses, a standardized approach for this computation was used. A free online tool through the tax filing service, Embroker, was utilized to calculate total federal and state taxes as a Maryland LLC, filing single head of household, based on total net revenue. The research team recognizes in reality, individual circumstances, deductions, and facts like Profile 6 is established as a nonprofit entity within Maryland entitled to additional credits, would impact these
numbers in real-life, and as small businesses, losses can offset tax obligations for example in Profile 4L, but for the purpose of modeling, using the LLC as the base structure and filing single allowed the estimation of a high-end obligation. In the rest of the table, the adjusted post-tax earnings are noted, with then a recalculated net income and post-tax hourly wage. It is worth noting none of the profiles paid themselves or employees benefits.
Maryland minimum wage is $15 per hour as of January 1, 2024. Only Profiles 2, 7L, and 8L exceeded this rate. The 2024 federal poverty income level (FPL) for an individual is $15,060 net earnings. Profile 4L, running a deficit of just over $15,000 is at that criterion. Profiles 1, 5L, and 6 would meet the definition for Asset Limited, Income Constrained, Employed (ALICE), published at $36,420 for Maryland where above FPL but not at a sustainable, livable income.119 Profile 3 becomes ALICE qualified in the tax adjusted calculation, though again, there are caveats to the reliability of that estimate. In total, 50% of the profiles are economically struggling, even when three out of four of them are profitable. In fact, Profile 1 is achieving 87.2% of its tuition goals, is charging about the state average rate for infant care, a little below average toddler, but as an urban provider may be conforming to market allowance and is the only Profile that stated affirmatively they were leaving the field for burnout reasons. This analysis can offer insight into that rationale, as even at 100% of the tuition goal, it would not offset the expenses to raise above the ALICE threshold, and if any of the providers are raising their own families on their incomes, the FPL and ALICE thresholds get more perilous, making FCC a very difficult professional path without reducing both burden and expenses.
Table 40 summarizes operating expenses by profile and category. Profiles 2, 4L, 5L, all have two staff, and 8L has three. Staffing costs can include pay directly to assistants or additional teachers, substitutes, training, college coursework, and certification. As noted, none of the participants offered any form of benefits, and none drew direct salaries themselves, but claimed business profits as income. Business services included professional services such as payroll and accounting, tax services, and also child-management software. This is another area where the lack of a centralized support system for FCC is a detriment. Three out of eight profiles used a child-management software system to assist with enrollment, billing, attendance tracking and other operational logistics. Two of the providers used the same vendor product, were the same size programs, but were paying vastly different annual licenses. The lack of a bulk buying power and broker on behalf of the FCC sector at large as is in effect with school-systems and other franchises causes inequities. Those fluctuations in expense points are variables that are critical to helping shape the viability of FCC when cases like Profile 1 are performing close to peak for enrollment, but still not yielding enough sustainable revenues. All profiles mentioned buying in bulk at consumable product levels to try and control costs and noted the impacts of inflation on their bottom-lines, but they are not receiving the benefits of that at specialized purchases.
Technology includes software and hardware used for instruction, website fees for advertising, and related costs. Marketing and family engagement are specific advertising, recruiting, and community-based activity costs. As will be shown in Table 41, programs that invested higher here had better under-enrollment rates and ultimate tuition revenues. General overhead included items like rent, mortgage, and utility costs, with this representing the bulk of expense for most programs beyond those with multiple staff members. Finally, in the other category, insurance, interest on loans, consumables such as cleaning and office supplies, other disposable products, and anything that was general use that could not be attributed to specific age-groups was categorized here. Noting again the challenge of FCC operating dually as a business and an educational entity, and noting the concerns raised throughout the survey and focus groups about the difficulties in wearing “too many hats” and trying to effectively perform both of those roles concurrently while meeting the needs of children, it is worth noting that the highest staffed profile, 8L, which also has the overall highest operating expense, has the better operating performance metrics in terms of 0% under-enrollment and 100% tuition goal attainment, so they are maximizing profitability. They significantly exceed the statewide market rate for their tuition, a fact potentially only made possible by their affluent suburb location, and an advantage not shared by most of their peers. In the end, as is seen in Table 41, they generate the highest overall tuition at $230,400. This is juxtaposed with Profile 4L, running an overall revenue loss of -$15,030. They exceed Profile 8L’s technology costs by 5 times.
They are a quarter of the staff costs with two personnel compared to the three, and spend nearly a third less in business services. Their general overhead is higher than Profile 8 and their Other costs are nearly double. Both are Large FCC, but Profile 4L is located in a rural area. They charge the second highest infant tuition rate, almost comparable to Profile 8L, and slightly exceed the state average for Pre-K while being a little below for toddlers. Profile 4L is significantly challenged in under-enrollment and their vacancy-to-fill length. Table 41 summarizes operating outcomes data for each profile and calculates spending ratios based on associated expense categories. What this demonstrates, as is illustrative in the difference between Profiles 4L and 8L, is it is not only a question of helping FCC reduce their expenses, but also where to better maximize their investments to optimize performance outcomes. Both Profiles 4L and 8L are charging roughly equivalent infant rates. Assuming both have based those on knowledge of their local market tolerance, and 4L has filled half their targeted slots so their tuition rates are in alignment with those clients expectations, then another factor to examine is operational efficiency. Profile 8L has invested in areas that maximize operational efficiencies in improving staffing to reduce workload burden. Profile 8L had the lowest worked hours per week of any program; business services to strengthen billing, communications, enrollment management; and marketing to maintain their pipeline supply. Profile 4L was similar in marketing but underspent in the other categories, and put more emphasis in categories that may not be generating as much value. Those may be out of necessity, and to be clear, this analysis did not examine supply and demand trends by each Profile’s location which could equally explain challenges in under-enrollment.
Additionally in Table 41, a profit margin was calculated by dividing the generated tuition profit level beyond total operating expenses by the total generated tuition. The calculated operating profit margin does not account for total expenses and revenues, just looks at operating related expenses sans child specific costs to
specifically examine FCC as a small business. This was done as profit margins are not an aspect considered for schools, but a starting point for any business enterprise, and reveals the tension in the duality of being a FCC operator. A 10% profit margin, the net balance of earned revenues above expenses, is considered a good target for most businesses, with 20-30% being exemplary. The research team began with a profit margin calculation based on an adjusted net income post-tax because it demonstrates a fundamental caution in utilizing traditional business modeling criteria for evaluating FCC viability. For all profiles except 4L which is operating at a loss, the margin of expense to profit is exceedingly high, except the actual financial performance outcomes are dismal as was shown in Table 39. Only three operators would be above the state minimum wage, even while technically showing a high profitability margin. What this demonstrates is FCC cannot operate on traditional principals of business structures, but rather needs an operational structure that is more akin to how society supports public schooling while maintaining the flexibility to respond to local consumer needs that is the strength of FCC.
Table 42 summarizes the child-specific expenses incurred by each program. These expenses represent direct annual investments spent specifically on children in a given group. These include diapers for infants, instructional materials for preschoolers, or snacks for all ages. This also includes specific curriculum license costs and is the explanation for the increased costs for Profile 4L’s toddlers. This is another area where having a centralized intermediary organization would be beneficial for FCC providers to negotiate network wide licensing. As it is, the curriculum costs Profile 4L is using is almost equal to the entirety of their generated toddler enrollment. This is in part because they are 50% below their anticipated enrollment at that age-group. In total, both the revenue and expense realities bring forth questions around other ways FCC could improve their revenue outlook and minimize their
operational risks. The next section will examine FCC overall business structures and Blueprint readiness.
Half the profiles are LLCs, with one being a non-stock entity, the precursor registration in Maryland to being a 501c(3) non-profit organization recognized by the IRS. A business entity can register as a non-stock LLC and never file as a 501, and still receive certain tax benefits, and operate as a not-for-profit entity. The remainder of the participants are sole proprietorships. These business structures carry inherent risk for the business owner as there is not a division between business and personal assets in case of liability. Insurance policies can help mitigate this risk, but in looking at insurance costs for the profiles structured as sole proprietorships, their costs are neither greater than their peers, suggesting there is not higher coverage. Another aspect that was examined was the degree to which the participants utilized their status as small businesses to access funding from the small business administration (SBA) or other small business exclusive funding. Only one of the eight had taken advantage of this. Another benefit of registering as a LLC is increased access to capital markets and other funding sources. The Child and Adult Care Food Program (CACFP) is a state administered portion of the federal program, recommended as part of Maryland EXCELS, and provides additional funding for participating programs. Three of the providers participated in CACFP, generating over $18,000 in combined additional funding for their programs. The Maryland EXCELS bonuses are a scaled payment for any Maryland EXCELS participant that does the following between July 1, 2023 and June 30, 2024:
• Publish any quality rating for the first time
• Re-publish a quality rating 4 or 5
Two programs did this for a combined additional $3,000 in revenue. Finally, 3 programs use a sliding-fee scale to determine tuition based on a family’s income. It is interesting to note that these programs rounded out the top 4 best attainments of their tuition goals behind Profile 8L’s 100% with Profile 2 at 90%, Profile 1 at 87.2%, and Profile 3 at 80%. By extension, these programs had under-enrollment rates in the lowest quartile (25%, 10%, and 20% respectively). Early childhood business expert, Louise Stoney, describes her foundational model for solvent child care business operations as the “Iron Triangle” comprised of three components: full enrollment, revenues cover per child cost, and full-fee collection.120 As depicted in Table 42, tuition revenues exceed child-specific expenses for all profiles, but overall expenses do not for Profile 4L which is running a deficit, and even then as previously noted, the profitability is coming at the cost of burnout which is fueling the attrition epidemic plaguing FCC in particular. To Stoney’s point, and validated in the cited barriers and requested supports throughout the survey and focus groups, the providers that perform strongest are able to maintain continuous enrollment supply, control costs and manage business operations efficiently while delivering on the quality of their implemented program. That is almost Herculean to expect a predominant singularly operated industry to perform, particularly when many competing factors are working against the FCC provider. While Blueprint offers a potential infusion of funding, the reality is many FCC providers are neither interested in pursuing, nor are they ready to meet the qualification. An examination of that follows.
The Pre-K Expansion grant competition was awarding 60 grants for FY25 to Maryland ECEC programs serving Pre-K children in Tier I status, with the State paying $13,000 per child served. For a FCC provider, eligibility criteria included: 120 Stoney 2019
• Published at Maryland EXCELS Level 5 with a plan to maintain this level;
• Publish at level Maryland EXCELS Level 4 with a plan to achieve Level 5 within 5 years;
• Published at Maryland EXCELS Level 3 with a plan to achieve Level 5 within five years;
• Located in area of the State that have an unmet need for prekindergarten services;
• Include parental/guardian engagement and educational activities beyond the classroom;
• Clear goals and outcomes that demonstrate how the program will provide an educational program and meet the requirements of the grant;
• A description of how the income verification forms and family-provided documents will be collected and maintained on-site. The income eligibility criteria are based on the Federal Poverty Levels (FPL);
• A plan for how the needs of students with disabilities, students experiencing homelessness, and students who speak a home language other than English will be met;
• A description of the program’s family engagement strategies in accordance with the Maryland Early Childhood Family Engagement Framework;
• A description of the professional learning activities for instructional staff (teacher and assistant) that consist of 15 total of hours and support school readiness, including alignment with the Maryland Early Learning Standards in early language and literacy, the science of reading, early mathematics and social foundations;
• Identified community partners and specific roles as they relate to the program;
• A qualified individual in Key Personnel listed as responsible for instructional oversight, and whose resume demonstrates their qualification to do so;
• All lead teachers in prekindergarten classrooms must hold a bachelor’s degree. If a teacher has not been identified by the date of the proposal submission, a job announcement must be included that demonstrates education requirement and salary;
• A Director cannot be regarded as the teacher unless he or she is working in the classroom full-time for the 6.5-hour instructional day;
• Lead teachers who have their teaching certificate must be paid a salary commensurate with the LEA in the respective county;
• For classrooms with more than 10 students, there must be an Assistant Teacher who holds a minimum of a high school diploma;
• At least one meal per day must be provided. It’s recommended that meals served meet the Child and Adult Care Food Program (CACFP) requirements, but not required;
• All grant requirements must be met prior to the start of the grant year;
• Lead Teachers must be hired by July 1, 2024, in order to avoid a disruption in grant funds;
• Invoices will not be paid unless all grant requirements have been met.
Table 44 lists key Pre-K Expansion readiness factors per criteria above from the MSDE released grant application. None of the profiles had submitted a Pre-K expansion grant; Profile 2 had considered submitting last fiscal year but found the process too onerous and decided not to. Profile 2 is the only one currently to meet eligibility for Pre-K expansion, but as they noted, the added burden of administration, management, compliance and reporting was too demanding in addition to concerns over cash-flow and reimbursements. Likewise, when asked about submission for this

fiscal year, the $13,000 state reimbursement was below Profile 2’s established tuition. The state Tier I reimbursement rate was below the established Pre-K tuition for 50% of profiles. Profiles 1 and 6 do not currently serve preschool aged children, and indicated they had no interest in expansion to that age group, with Profile 1 noting their planned exit from the field. Of the remaining six profiles, only 3 met Pre-K Expansion eligibility for the Maryland EXCELS requirement by being quality rated level 3 or higher, with Profiles 2, 3 and 7L all above that mark. Of those, Profiles 2 and 7L then met the subsequent lead teacher degree and certification requirements. Profile 5L is in process through a university program, but will need to increase their Maryland EXCELS rating, including obtaining NAFCC accreditation. This is the same requirement for Profile 8L.
Additionally, and somewhat related as a barrier to accreditation, programs noted concerns around the Pre-K Expansion requirement to “A plan for how the needs of students with disabilities, students experiencing homelessness, and students who speak a home language other than English will be met.” Several noted the need for infrastructure grants or other funding sources to make structural modifications to their homes for ramps, doorway improvements, changing tables and other accommodations to ensure accessibility for children with physical disabilities, as well as investing in materials and training to support children with behavioral, cognitive, and emotional needs. Going back to the cited barriers, FCC providers do not feel they can rely on the local school systems for supports in these situations.
Foundationally, what is revealed, and is further strengthened across the previously shared data around the landscape of FCC in Maryland, is the reality that FCC is critical to families and the broader early care and education supply for the state, but it is a unique entity in both business and programmatic needs and purpose. It has a critical role to play, particular to many children who benefit from small group,
mixed-age environments, in settings that allow for focus on more unconstrained naturalistic skill development, but FCC providers need overarching operational and business structure supports to reduce burden and maximize efficiencies. There needs to be a systemic matching model to reduce under-enrollments and better match children to programs across the spectrum of ECEC based on child and family needs and program specialization and capacity. Additionally, there needs to be a recognition of the uniqueness of FCC without imposing requirements that are inherently unrealistic or inequitable. To validate these conclusions, a small focus group of established state leaders was conducted to gather their insights and opinions.
Five individual interviews were conducted with key leaders from the early care and education field. Three of the five interviewees had direct experience as FCC providers during their careers. All were currently in positions of statewide influence; all with their work affecting FCC at least, three where theirs extended to the rest of early childhood. Leaders were asked the same barriers and support questions as the focus group participants, and then asked their opinions on broad themes that were emerging for corroboration or redirection. All leaders agreed on the following:
• A need for centralized support infrastructure for FCC to assist with operations and management, reduce burden, liaison with MSDE and schools, and help negotiate costs and other logistics
• FCC is unique from the rest of the ECEC continuum and that should be a strength and not a forced conformation; and that the loss of FCC will have significant implications for overall supply of slots across all ages and particularly for more vulnerable populations and communities
• The work load of being a FCC provider is unsustainable and contributory to the burnout rates being seen
• Maryland needs a mixed-delivery system – and that public schools should not and are not equipped to be the only provider of public Pre-K
• There is a trust deficit between MSDE and FCC (note – this was stated to apply to all private care – and should be noted was conducted under the previous MSDE leadership)
There was consensus among the leaders who had previously been FCC providers on the following:
• Degree requirements should not be the only measure of professional competence, and alternative competency indicators should be developed
• FCC should not adhere to the standard curriculum of public preschool –that in fact a focus on social foundational readiness is more important than academic skill development
• That FCC providers should not be mandated to accept every child in the same way public schools are
While there was general agreement about the challenges of the financial model for being a FCC provider, there was not consensus around a specific solution (i.e. state subsidization, public take-over, pay for slots, etc.). Different leaders voiced pros and cons of varying approaches, worrying about sustainability of different models, implications on other aspects of budgets, and generally, there was a broader based concern over the entire future of public funding given the uncertainty of how to sustain Blueprint at its current requirements before adding in further commitments.
Finally, one leader made this observation that was a poignant summation: “it really comes down to what we value. Family child care are both small business, almost entirely women owned and run, serving some of our neediest communities. The research shows they can produce remarkable outcomes for children, but if we keep imposing a one-size fits all approach, and don’t make investments to help support these businesses to do their business of educating – are we really surprised when they keep failing? We have an opportunity to radically rethink how we approach early childhood. The question is will we?”
“The
research shows they can produce remarkable outcomes for children,
but if we
keep imposing a one-size fits all approach,
and don’t
make investments to help support these businesses to do their business of educating – are we really surprised when they keep failing? ”
The study highlighted several key findings. The most alarming is that there is a significant risk of the continued loss of Maryland’s FCC supply that disproportionately impacts children of color, families in rural areas and locations already underserved by child care, and children with developmental and socio-economic needs. FCC providers are challenged by a lack of a centralized coordinating entity. While private small businesses, because of their regulated environment, their business models are not free to normal market behaviors, yet their service is critically important to society.
Providers cited a feeling of burden and sense of burnout as top drivers for their potential for leaving the profession in the next three years. While the Blueprint for Maryland’s Future has brought an unprecedented focus on the importance of early childhood, there was a clear consensus amongst study participants that the challenges of meeting the requirements of Blueprint with regard to Pre-K expansion outweighed the benefits to FCC providers. Looking across requisite criteria to participate in Pre-K expansion, only 20.5% (n= 433) of the 2,094 FCC providers with a quality rating in Maryland EXCELS as of March 2024 would be eligible to apply for the grant. That’s purely based on being at least a level 3 within Maryland EXCELS. Whether the programs have their NAFCC accreditation and staff who are degreed and credentialed is less clearly determined based on public data. From the survey and focus groups, these are barriers for the field. These challenges are exacerbated by the realities of operating a FCC. The hours are long – on average at least 65 hours per week, and typically a single individual serving every role – from care giver and teacher to administrator and business manager. A common sentiment shared during focus groups was a lack of time to engage in more requirements; challenges in balancing work and life; and an overall feeling of being pulled in too many directions.
A theme that emerged was the need to improve the feeling of connection and support FCC providers have with both MSDE and the broader community of assisting entities. It is worth noting that since data collection, there has been leadership change across MSDE, and a number of new policy, practice, and legislative actions have gone into effect that are specifically addressing several of the concerns expressed by FCC providers. From a climate perspective, the new MSDE leadership has publicly expressed positions that study respondents advocated for in terms of having their voices heard before policy decisions were finalized. Still, this study reinforced longstanding areas of challenge in terms of ensuring consistent communication, shared ownership between providers and policymakers, and reliable information across
the network of partners who provide technical assistance. The study reinforced the changing demographics of the FCC community, supporting the need for multilingual information and resources and proactive outreach to those communities. Likewise, while providers spoke of their perceptions of distrust or experiences of receiving misaligned information, there were several occasions during interviews where participants cited incorrect information. As peers were rated as a high-source of where providers turn to for information, ensuring accuracy and reliability of information is vital, as well as shifting the overall culture to a collaborative mindset.
Of course, part of the challenge in the information flow that was reinforced in the cost-modeling exercise goes back to the FCC business model. As was revealed, many providers are functioning below a livable wage. Trying to maintain that level of operations and program excellence, when the margins are so tight, leaves little time to engage in the other aspects of professionalization like networking and professional associations. It is why support systems such as ASPIRE, Maryland EXCELS program coordinator/Quality Assurance Specialists, and licensing specialists were statistically more associated with greater awareness about Blueprint than other support sources. These initiatives have been more ingrained within the providers’ daily operations, making them more naturalistic. There’s a body of literature that supports this notion of job embedded supports, and it is interesting to see that even in a highly individualized field like FCC, analogs still emerge.
Ultimately, what was evident through the cost-models was programs that are able to maintain lower turnover in enrollment, and faster replacements when children exit, perform financially stronger than their peers. Unfortunately, this was the minority of programs in the sample, and it explains why so many providers voiced concerns over state payments following the child and not the slot, as they experience so much transition with any given family throughout the year. That dependability of revenues offsets the risk of incurred costs providers are facing as they consider other Blueprint requirements such as paying comparable salaries and benefits. It also became clear that whereas public schools have the power of volume and centralized purchasing to both negotiate and monitor costs, FCC is being penalized in this area. Not only does purchasing goods and services add to the administrative burden, but there were several examples of discrepant costs for the same products and services across providers. Likewise, there are missed opportunity costs such as lack of substitute pools or shared employee benefits – none of the providers in the cost-models, even those who were significantly profitable, offered benefits – that could be achieved through a more cohesive and coordinated approach.
In total, Maryland’s FCC providers are dedicated and passionate. It is a mixed profession caught in the throes of change, but some of the changes being required have a risk of disrupting the supply of child care and early education across the entire age continuum. What follows next are a series of recommendations based on these findings.
The following recommendations are derived from findings from this study, draw upon the broader literature review, build upon recent legislative efforts and the research team’s expertise. Each recommendation is accompanied by an implementation rationale. In total, the authors present seven recommendations.
# Recommendation Rationale
1 Develop a continuum-wide definition by program-type of the unique benefits and focus of each type of child care/ early education program within Maryland mixed delivery system.
2 Implement a “Hub+ Model” akin to a “Virtual School System”
While seemingly a simple recommendation, this is fundamentally the most critical, as it establishes the conceptual framework for recognizing the unique attributes of each type of program within Maryland’s early care and education model. Currently, the emphasis within policy is toward conformity of practices, standards, and personnel. As was described in the presented background research, FCC, with its smaller size, mixed ages, and more natural home-like setting, has been shown to produce stronger results in key domains for certain children. In the ideal system, the strengths of each program type would be defined with recommended profiles of children who would maximize benefit through attendance for full or part time enrollment.
The overarching challenge that needs to be solved for FCC is the competing balance between being a small business and a critical part of the care and educational system. In the latter, FCC plays a vital role to our economy – enabling employees, particularly, women, to return to the workforce, where Maryland has lagged our peer states.
Turning FCC into public programs is not feasible nor sustainable or desired by the majority of the field, but there is a hybrid approach. Implementing an intermediary entity that serves as a coordinating agency. Maryland already utilizes this model for its resource and referral network, with Maryland Family Network serving as the singular coordinating agency for the statewide network of independent resource and referral organizations. Similarly, the U.S. Department of Defense operates the largest school system in the world under this same model, with the DOD operating a “virtual school system” that coordinates across bases from child care to K-12 across the globe. This helps to alleviate administrative and operational burden, bring critical logistical supports like vetted substitute pools, instructional and training resources, and would enable the provision of a provider benefits package.
It also creates the opportunity for negotiated contracts, bulk purchasing, and shared services to help reduce expenses and implement uniform models to address equity issues. At the same time, a central coordinating point can help to improve communication by establishing a consistent and trusted source for information charged with aligning all other support entities and resolving escalated issues. Fundamentally, this intervention could serve to singularly address the greatest number of barriers raised by FCC providers, not only toward Blueprint implementation, but in ensuring a vibrant and continuous mixed delivery model throughout the State. While not an inconsequential expense, it is a logical next step for the recently legislatively passed H.B. 1441 hubs in what would be a Hub+ model, and a critical need toward full Blueprint implementation.
3 Fund FCC by the slot with guaranteed payments.
Fundamentally, to ensure the continued supply of FCC, the challenges in the business model must be addressed. Establishing an intermediary support system like a “virtual school system” can help to reduce burden and expenses, but the other critical component is removing the fiscal uncertainty that comes from realities of family mobility and consumer choice. This can be accomplished through private-public partnerships between the business sector and government, but ultimately the end goal must be ensuring providers know they have a year’s worth of their targeted tuition to define their revenues versus expenses. Only then will there be confidence in making investments in areas like professional growth, hiring, and infrastructure that are necessary to fully implement Blueprint. At the same time, this will assuage the uncertainty that is built into the reality of being a FCC provider while acknowledging the constricted regulatory environment in which they function so that these small businesses are not fully in control of their profitability. Yet, they serve a critical public good. The template already exists for private business that is operationally subsidized by the public based on their critical need those entities provide. Private farmers are one example where the U.S. Department of Agriculture routinely pays producers to either grow, or not, certain crops based on supply needs. And within the field of early childhood, Head Start would be a similar analog, where private entities receive full operating grants to provide services to a specified capacity.
4 Create a managed enrollment system. In support of conceptualizing the entire continuum of Maryland’s ECEC as a strengths-based placement model (see recommendation #1), MSDE should develop a universal enrollment system that is shared across the entirety of all licensed providers and approved programs. Here, entities like the ”Virtual School System,” but also the established resource and referral network that directly support consumers, could monitor vacancies, and match families based on a child’s needs to localized options that are the best fit choices. There would still be parental choice, but such a system would help to address the under-enrollment issues that plague not only FCC, but many child care centers, and allow each program type to focus on their unique attributes to best cater to a segment of the population’s needs, ensuring a wide-range of developmentally appropriate options for all children. Ideally, this would enable flexible placements, wherein for example, a child could spend part-day in FCC for small group focused skill work and part-day in a Center socializing.
# Recommendation Rationale
5 Establish alternative competency professional pathways.
6 Establish professional supports.
121 NRC 2015
122 Kantor & Kauerz, 2020
As was espoused by the National Research Council’s (NRC) 2015 report,121 Transforming the Workforce for Children Birth Through Age 8, the early childhood profession needs multiple pathways to professionalization. Overall, 60% of the field possess a high-school diploma or less, and there is not consensus as to whether degrees equate to greater effectiveness in the classroom.122 The aims of Blueprint are admirable in seeking to raise the professional qualifications for preschool teachers, but they are creating a potentially unattainable requirement for thousands of Maryland’s current providers who have and continue to provide high-quality early care and education. An alternative model such as what the NRC and many other leading organizations have espoused is needed. In fact, one of this study’s authors co-led a taskforce with other state leaders defining a Maryland workforce competency model that has yet to be implemented, and with the recent announcement that the Maryland Credentialing and Training fund will no longer be funded after June 30, 2024, there will be even less supports and motivation for providers to pursue the type of formal learning degree pathways specified in the Blueprint. At the same time, as shown in the cost-models, the return on investment doesn’t exist under the current expense and revenue structures. In fact, a more likely risk is further attrition from the field as newly degreed ECEC professionals take higher paying positions with local school systems.
Instead, adopting competency models that measure knowledge, skills, and behaviors regardless of one’s terminal degree status, using defined competency standards, and then targeting new entrants into the field with supported tuition programs in exchange for dedicated years of service could service to establish a generational shift to a degreed workforce without causing massive further disruption to the current workforce supply.
As noted, even in the most profitable FCC cost-model, the business owner still did not provider benefits for herself or employees. In all of the focus interviews, none had benefits through their work. All described the challenges in participating in trainings, workgroups, even schooling due to lack of substitutes, and that not only adds to burden, but it creates a less cohesive professional community as providers then turn to smaller networks that may not always be connected to the most accurate information. Using a singular support entity like a “Virtual School System” (see recommendation #2), Maryland has the opportunity to lead in this national challenge. Previous attempts to create umbrella health coverage has failed due to lack of single employer provisions, but those could be overcome through an association-based model not dissimilar to when large affiliations offer insurance discounts (i.e. AARP or university alumni). Similarly, that entity could serve as the vetting and coordinating entity for the pool of substitutes. These benefits could extend further – into retail discount programs; retirement and other wellness initiatives; financial benefits such as discounted home insurance and tax credits like K-12 teachers receive, as a few examples. Fundamentally, this begins to establish FCC (and ECEC at-large) as the critical profession it is to society, and recognizes it as such. This will go a long way to helping both attract and retain workers into the field.
# Recommendation Rationale
7 Create a culture shift.
In the field of communication science, the Mehrabian Myth refers to the fact that the actual words we use only account for 7% of meaning that is understood. The largest conveyor of communication is non-verbal, and it is a feeling versus a literal understanding. It is an impression… a sense. And these feelings can become bias loops that also become self-feeding; particularly when there has been a breakdown of trust based on past experience, or even perceived experience. As such, the words become even less effective, as there is already a filtered negative interpretation.
The antidote is not more words, and while the authors applaud MSDE for increasing its channels and output of communications, opting for greater transparency and timeliness in communication, another principal from communication science, the Seven Levels of Communication shows broad based messages that go across a population fall into the informational zone. Informational zone processing is filtered by two key conditions: 1) the aforementioned perception; and 2) a readiness that is based in the science of Maslow’s Hierarchy of Needs. In essence, that theory states your most pressing needs – physiological, safety, psychological – must be met before your in your fully “actualized” state of being attentive. The Seven Levels then shows the more effective forms of communication are in the influential zone – these are more direct, understanding and addressing the needs of the listener in order to be a more effective communicative exchange. At the top of that pyramid are 1:1 interactions.
A consistent and recurring theme throughout this study and from the authors’ experiences, over time in Maryland, has been a divide across levels of the policy-makers, regulators, advocates, support professionals, providers, and consumers. There are few opportunities when these groups authentically intermingle together at the same time in open and frank dialogue. There are feelings of distrust and misunderstanding across the spectrum, yet there is general alignment of goals. Ultimately, the final recommendation is to embrace a culture shift to create more direct engagement across these constituents. That will require many of the previous recommendations to enable providers, especially FCC, to have the time to be at the table for those conversations, but it also might look like different stakeholders spending time in FCC programs purely to observe, not to evaluate. It means regulatory agencies need to consider programs like amnesty models as pathways to licensure to bring currently illegally operating programs into safe and monitored supervision, and to understand from consumers what drives their selection of these programs.
And it means for providers, the opportunity to hear directly from leaders why key policies and practices are in place – how they serve to protect and support children, to have their questions answered and ideas heard for improvements, and for all to identify when there are places where there’s misinformation. Foundationally, this is the greatest strategy for long-term success of Maryland’s ECEC system.
There are a number of limitations to this study. First, while the overall survey sample was statistically valid at 95% confidence level, the sample of fully complete responses (surveys and focus interviews) was only 4% of the FCC population at the time of data collection. The lack of responsivity by providers is an avenue for further investigation onto itself, but it does warrant cautions when interpreting the data. The final analyzed data set was about 2/3 of the initial targeted sample that had the strongest confidence level for interpretation.
Likewise, another limitation is the small sample for the cost-models. While those eight providers did give greater confidence in the accuracy of their information by going through an interview process where bi-directional questions could be asked for clarity, screen sharing was used to review documents and calculations, there are still general questions about underlying expense categorization. The fact that the larger focus group acknowledged that would be a likely concern enough to not simply trust collecting that information via self-reported survey, and it was corroborated via the eight interviews, helps to validate the broader interpretive conclusions around the nature of the FCC business model, but there are still potentially a variety of other costmodel profiles not uncovered through the eight interviews conducted.
Areas for future research would include specifically looking at cost-profiles within a geographic cluster to better gauge comparable tuition rates, expenses, and market demands at the level of detailed analysis the interviews enabled. Similarly, this study did not allow for looking at the vendor/supplier side to analyze specific goods and services to determine comparative costs.
Should Maryland move to a competency-based pathway, examining differential outcomes at the child-level, stratified by professional competency versus terminal degree/credential, would be a key area for examination. Likewise, to validate if there are inherent strengths to the uniqueness of each ECEC program type, defining universal child measures, likely across a battery of instruments measuring multiple social, emotional, behavioral, functional, physiological, psychological, cognitive, and educational domains would be a worthy examination to determine if certain program types produce stronger outcomes for certain child/family profiles, and in turn correlated to what degree of professional preparation. Finally, all of this can be in turn measured through a true return on investment.
Maryland has made a historic commitment to children through the Blueprint for Maryland’s Future. It has brought an unprecedented level of focus on the importance and impact the early years play in the entirety of a child’s life. Despite these strong positive intentions, there are threats of negative unintended consequences as a
myriad of forces collide to create a seemingly untenable future for many in Maryland’s Family Child Care profession. In what was already a field facing a declining trend preCOVID, the pandemic only worsened the pressures on FCC providers who are neither fully small businesses nor educational settings. They are something in-between. This uniqueness of their identity makes them an outlier in much of the reforms espoused by Blueprint, as broadly, the FCC providers are not widely ready to meet the requirements, and economically, it does not make sense for many to do so. Instead, there is significant risk of exacerbating the shrinking FCC supply, as newly degreed providers see greater economic opportunity with employment benefits working in public schools that are desperate for their own staffing needs. This further erosion of FCC tends to hit children of color, those who are economically disadvantaged, and children with developmental differences, as well as families in rural communities, disproportionately harder than other populations. But the effects of a lost FCC field will be felt by all, as fewer infant and toddler slots for all families will be available, creating further challenges as Maryland employers try to entice workers back into offices. This will likely be particularly felt by women, where Maryland continues to trail the nation in women returning the workforce post-COVID.
The State has already taken the bold steps of recognizing the importance of early childhood, now it is to stick the landing with the implementation of Blueprint. This study provides valuable insights directly from FCC providers on the challenges and needs they have. It builds upon past data and research and years of experience to flesh out seven key recommendations that are feasible, achievable, and necessary to ensure Maryland’s Blueprint is building a stronger and better future for its children… today.
Note: Below is a printed version of the online survey. Hyperlinks and informational pop-up windows are not displayed but were active in the online versions.
This survey is part of a funded study being conducted by the Family Child Care Alliance of Maryland with funding from the Maryland State Department of Education (MSDE). Its purpose is to hear directly from Maryland Family Child Care (FCC) providers to understand what barriers, possible supports, and associated costs exist for FCC participation in the Blueprint for Maryland’s Future (Blueprint) - a comprehensive set of education initiatives designed to strengthen Maryland’s entire education system. The Blueprint created historic investments in Maryland’s Early Care and Education (ECE) system, while increasing requirements designed to improve the quality and benefits of ECE. The intention of this study is to identify any unintended consequences of the Blueprint requirements while defining ways to best support FCC in order to meet Maryland’s goals of having a robust, mixed delivery system of ECE that expands Pre-K access statewide. The following provides some background information related to the Blueprint.
Under the Blueprint for Maryland’s Future, increased funding per child is available for FCC who enroll a preschool aged child and have met the Blueprint requirements. Those requirements include for FCC:
By 2025-26 School Year:
1) High staff qualifications, including –
a. Teachers who, at a minimum, hold:
i. State certification for teaching in early childhood education; or
ii. A bachelor’s degree in any field and are pursuing residency through the Maryland Approved Alternative Preparation Program, which includes early childhood coursework, clinical practice, and evidence of pedagogical content knowledge
b. Teaching assistants who have at least:
i. A Child Development Associate (CDA) certificate; or
ii. An associate’s degree
2) Professional development for all staff
3) A student–to–classroom personnel ratio of no more than 8 to 1 for FCC
4) A full–day prekindergarten program
5) Inclusion of students with disabilities to ensure access to and full participation in all program opportunities
6) Currently Maryland EXCELS Level 3+, with a goal to increase to Level 5 by 2028
7) Classroom instruction:
a. Are aligned with State Early Learning and Development Standards;
b. Use evidence–based curricula; and
c. Use instruction methods that are:
i. Developmentally appropriate; and
ii. Culturally and linguistically responsive;
iii. Individualized accommodations and supports for all students;
8) Instructional staff salaries and benefits that are comparable to the salaries and benefits of instructional staff employed by the county board of the county in which the early learning program is located
9) Program evaluation to ensure continuous program improvement
10) On–site or accessible comprehensive services for students
11) Community partnerships that promote access to comprehensive services for families of students
12) Evidence–based health and safety standards.
As a result, the State of Maryland will pay providers a defined amount per child whose family income is at or below 300% of the federal poverty level. The State envisions three Tiers - with children in Tier 1 receiving full payment; children in Tier 2 receiving partial payment; and children in Tier 3 receiving no payment from the State. Right now, only Tier 1 students are eligible for Pre-K expansions grants. The amount of money the State will pay is proposed to increase each year. For example:
Based on Maryland’s proposed payment schedule, a FCC provider who has met Blueprint requirements and enrolled the licensing maximum of 8 income eligible Pre-K children at “Tier 1” would receive $134,488 from the state in FY28 (starting July 1, 2027).
The following questions are designed to gather information about Maryland’s FCC providers’ interest, readiness, and plans to participate in the Pre-K expansion under the Blueprint. We ask that you answer based on your direct experiences and opinions. Your answers are confidential – your specific information will not be shared with anyone beyond the data collection team and is gathered to verify your role, award
your PAUs, and enter you into a random drawing for one of several $20 gift cards. The research team are independent contractors along with staff at the Family Child Care Alliance of Maryland – a private advocacy and support group for Maryland FCC. You can skip any question, though the more information you provide, the better we are able to advocate on your behalf. The goal of this survey is to identify any necessary supports or changes to help FCC providers participate in the Blueprint. Changes could include recommendations around policy and the Blueprint requirements; supports could be greater financial benefits and other resources. Your answers will help us best determine what is needed.
If you click on a hyperlink in the survey, it will open in a new window. Please close that window when done - DO NOT CLOSE THE WINDOW WITH THE SURVEY or you might lose your data.
If you have any questions or concerns, please contact study the Principal Investigator, Dr. Sondeania Johnson, at sondeania.johnson@fccamd.org or study consultant, Dr. Chris Swanson, at cswanson@c-impactnow.org. Thank you!!!!
The following questions are designed to understand who is responding to the survey. This will not specifically identify you. At the end of the survey, you have the option to provide your name and email. This is necessary if you a) have any questions you want us to respond to, b) are willing to be interviewed further to discuss cost models, and c) want to be entered into the drawing for gift cards and to receive PAUs, BUT in all cases, your specific answers will be kept confidential.
These questions help us to understand the background of people completing the survey.
How many years have you been a FCC provider?
o Less than 1 year
o Between 1 -5 years
o Between 5-10 years
o Between 10-20 years
o More than 20 years
o I am not a FCC provider
How many infants do you have currently enrolled?
o One
o Two
o None
How many toddlers do you have currently enrolled?
o 1-2
o 3-5
o More than 5
o None
How many Pre-K children do you expect to have enrolled fall 2023?
o 1-2
o 3-5
o More than 5
o None
How many school-age children do you currently enroll?
o 1-2
o 3-5
o More than 5
o None
How many people work in your FCC?
o Just myself
o 2, including myself
o 3, including myself
o More than 3 including myself
o I do not have any staff
Are you planning on closing your FCC in the next 3 years?
o Yes
o No
o Not sure
If you are planning on closing, what is the number one reason you will close?
Are you familiar with the Blueprint for Maryland’s Future requirements and available funding to enroll Pre-K students?
o Yes
o No
o Not sure
Do you get support in being a FCC provider from the following sources (check all that apply):
❏ Resource and Referral Staff
❏ MSDE Quality Assurance Specialist
❏ Trainer/Private Consultant ❏ NAFCC Specialist
❏ MSDE Licensing Specialist ❏ Maryland EXCELS Program Coordinator
❏ MSDE Credentialing Office ❏ Local School System Staff
❏ JUDY Center Coordinator ❏ College/Higher Education Staff
❏ ASPIRE Coach ❏ Family Child Care Association Staff
❏ Maryland Family Network Staff ❏ Peers/Informal Supports
❏ Other
The following questions relate to potential barriers, presented by category, for FCC to participate in the Pre-K expansion requirements under the Blueprint for Maryland’s Future.
For each question below, please RATE the listed BARRIER on a SCALE of 1-5, with 1 being the least challenging and 5 being the most challenging barrier.
You can also select Not Applicable. After the options, you may use the: I Have a Question box to enter a question and a research team member will reach out to try and clarify anything that you had a question about IF YOU PROVIDE YOUR CONTACT INFORMATION at the end of this survey.
You can select the OTHER option and write what other thing(s) you want to add - and then following this question, we ask you to list the top three issues for you from each topic.
1) Based on the education requirements for the Blueprint, which would apply to a single FCC owner/operator or to any staff they hire, please indicate the level of barrier for the following Education Requirements from 1 (Least) to 5 (Most) challenging. You may also select not applicable. Following the choices, you can select OTHER and write in your suggestions; or I Have A Question if you do not understand an option. Lastly, we ask you to also note your TOP THREE Education Barriers in any order that you would want to see changed first.
Score Barriers from Least to Most Challenging
0 1 2 3 4 5 N/A
Balancing time of pursuing education with needs of your family; life; and/or running your business.
Differences in degree requirements between colleges creates confusion as to what is needed to complete a degree.
Confidence in being successful in completing college. Needing help with English; and/or supports for learning challenges, etc.
Desire to get a degree.
Score Barriers from Least to Most Challenging 0 1 2 3 4 5 N/A
Cost of schooling that isn’t reimbursed.
Upfront and out-of-pocket costs.
Feel “not experienced enough”.
Child Care Career and Professional Development Fund - access, awareness, process, reimbursement model.
How long it takes to complete a degree.
Comfort and/or access to technology.
Cost of required materials – technology, books, etc.
User-friendliness of MSDE’s The Educator and Application Certification Hub (TEACH) portal–information hard to understand, too long to get response from MSDE to guide knowing what class to take toward certification.
Other:
I HAVE A QUESTION: If you have any questions about the above options, please ask them here AND if you supply your contact information at the end of the survey, we will follow-up to clarify:
Please list your TOP THREE EDUCATION BARRIERS in any order (you can include your OTHER additions):
2) Based on the teacher certification requirements for the Blueprint, which would apply to a single FCC owner/operator or to any staff they hire, please indicate the level of barrier for the following Education Requirements from 1 (Least) to 5 (Most) challenging. You may also select not applicable. Following the choices, you can select OTHER and write in your suggestions; or I Have A Question if you do not understand an option. Lastly, we ask you to also note your TOP THREE Certification Barriers in any order that you would want to see changed first.
Barriers from Least to Most Challenging
Completing student teaching requirement in a program outside of my business.
Burden of completing student teaching while operating my business.
Certification process is convoluted – not designed for individual provides as it is usually managed by a school system on behalf of teacher.
Certification can take a long time to get feedback from MSDE - not user friendly.
Locating the “right” Praxis prep (materials + other web-based supports) for an educator can be challenging.
Number of times to try and pass the PRAXIS exams.
Understanding between a Degree and Certification. Enrolled in a degree program that does not provide certification.
Transferring certification from another state or country.
Balancing time of pursuing certification with needs of your family; life; and/or running your business.
Risk of needing to repay MSDE if unable to complete certification requirements.
Lack of clarity on what it takes to stay certified and the need to retake PRAXIS if certification lapses.
Challenge in navigating certification as a private individual not connected to a school system.
Inconsistent information from colleges around certification requirements.
Other:
I HAVE A QUESTION: If you have any questions about the above options, please ask them here AND if you supply your contact information at the end of the survey, we will follow-up to clarify:
Please list your TOP THREE CERTIFICATION BARRIERS in any order (you can include your OTHER additions):
3a) To date, funding for providers who participate in Pre-K expansion is through a MSDE grant submission process. For this question, please first indicate whether you have ever applied for a Pre-K expansion grant with MSDE.
o Yes, I have applied in the past and been awarded.
o Yes, I have applied in the past and was not selected.
o No, I have never applied.
o I am unsure if I have ever applied.
3b) Based on the Pre-K grant application process, please indicate the level of barrier for the following topics related to the grant application, from 1 (Least) to 5 (Most) challenging. You may also select not applicable. Following the choices, you can select OTHER and write in your suggestions; or I Have A Question if you do not understand an option. Lastly, we ask you to also note your TOP THREE Grant Application Barriers in any order that you would want to see changed first. (NOTE - even if you have never applied for one of these grants, we want to understand whether these barriers were the reason).
Score Barriers from Least to Most Challenging 0 1 2 3 4 5 N/A
I did not know about these grants.
I did not meet the requirements under the Blueprint. I did not understand the Blueprint requirements.
I could not find help to apply for the grant.
I did not feel confident in being able to successfully apply for the grant.
I was generally not interested in Pre-K expansion. It was not enough funding to participate Pre-K expansion.
Score Barriers from Least to Most Challenging 0 1 2 3 4 5 N/A
Challenges in completing the grant application
Lack of time to research and complete grant.
Grant requirements favor center-based responses.
I do not have the background knowledge to understand the grant application.
Grant application is cumbersome and not user-friendly.
I was worried about being able to fulfill the compliance and grant management requirements.
I was worried about being able to accomplish the goals and activities of the grant.
I disagree with the Pre-K expansion and/or Blueprint model.
The grant is not available in my native language.
I do not understand the long term financial obligations once I accept the grant.
Other:
I HAVE A QUESTION: If you have any questions about the above options, please ask them here AND if you supply your contact information at the end of the survey, we will follow-up to clarify: ___________________________________________________________
Please list your TOP THREE GRANT APPLICATION BARRIERS in any order (you can include your OTHER additions):
Financial Barriers
4) Based on financial aspects of meeting the Blueprint requirements, please indicate the level of barrier for the following topics related to financial barriers, from 1 (Least) to 5 (Most) challenging. You may also select not applicable. Following the choices, you can select OTHER and write in your suggestions; or I Have A Question if you do not understand an option. Lastly, we ask you to also note your TOP THREE Financial Barriers in any order that you would want to see changed first.
Cost of college.
Fees associated with taking the Praxis exams for certification.
Cost associated with hiring an assistant, substitute, or certified lead teacher.
Sustainability of the state funding after making investments.
Timeliness of receiving payments from MSDE.
Unpaid student teaching requirements.
Costs for home structural and/or curriculum investments.
Cost burden to modify the home for students with disabilities.
General operational cost increases like taxes and payroll.
Need greater upfront capital funding to cover required expenses .
Uncertainty about enrollments and payment amounts from MSDE for enrolled students make it hard to know how much revenue will be earned.
As payment follows the child, if a child leaves how do I cover my additional expenses.
If employing a paid teacher, burden for that cost without guaranteed revenue from enrollments.
Meeting the financial requirements for teacher pay and benefits.
Concerns about tax implications of accepting grant funds.
Hard to find eligible students, requires recruitingincluding advertising and screening.
Other:
Score Barriers from Least to Most Challenging
I HAVE A QUESTION: If you have any questions about the above options, please ask them here AND if you supply your contact information at the end of the survey, we will follow-up to clarify: ____________________________________________________________
Please list your TOP THREE FINANCIAL BARRIERS in any order (you can include your OTHER additions):
5a) Please indicate whether you currently work at and/or own/operate a licensed FCC program in Maryland.
o Yes, I work at and/or own/operate a currently licensed Maryland FCC program
o No, I do not work at, own, or operate a currently licensed Maryland FCC program
o I work at or own/operate a “large”(more than 8 children) FCC program in Maryland
5b) Based on Blueprint requirements, please indicate the level of barrier for the following topics related to FCC licensing, from 1 (Least) to 5 (Most) challenging. You may also select not applicable. Following the choices, you can select OTHER and write in your suggestions; or I Have A Question if you do not understand an option. Lastly, we ask you to also note your TOP THREE Licensing Barriers in any order that you would want to see changed first.
Score Barriers from Least to Most Challenging 0 1 2 3 4 5 N/A
Earning and/or maintaining licensure.
Inconsistencies between Licensing/EXCELS/ Accreditation/R&R/Trainer, etc. personnel creates confusion around requirements.
Concerns over how licensing status could effect Maryland EXCELS rating and then impact on Pre-K expansion participation.
Requirements to become licensed.
Score Barriers from Least to Most Challenging 0 1 2 3 4 5 N/A
Licensing regulations to operate FCC are more than what public schools have to follow.
I do not have enough square footage in my home to accommodate more adults and/or dedicated preschool classroom.
Inconsistent information around staffing - i.e. being allowed to hire an assistant, space requirements for having more than one adult, etc.
Since licensure violations can lead to closures, worried about guaranteeing instructional program for Pre-K expansion.
Balancing supervision requirements across mixed age-groups.
Balancing physical space requirements across mixed age-groups.
Other:
I HAVE A QUESTION: If you have any questions about the above options, please ask them here AND if you supply your contact information at the end of the survey, we will follow-up to clarify:
Please list your TOP THREE LICENSING BARRIERS in any order (you can include your OTHER additions):
6) Based on providing quality Pre-K programming, please indicate the level of barrier for the following topics related to student needs, from 1 (Least) to 5 (Most) challenging. You may also select not applicable. Following the choices, you can select OTHER and write in your suggestions; or use the I Have A Question box below if you do not understand an option. Lastly, we ask you to also note your TOP THREE Student Needs Barriers in any order that you would want to see changed first.
Having the training to successfully help students with a variety of needs like English Learning, trauma, special education, etc.
Having the physical space necessary to meet needs of children (i.e. accessibility; quiet space for students with sensory issues, etc.)
Being required to enroll students who I do not feel equipped to support.
Unaware of supports available from local school system to help.
Lack of confidence in the quality/helpfulness of supports available from local school system.
Worried about behavioral issues.
Worried about cultural issues.
Worried about educating students of a particular race.
Worried about educating students of a particular gender.
Worried about educating students of a particular religion.
Worried about having the time to meet a child’s needs.
Worried about having the funding needed to meet a child’s needs.
Worried about having the expertise needed to meet a child’s needs.
Worried about having the ability to modify curriculum/instruction to meet certain children’s needs.
Worried about parental concerns over my instruction.
Worried about intensity of family engagement based on their child’s needs.
Score Barriers from Least to Most Challenging
Score Barriers from Least to Most Challenging 0 1 2 3 4 5 N/A
Ability to meet the needs of my infants and toddlers while providing Pre-K services.
Access to physical play space.
Ability for a preschooler to have access to same-aged peers.
Ability to provide continuity of care when FCC serves a child from infancy through school-age based on requirements and money associated with Pre-K.
Ability to identify if a child needs help / supports
Legal risk of inability to adequately accommodate students receiving special education or other legally protected students
Other:
I HAVE A QUESTION: If you have any questions about the above options, please ask them here AND if you supply your contact information at the end of the survey, we will follow-up to clarify: ____________________________________________________________
Please list your TOP THREE STUDENT NEEDS’ BARRIERS in any order (you can include your OTHER additions):
Workforce
7) Based on staffing requirements under the Blueprint, and/or workload for yourself, please indicate the level of barrier for the following topics related to workforce issues, from 1 (Least) to 5 (Most) challenging. You may also select not applicable. Following the choices, you can select OTHER and write in your suggestions; or use the I Have A Question box below if you do not understand an option. Lastly, we ask you to also note your TOP THREE Workforce Barriers in any order that you would want to see changed first.
Score Barriers from Least to Most Challenging
Competing with school systems - pay/benefits/ supports.
Finding personnel - staffing shortages across the field. Time demands of recruitment; payment; benefits; taxes.
Logistical concern for having a second adult teaching in-house.
Costs for recruitment, onboarding, and retention.
Concerns over when certified teacher is absent or quits.
Too many different roles and responsibilities are expected of a single FCC provider - making it impossible to be successful.
The business model makes it hard to attract and retain additional personnel, yet increased legislative expectations make it hard to do the job as a sole proprietor.
Labor rules and liabilities.
Concerns in supervising performance of second teacher.
Logistical burdens of hiring staff (fingerprinting, finding substitutes, managing payroll, etc.)
Expenses like payroll, insurance, compliance related expenses are static, but enrollment and revenues from enrollment - isn’t.
Inconsistencies in zoning / approval process across Maryland creates barriers to hire and/or shift to large FCC.
Other:
I HAVE A QUESTION: If you have any questions about the above options, please ask them here AND if you supply your contact information at the end of the survey, we will follow-up to clarify: ____________________________________________________________
Please list your TOP THREE WORKFORCE BARRIERS in any order (you can include your OTHER additions):
The following questions relate to potential supports, presented by category, for FCC to participate in the Pre-K expansion requirements under the Blueprint for Maryland’s Future.
For each question below, please RATE the listed SUPPORT on a SCALE of 1-5, with 1 being the least helpful and 5 being the most helpful support. You can also select Not Applicable.
After the options, you may select: I Have a Question and a research team member will reach out to try and clarify anything that you had a question about IF YOU PROVIDE YOUR CONTACT INFORMATION at the end of this survey.
You can select the OTHER option and write what other thing(s) you want to add. Then following each question, please list your top three supports from that topic.
1) As funding for Pre-K expansion dollars are distributed via a grant, please indicate the following Grant Supports 1 (Least) to 5 (Most) helpful. You may also select not applicable. Following the choices, you can select OTHER and write in your suggestions; or I Have A Question if you do not understand an option. Lastly, we ask you to also note your TOP THREE Grant Supports in any order that you would want to see changed first.
Grant writing assistance – having someone to help write grants on my behalf at no cost to my program.
Grant writing assistance – having someone available to answer my questions real-time and/or review my application before I submit it at no cost to my program.
Replace grants - move to a funding form / application – this makes it not a competitive process but an information submission form to receive funding.
Offer the application and support information in multiple languages – consistently across the entire State.
Rewrite the grant application and directions in easier to understand “plain” language so it is less confusing.
Move to an automatic funding model – where there’s no application but the money is automatically given based on a program’s Blueprint Pre-K qualification and enrollment of children.
Increase awareness of grant opportunities and requirements.
Support to "unenroll" a child and/or transfer to another program.
Provide funding scale based on needs of enrolled children - so children requiring more intensive supports are funded at higher-levels by the State.
Other:
I HAVE A QUESTION: If you have any questions about the above options, please ask them here AND if you supply your contact information at the end of the survey, we will follow-up to clarify: ____________________________________________________________
Please list your TOP THREE GRANT SUPPORTS in any order (you can include your OTHER additions)
2) As funding for Pre-K expansion dollars are distributed via a grant, please indicate the following Education Supports 1 (Least) to 5 (Most) helpful. You may also select not applicable. Following the choices, you can select OTHER and write in your suggestions; or I Have A Question if you do not understand an option. Lastly, we ask you to also note your TOP THREE Education Supports in any order that you would want to see changed first.
More access to affordable and free college courses and Core of Knowledge trainings
Confirmation that the Blueprint law will not change the education requirements
Establish a “Teacher Certification Hub” – providing free transcript analysis support that then provides a universal set of what’s missing and where you can get any required classes
Adopt an alternative to degrees – a way for professionals to demonstrate they have the skills, knowledge, and experience without earning a degree
Implement rules designed to retain veteran workforce members who have neither time, money, or interest in pursuing a degree ()
Alternative certification programs that allow FCC providers to use their own program for their student teaching experience
Create FCC cohorts or education paths specifically designed for FCC
Provide free technology workshops and trainings across the state on weekends and evenings – and even provide in-house support for FCC who cannot leave
Supports from Least to Most Challenging
Provide a comprehensive listing of degree requirements for all MSDE approved colleges and universities
Ensure consistent requirements between college programs to prevent gaps in MSDE certification requirements.
Create a universal self-assessment for FCC that measures experience, competency, past formal education across both trainings and college credit –and then provides a roadmap for what is needed to complete certification.
Create more educational opportunities in other languages.
Other:
I HAVE A QUESTION: If you have any questions about the above options, please ask them here AND if you supply your contact information at the end of the survey, we will follow-up to clarify: ____________________________________________________________
Please list your TOP THREE EDUCATION SUPPORTS in any order (you can include your OTHER additions):
Financial Supports
3) As funding for Pre-K expansion dollars are distributed via a grant, please indicate the following Financial Supports 1 (Least) to 5 (Most) helpful. You may also select not applicable. Following the choices, you can select OTHER and write in your suggestions; or I Have A Question if you do not understand an option. Lastly, we ask you to also note your TOP THREE Financial Supports in any order that you would want to see changed first.
Paid Praxis registration
Stipends for Internet access for FCC providers who are enrolled in online classes
Free business training for FCC providers
Implemented discount program for FCC similar to what K-12 teachers receive that allows purchase of goods and services with local merchants at a discount
Provision of tax-exempt cards for purchasing materials and supplies
Guaranteed income and benefits by the State
Provision of umbrella benefits, including retirement
Restructured MSDE payments into advance payments to help with payroll and expenses
The state pays for the slot, and not the child, to prevent unplanned drops in revenue if a child disenrolls
Provide infrastructure grants / loans / to make modifications to homes and/or move from FCC to Large Home providers
Provide funding operational needs – like taxes, payroll, operations, etc.
Provide funding for curriculum and materials
Guarantee that enrollment payments occur for the duration of a child’s enrollment period regardless of Maryland EXCELS or licensing status – since public schools do not have a risk of being made “ineligible” post child enrollment
Other:
I HAVE A QUESTION: If you have any questions about the above options, please ask them here AND if you supply your contact information at the end of the survey, we will follow-up to clarify:
Please list your TOP THREE FINANCIAL SUPPORTS in any order (you can include your OTHER additions)
Broad Supports
4) As funding for Pre-K expansion dollars are distributed via a grant, please indicate the following Broad Supports 1 (Least) to 5 (Most) helpful. You may also select not applicable. Following the choices, you can select OTHER and write in your suggestions; or I Have A Question if you do not understand an option. Lastly, we ask you to also note your TOP THREE Broad Supports in any order that you would want to see changed first.
Score Supports from Least to Most Challenging
0 1 2 3 4 5 N/A
Define the benefits of FCC as a unique trait to the setting and describe the developmental benefits for children, such as low ratios, more intensive focusing on a child's unique needs, home-based setting, etc.
Create a “Virtual School System” that supports all of FCC across Maryland, providing shared services and manages aspects of operations like providing training and curriculum, purchases and distributes materials, maintains a benefits pool and handles payroll, maintaining and deploying substitutes, providing payments, helping to coordinate enrollments, etc.
Provision of shared services like substitutes, training, business services management, recruitment, succession planning, equipment, processes, requirements like EXCELS/Accreditation, etc. on behalf of FCC .
Managed enrollments - looking at vacancies across a geographic area to identify child placements to prevent over/under enrollments .
Coordinated supports with school system for things like IEP, IFSP, 504, ELL, social-emotional needs, etc.
Implement public transportation for children in community care settings.
Other:
I HAVE A QUESTION: If you have any questions about the above options, please ask them here AND if you supply your contact information at the end of the survey, we will follow-up to clarify: ____________________________________________________________
Please list your TOP THREE BROAD SUPPORTS in any order (you can include your OTHER additions)
As part of our study, we want to understand the costs to FCC providers for both providing quality care, and in meeting the Blueprint requirements. The Blueprint is increasing the level of payment to FCC providers significantly, but it is unclear how costs will increase.
To answer this, we are seeking volunteer FCC providers who will be willing to have a follow-up conversation with the research team. Examples of the questions we will ask:
• How much do you charge per child?
• What are your costs per child?
• What are your costs in specific categories? - like materials, mortgage/rent, utilities, etc.
Please let us know if you would be willing to engage in a private follow-up interview, and then be sure to complete your contact information in the final question. Again - all of your answers are confidential.
Please indicate your willingness to participate in a follow-up interview related to the costs of operating a FCC.
o Yes, I am willing to be interviewed. (Make sure to complete your name and email below)
o No, I am not interested. If you are willing to be interviewed, please note your preferred days/times for a 1-hour conversation.
Thank you for your time and answers. The following helps us compare responses and follow-up with you on any questions. Your specific responses will not be shared with other reviewers.
Your Name
Your Email Address
Table
Table
Table
Figure
Table 32. Reported Grant
Figure
Table 33. Reported
Figure
Table
Figure
Table
Figure
Table 36. Summary Demographics of Cost-Model
Table
Table 38. Profile
Table 39. Net Revenues and Estimated Tax Obligations by Profile and Adjusted
Table
1. McCoy, D. C. , H. Yoshikawa, K. M. Ziol-Guest, G. J. Duncan, H. S. Schindler, K. Magnuson, R. Yang, A. Koepp, and J. P. Shonkoff. “Impacts of Early Childhood Education on Medium- and Long-Term Educational Outcomes.” Educational Researcher 46 no. 8 (2017): 474–87. https://doi.org/10.3102/0013189X17737739.
2. Committee for Economic Development (CED) 2019. Child Care in State Economies. Arlington, VA: CED.
3. Hussar, B., J. Zhang, S. Hein, K. Wang, A. Roberts, J. Cui, M. Smith, F. Bullock Mann, A. Barmer, and R. Dilig. 2020. The Condition of Education 2020 NCES (2020)144. US Department of Education. Washington, DC: National Center for Education Statistics. https://nces.ed.gov/pubsearch/pubsinfo.asp?pubid=2020144
4. National Survey of Early Care and Education Project Team (NSECEPT), “Characteristics of Home-Based Early Care and Education Providers: Initial Findings from the National Survey of Early Care and Education.” OPRE Report (2016): 13, Washington, DC: Office of Planning, Research and Evaluation, Administration for Children and Families, U.S. Department of Health and Human Services.
5. J. Cohn, “The hell of American day care.” The New Republic. (April 2013). Or J. Wrigley and J. Dreby, “Fatalities and the Organization of Child Care in the United States, 1985–2003.” American Sociological Review 70 no. 5 (2005): 729–57. https:// doi.org/10.1177/000312240507000501. Or C. Swanson. 2024. eds. C.C. Morphew, V.C. Jones, and A. Cureton. “Safe and healthy schools in preschool settings.” Creating Safe, Healthy, and Inclusive Schools. Johns Hopkins University Press, Baltimore: Maryland.
6. The National Advisory Committee on Rural Health & Human Services (NACRHHS). 2023. “Childcare Need and Availability in Rural Areas: Policy Brief and Recommendations to the Secretary.” Rural Policy Research Institute, University of Iowa, Iowa City: Iowa. Or J. Pattnaik and M. Lopez. 2023. “Financial Challenges of Family Child Care Providers During the COVID-19 Pandemic: A Phenomenological Study.” Early Child Educ J 51 doi: 10.1007/s10643-023-01477-9. (April 17): 1-15. Epub ahead of print. PMID: 37360593; PMCID: PMC10108782.
7. Muenchow, S., D. P. Pizzi, C. Zhang, and T. Harper. 2020. California’s family child care networks: Strengths, challenges, and opportunities. (2020): retrieved from https:// www.air.org/sites/default/files/Californias-Family-Child-Care-Networks-Report-Dec2020rev2.pdf
[“id.“ refers to a previously cited authority]
8. Administration of Children and Families. 2021. “Home-based early care and education providers in 2012 and 2019.” Counts and characteristics. National Survey of Early Care and Education (NSECE) ß(May 2021): retrieved from https://www.acf. hhs.gov/sites/default/files/documents/opre/NSECE-chartbook-homebased-may-2021. pdf. Or id., “Financial Challenges of Family Child Care Providers During the COVID-19 Pandemic: A Phenomenological Study.” Early Child Educ
9. Garver, K., G. G. Weisenfeld, L. Connors-Tadros, K. Hodges, H. Melnick, and S. Plasencia. “State preschool in a mixed delivery system: Lessons from five states.” Learning Policy Institute (2023): retrieved from https://doi.org/10.54300/387.446
10. id., Child Care in State Economies
11. Henly, J. R., and G. Adams. “Addressing the decreasing number of family child care providers in the United States.” (2019): retrieved from https://childcareta.acf.hhs. gov/sites/default/files/public/addressing_decreasing_fcc_providers_september2020_ final.pdf
12. Child Care Aware of America. “Demanding change: Repairing our childcare system.” (2022): retrieved from https://info.childcareaware.org/hubfs/2022-03FallReport-FINAL%20(1).pdf?utm_campaign=Budget%20Reconciliation%20Fall%20 2021&utm_source=website&utm_content=22_demandingchange_pdf_update332022
13. id., “Addressing the decreasing number of family child care providers in the United States.”
14. Crouse, G., R. Ghertner, and N. Chien. 2023. “The Impact of the COVID19 Pandemic on the Child Care Industry and Workforce.” (January 2023): Office of the Assistant Secretary for Planning and Evaluation, U.S. Department of Health and Human Service.
15. Friedman-Krauss, A., K. Garver, M. Nores, Z. Li, and C. Whitman. 2020. “Connecticut Preschool Special Education Needs Assessment.” In NIEER Technical Report. National Institute for Early Education Research. National Institute for Early Education Research (NIEER) New Brunswick: New Jersey.
16. Friedman-Krauss, A. H., W. S. Barnett, K. S. Hodges, K. A. Garver, T. M. Jost, G Weisenfeld, J. Duer. 2024. “The State of Preschool 2023: State Preschool Yearbook.” National Institute for Early Education Research. National Institute for Early Education Research (NIEER) New Brunswick: New Jersey
17. id., “The State of Preschool 2024: State Preschool Yearbook.”
18. Lovejoy, A. and H. Gibbs. 2023. Early Childhood Education in U.S. States: A Toolkit for State Policymakers. Center for America Progress. (December 14, 2023) retrieved from: https://www.americanprogress.org/article/early-childhood-educationin-u-s-states/
19. Durkin K., M.W. Lipsey, D.C. Farran, and S.E. Wiesen. “Effects of a statewide pre-kindergarten program on children’s achievement and behavior through sixth grade.” Developmental Psychology 58(3) (2022): 470-484. doi: 10.1037/dev0001301. Epub 2022 Jan 10. PMID: 35007113; PMCID: PMC9716729.
20. Bailey D., G.J. Duncan, C.L. Odgers, and W. Yu. “Persistence and Fadeout in the Impacts of Child and Adolescent Interventions.” Journal of Research on Educational Effectiveness 10 (1) (2017): 7-39. doi: 10.1080/19345747.2016.1232459. Epub 2016 Nov 14. PMID: 29371909; PMCID: PMC5779101
21. S.G. Paris. “Reinterpreting the development of reading skills.” Reading Research Quarterly 40 (2) (2005): 184-202. Retrieved from https://doi.org/10.1598/RRQ.40.2.3
22. Danniels, E., A. Pyle. “Inclusive Play-Based Learning: Approaches from Enacting Kindergarten Teachers.” Early Childhood Educ J 51 (2023): 1169–1179. Retrieved from https://doi.org/10.1007/s10643-022-01369-4. Or J. M. Zosh, C. Gaudreau, R. M. Golinkoff, and K. Hirsh-Pasek. “The Power of Playful Learning in the Early Childhood Setting.” YC Young Children 77 (2) (2022): 6–13. Retrieved from https://www.jstor.org/ stable/27185909
23. Harvey, H., & K. Ohle. “What’s the purpose? Educators’ perceptions and use of a state-mandated kindergarten entry assessment.” Education Policy Analysis Archives 26 (2018): 142. Retrieved from https://doi.org/10.14507/epaa.26.3877. Or R. Schachter, T. Strang, and S. Piasta. Teachers’ perspectives on the Kindergarten Readiness Assessment in year 2: Easier to administer but what role can it play in instruction? (Summer 2017) Crane Center for Early Childhood Research and Policy, Ohio State University, Columbus: Ohio.
24. Johnson, A.D., O.N. Schochet, A. Martin, S. Castle, D. Horm, D.A. Phillips, and S.S.T. Tulsa. “When does 1 + 1 not equal 2? The relative advantage of public schoolbased pre-k versus head start for low-income children’s kindergarten cognitive and self-regulatory skills.” Developmental Psychology 58 (5) (2022): 848–865. Retrieved from https://doi.org/10.1037/dev0001335
25. A. Diamond. 2014. “Executive Functions: Insights into Ways to Help More Children Thrive.” Zero to Three (November, 2014).
26. Maryland General Assembly. Blueprint for Maryland’s Future. (2021): [HB-1300]. Maryland: Maryland General Assembly.
27. U.S. Census Bureau. 2023 Census Report (2023) U.S. Government Printing Office.
28. The Annie E. Casey Foundation. “Kids Count Data Book.” (2023) Baltimore: Maryland retrieved from https://www.aecf.org/resources/2023-kids-count-data-book
29. Cole, P., K. Trexberg, and M. Schaffner. “State of babies yearbook: 2023.” Zero to Three. (2023) Washington DC: retrieved from https://zerotothree.wpenginepowered. com/wp-content/uploads/2023/09/SOBY2023_Yearbook_Full_v4.pdf
30. id., “Kids Count Data Book.”
31. id., “State of babies yearbook: 2023.”
32. Bureau of Labor Statistics, U.S. Department of Labor. The Economics Daily, Unemployment rate at 3.7 percent in December 2023 (2023) retrieved from https://www. bls.gov/opub/ted/2024/unemployment-rate-at-3-7-percent-in-december-2023.htm
33. U.S. Census Bureau. (2022). 2022 Census Report. U.S. Government Printing Office.
34. id., 2023 Census Report
35. id., “State of babies yearbook: 2023.”
36. id., Comptroller of Maryland, State of the Economy.
37. id., Comptroller of Maryland, State of the Economy.
38. Maryland Family Network (MFN). “2023 Child Care Demographics.” (2023) Baltimore: Maryland retrieved from: https://www.marylandfamilynetwork.org/earlyyears-matter/2023-child-care-demographics
39. id., Comptroller of Maryland, State of the Economy.
40. U.S. Census Bureau. (2021). 2021 Census Report. U.S. Government Printing Office.
41. id., “2023 Child Care Demographics.”
42. U.S. Department of Health and Human Services. 2023. “New rule proposed to improve child care access, affordability, and stability.” Notice of Proposed Rule Making press release (July 11, 2023).
43. id., Comptroller of Maryland, State of the Economy.
44. S. Ferguson. Data Deep Dive: A Decline of Women in the Workforce. U.S. Chamber of Commerce (2022) Washington DC: retrieved from https://www.uschamber. com/workforce/data-deep-dive-a-decline-of-women-in-the-workforce
45. Maryland Family Network (MFN). Trends in Child Care. (2023) Baltimore, MD: retrieved from: https://www.montgomerycountymd.gov/HHS-Program/Resources/ Files/CYF%20Docs/MCCCRRC/trends2023%20final.pdf
46. id., Data Deep Dive: A Decline of Women in the Workforce.
47. Maryland Family Network (MFN). 2024 Child Care Demographics. (2024) Baltimore: Maryland retrieved from: https://www.marylandfamilynetwork.org/sites/ default/files/2024-01/Maryland%202.0.pdf
48. Maryland State Child Care Association (MSCCA). 2023. “Testimony in Favor SB 893 Maryland Educator Shortage Act of 2023.” Submitted to the Maryland Education, Energy and Environment Committee, (March 7, 2023) retrieved from: https://mgaleg. maryland.gov/cmte_testimony/2023/eee/1Rp7tokjdacPwepiXDRvnBKsThOmp5VtH.pdf
49. Id., C. Swanson. 2024. “Safe and healthy schools in preschool settings.”
50. COMAR. “Child Care Centers: Scope and Definitions.” Code of Maryland Regulations (2020) 13A.16.01.
51. COMAR. Large Family Child Care Homes, Code of Maryland Regulations; 13A.18.01-.16 (2015).
52. Maryland Family Network (MFN). Caring During Covid: The Impact of the Pandemic on Maryland Child Care Providers. (2020) Baltimore: Maryland retrieved from: https://www.marylandfamilynetwork.org/sites/default/files/2020-09/2020%20 MFN%20Caring%20During%20Covid%20%28bg%29%201.3%20Pages%5B1%5D.pdf
53. id., 2024 Child Care Demographics
54. id., 2023 Child Care Demographics
55. id., Trends in Child Care
56. id., 2024 Child Care Demographics
57. id., 2024 Child Care Demographics
58. Wright, C. and S. Cook. 2024. Early Childhood Subcommittee Briefing: Child Care Scholarship Program. Presentation Maryland State Department of Education, Division of Early Childhood to the Maryland General Assembly. (January 22, 2024) Annapolis: Maryland retrieved from https://mgaleg.maryland.gov/meeting_ material/2024/app%20-%20133504156612228656%20-%20Early%20Childhood%20 Subcommittee%20-%20Briefing_MSDE_Jan22-2024_UPDATED.pdf
59. D.A. Weingarten. 2023. “As summer approaches, change to Maryland’s child care system could enroll more kids at camp.” The Herald Mail (June 7, 2023) retrieved from https://www.heraldmailmedia.com/story/news/state/2023/06/07/change-in-childcaresystem-gives-more-opportunities-can-it-continue/70288162007/
60. U.S. Department of Health and Human Services and the U.S. Department of Education. Policy Statement on Inclusion of Children with Disabilities in Early Childhood Programs. (2023) Washington DC.
61. COMAR. “Child Care Centers, Scope and Definitions: Nursery Schools.” Code of Maryland Regulations (2020) 13A.16.01(11).
62. COMAR. “Child Care Centers, Scope and Definitions: Nursery Schools.” Code of Maryland Regulations (2020) 13A.16.01(41).
63. id., 2024 Child Care Demographics
64. id., 2024 Child Care Demographics
65. Maryland State Department of Education, Division of Early Childhood (MSDE DEC). SY 2022-23 Public PreK Programs in Maryland. (2022) Baltimore: Maryland retrieved from https://earlychildhood.marylandpublicschools.org/system/files/ filedepot/2/2016_17sy_public_prekindergarten_programs_in_maryland.pdf
66. Duque, M., K. Ashley, J. Dayhoff, and S. Cook. 2023. Prekindergarten Sliding Scale Cost Modeling. Presentation Maryland State Department of Education, Division of Early Childhood to the Maryland State Board of Education. (July 25, 2023) Baltimore: Maryland retrieved from https://marylandpublicschools.org/stateboard/Documents/2023/0725/ BlueprintDeepDive-PrekindergartenSlidingScaleCostModeling.pdf
67. id., 2022 Census Report.
68. id., 2024 Child Care Demographics
69. id., 2024 Child Care Demographics
70. id., 2024 Child Care Demographics
71. id., Blueprint for Maryland’s Future.
72. Department of Legislative Services. The 90 Day Report: A Review of the 2024 Legislative Session. Maryland General Assembly. (2024) Annapolis: Maryland retrieved from https://dls.maryland.gov/pubs/prod/RecurRpt/24rs_90_Day_Report.pdf
73. Hacker, K., C. Walker, and E. Jalil. 2024. “Blueprint or budget-breaker? No one knows how to pay for Maryland’s massive education reform.” Capital News Service (March 4, 2024) retrieved from https://cnsmaryland.org/2024/03/04/democrats-lovemarylands-education-blueprint-but-no-one-knows-how-to-pay-for-it/
74. Accountability and Implementation Board. 2022. Blueprint for Maryland’s Future. AIB Blueprint Pillar 1: Early Childhood Education Implementation Goals and Timeline. (2022-2033) retrieved from https://aib.maryland.gov/Pages/1earlyeducation.aspx
75. COMAR. “Kindergarten Readiness Assessment (KRA) procedures.” Code of Maryland Regulations (2022) 13A.08.01.02-3.
76. WestEd & Center for Technology in Education (CTE). “Maryland Kindergarten Readiness Assessment (KRA) Evaluation of Racial, Cultural, or Linguistic Bias.” (2024) Baltimore, MD: retrieved from https://marylandpublicschools.org/stateboard/ Documents/2024/0227/MD-KRA-AIB-Report-Feb272024-A.pdf
77. id., Prekindergarten Sliding Scale Cost Modeling.
78. Cook, S., D. Gunning, M. Duque, K. Ashley. 2024. Prekindergarten Sliding Scale Guidance Presentation: Maryland State Department of Education, Division of Early Childhood to the Maryland State Board of Education. (February 15, 2024) Baltimore: Maryland retrieved from https://marylandpublicschools.org/stateboard/Documents/ AccountabilityCommittee/2024/Prekindergarten-Sliding-Scale-Adoption-A.pdf
79. Maryland Department of Planning. 2020. “School Enrollment Projections: Planning Assistance in Action.” Maryland Planning Blog (June 30, 2020): retrieved from https://mdplanningblog.com/2020/06/30/maryland-department-of-plannings-schoolenrollment-projections/
80. Asbury, N, V. Strauss, and O. Wiggins. 2023. “Maryland school districts struggling to comply with ‘Blueprint’ law”. The Washington Post (December 29, 2023): retrieved from https://www.washingtonpost.com/education/2023/12/29/maryland-schoolsblueprint-implementation-concerns/. Or W. Ford. 2023. “Breaking down the Blueprint: Major changes ahead as Maryland plans dramatic expansion of early childhood education.” Maryland Matters (June 19, 2023): retrieved from https://marylandmatters. org/2023/06/19/breaking-down-the-blueprint-major-changes-ahead-as-maryland-plansdramatic-expansion-of-early-childhood-education/. Or M. Friedman, and N. Weger. 2024. “Maryland’s education ‘Blueprint’ struggles to expand pre-K.” Capital News Service (March 7 2024): retrieved from https://cnsmaryland.org/2024/03/07/marylandsblueprint-struggles-to-expand-pre-k/
81. National Center for Education Statistics (NCES). 2023. “Most Public Schools Face Challenges in Hiring Teachers and Other Personnel Entering the 2023-24 Academic Year.” Press Release (October 17, 2023) to accompany School Pulse Panel dashboard release at https://nces.ed.gov/surveys/spp/results.asp
82. M. Choudhury. 2022. Maryland’s Teacher Workforce: Supply, Demand, and Diversity. Presentation: Maryland State Department of Education, Superintendent of Schools to the Maryland State Board of Education. (July 26, 2022) Baltimore: Maryland.
83. Maryland State Department of Education (MSDE). 2022. Staff Employed at School and Central Office Levels Maryland Public Schools (October 2022) Baltimore: Maryland.
84. id., 2024 Child Care Demographics
85. id., Maryland’s Teacher Workforce: Supply, Demand, and Diversity
86. Maryland State Department of Education (MSDE). 2021. Demographics of Maryland Teachers and Students. (December 2021) Baltimore: Maryland.
87. A. Hughes. 2024. “Maryland’s teacher shortage: Will the Blueprint’s plan for better pay, training do enough?” The Baltimore Sun (March 25, 2024): retrieved from https://www.baltimoresun.com/2024/03/25/blueprint-teacher-shortage/
88. id., Maryland’s Teacher Workforce: Supply, Demand, and Diversity
89. Maryland Association of Counties (MACo). 2023. Embracing without spacing: Pre-K expansion and early childhood education 2023 Summer Conference Session. (July 17, 2023)
90. id., “Maryland’s education ‘Blueprint’ struggles to expand pre-K.”
91. Price. L. 2024. “Education leaders outline ‘herculean effort’ needed to implement Blueprint reforms.” The Baltimore Sun (March 19, 2024) retrieved from https://www.baltimoresun.com/2024/03/19/blueprint-implementation-plans/
92. Asbury, N, V. Strauss, and O. Wiggins. 2023. “Maryland school districts struggling to comply with ‘Blueprint’ law.” The Washington Post (December 29, 2023) retrieved from https://www.washingtonpost.com/education/2023/12/29/marylandschools-blueprint-implementation-concerns/. Or id., Blueprint or budget-breaker? No one knows how to pay for Maryland’s massive education reform
93. id., Blueprint or budget-breaker? No one knows how to pay for Maryland’s massive education reform
94. id., Testimony in Favor SB 893 Maryland Educator Shortage Act of 2023
95. Maryland State Department of Education, (2022). Grant Information Guide: Prekindergarten Expansion Grant Program. Baltimore: Maryland retrieve from https:// earlychildhood.marylandpublicschools.org/system/files/filedepot/4/prekexpansiongig.pdf
96. C. Swanson. 2017. “Maryland EXCELS a Reliable Indicator of Quality Child Care.” Johns Hopkins University, School of Education Research HUB. (September 18, 2017): retrieved from https://education.jhu.edu/news/maryland-excels-a-reliable-indicator-ofquality-child-care/
97. Maryland State Department of Education (MSDE). 2024. Maryland EXCELS Monthly Data Report (March 2024) Baltimore: Maryland retrieved from https://earlychildhood.marylandpublicschools.org/system/files/filedepot/3/ march2024monthlydata.pdf
98. id., Maryland EXCELS
99. Darling, K.E., K. Ulmen, I. Griffith, B. Solomon, P. Banghart, R. Madill, A. Verhoye. 2024. “Providers’ and Parents’ Perceptions of and Experiences With Maryland EXCELS Child Care Quality Rating System.” Research Brief. (March 27, 2024) Child Trends. Rockville: Maryland retrieved from https://www.childtrends.org/publications/ providers-and-parents-perceptions-of-and-experiences-with-maryland-excels-child-carequality-rating-system. Or C. Swanson, D. Carran, A. Guttman, T. Wright, M. Murray, C. Alexander, and J. Nunn. 2017. “Maryland EXCELS Validation Study.” Johns Hopkins University, Baltimore: Maryland retrieved from https://marylandexcels.org/wp-content/ uploads/2017/08/Maryland-EXCELS-Validation-Study-FINAL-June-29-2017.pdf
100. U.S. Department of Health and Human Services and the U.S. Department of Education. 2023. Policy Statement on Inclusion of Children with Disabilities in Early Childhood Programs. Washington: DC.
101. U.S. Department of Health and Human Services and the U.S. Department of Education. 2016. “Policy Statement on Expulsion and Suspension Policies in Early Childhood Settings.” Washington: DC retrieved from https://eclkc.ohs.acf.hhs.gov/ publication/policy-statement-expulsion-suspension-policies-early-childhood-settings
102. COMAR. “Disciplinary Actions-Suspensions and Expulsion” Code of Maryland Regulations (2018) 13A.08.01.11 (C).
103. Harvey, H. and K. Ohle. 2018. “What’s the purpose? Educators’ perceptions and use of a state-mandated kindergarten entry assessment.” Education Policy Analysis Archives (2018) 26, 142 retrieved from https://doi.org/10.14507/epaa.26.3877. Or R. Schachter, T. Strang and S. Piasta. 2017. Teachers’ perspectives on the Kindergarten Readiness Assessment in year 2: Easier to administer but what role can it play in instruction? (Summer 2017) Columbus: Ohio. Crane Center for Early Childhood Research and Policy, The Ohio State University.
104. B. Keskin. “The myth of the well known “solution” of push-down academics.” Journal of Family Strengths 18(1) (2018) DOI: https://doi.org/10.58464/2168-670X.1382. Or H. Wasmuth, E. Nitecki. 2017. “Early childhood education policy: The global education reform movement and maintaining a developmentally appropriate focus.” Global Education Review 4(2) (2017): retrieved from http://ger.mercy.edu/index.php/ ger/article/view/383/263.
105. Domitrovich C.E., J.A. Durlak, K.C. Staley, R.P. Weissberg. “Social-Emotional Competence: An Essential Factor for Promoting Positive Adjustment and Reducing Risk in School Children.” Child Development 88 (2) (2017): 408-416. doi: 10.1111/ cdev.12739. Epub 2017 Feb 18. PMID: 28213889.
106. Gordon, R.A., A.C. Colaner, M.L. Usdansky, and C. Melgar. “Beyond an ‘Either–Or’ approach to home-and center-based child care: Comparing children and families who combine care types with those who use just one.” Early Childhood Research Quarterly, 28 (4) (2013): 918-935 doi.org/10.1016/j.ecresq.2013.05.007
107. Maryland State Department of Education, Division of Early Childhood. (MSDE DEC) “FY25 Prekindergarten Expansion Grant Information Guide.” (2024) Baltimore: Maryland retrieved from https://marylandpublicschools.org/about/Documents/OFPOS/ GAC/GrantPrograms/PreKExpansion/FY25-Pre-K-Expansion-Grant-GIG-a11y.pdf
108. id., Beyond an ‘Either–Or’ approach to home-and center-based child care: Comparing children and families who combine care types with those who use just one.
109. 2018. “Basic HHS Policy for Protection of Human Research Subjects” (45 CFR part 46, subparts B, C, and D), 2018 Amendment for IRB Code of Federal Regulations. TITLE 45: PUBLIC WELFARE; DEPARTMENT OF HEALTH AND HUMAN. SERVICES. PART 46: PROTECTION OF HUMAN SUBJECTS. §46.104. B, C, D. (2018).
110. Dalkey, N. and O. Helmer. “An Experimental Application of the DELPHI Method to the Use of Experts.” Management Science 9(3) (1963): 458-467. doi. org/10.1287/mnsc.9.3.458
111. Barrett, D. and R. Heale. “What are Delphi studies?” Evidence Based Nursing 23(3), (2020): 36-44. DOI: 10.1136/ebnurs-2020-103303
112. Phillips, D. A., N. A. Crowell, M. Whitebook, and D. Bellm. (2003). “English literacy levels of the early care and education workforce: A profile and associations with quality of care.” University of California, Berkeley. California: Center for the Study of Child Care Employment.
113. Igielnik, R., E. Grieco, and A. Castillo. 2019. “Evaluating what makes a U.S. community urban, suburban or rural.” Decoded (November 22, 2019): retrieved from Demographic Research Blog by Pew Research Center. https://www.pewresearch.org/ decoded/2019/11/22/evaluating-what-makes-a-us-community-urban-suburban-or-rural/
114. A. Giorgi. 1985. “Phenomenology and Psychological Research.” Pittsburgh, PA: Duquesne University Press.
115. D. E. Polkinghorne. 1989. Phenomenological research methods. Eds. R. S. Valle & S. Halling. Existential-phenomenological perspectives in psychology: Exploring the breadth of human experience. (1989): 41–60. Plenum Press.
116. Bartlett, J.E., J.W. Kotrlik, and C.C. Higgins. “Organizational Research: Determining Appropriate Sample Size in Survey Research.” Information Technology, Learning, and Performance Journal 19 (2001) 43-50.
117. id., Phenomenology and Psychological Research
118. id., 2024 Child Care Demographics
119. United Way of Maryland. ALICE in the Crosscurrents: An update on financial hardship in Maryland. United for ALICE (2024) Baltimore: Maryland retrieved from https://uwcm.org/alice
120. L. Stoney. 2019. “The Iron Triangle: A simple formula for financial policy in ECE programs.” Opportunities Exchange retrieved from https://info.childcareaware.org/ hubfs/OpEx_2019_IronTriangle.pdf
121. Institute of Medicine (IOM) and National Research Council (NRC). “Transforming the workforce for children birth through age 8: A unifying foundation.” (2015) Washington DC: The National Academies Press. https://doi.org/10.17226/19401
122. Kantor, K. & K. Kauerz. Eds. Goffin, S.G. & Bornfreund, L. “Do education and degrees matter?” Moving Beyond False Choices for Early Educators – A Compendium. New America. (2020) Washington: DC retrieved from https://www.newamerica. org/education-policy/reports/moving-beyond-false-choices-for-early-childhoodeducatorsa-compendium/do-education-and-degrees-matter/
Dr. Sondeania Johnson is an Early Childhood Instructional Coach, Mentor, Classroom observer, and trainer with 20 years of experience in Early Childhood Education. Dr. Johnson holds a Bachelor’s degree from Coppin State University, a Masters degree from Towson University and a Doctorate from Walden University.
Sondeania has served in the capacity as a Head Start educator, site director, school age director, before and after care director, Head Start and Family Child Care instructional coach, Pre-K Class observer and Board member for various non-profit organizations.
Dr. Johnson specializes in working with early childhood programs and non-profit organizations and is committed to helping educators and school leaders find innovative ways to transform teaching and learning for positive student outcomes. Dr. Johnson has a passion for children and families and emphasizes the importance of family engagement through research and advocacy. During her spare time, she enjoys dining, creating party favors, and watching sports.
As an instructional coach at The Family Child Care Alliance of Maryland, Desiree Taylor supports educators and business owners in their pursuit of providing highquality pre-k instruction. Additionally, she collaborates with other stakeholders on projects that will move the education industry forward.
Desiree holds a Bachelor’s degree in Early Childhood Education from Towson University and is a graduate student pursuing a Master’s of Education and certification in Instructional Technology from the University of Maryland. Desiree has almost 20 years of experience as a classroom teacher in both public and private schools. Additionally, she has over 10 years of experience as a child care director and four years of experience as a child care business owner. She joined The Family Child Care Alliance in 2022.
Desiree is a Maryland State Department of Education certified teacher for pre-k to third grade. She also holds multiple certifications in early childhood education including Child Care Administration and CLASS 2nd Edition Observer Pre-K-3rd certification.
Outside of work, Desiree enjoys baking, decorating, gardening, and spending time with family and friends.
Tiffani Martin is a native Baltimorean and a proud graduate of the Baltimore City Public School System. She began her journey toward becoming a competent, curious and reflective educator over 17 years ago. In her work supporting educators, she coaches them to become knowledgeable, skilled and cogent advocates for each and every child. Before joining the Literacy Lab in 2019, where she supports AmeriCorps tutors to deliver Reading Corp literacy interventions to K-3 students throughout Baltimore City Public Schools, she worked as Clinical Faculty with Urban Teachers for Johns Hopkins University.
Tiffani taught early childhood grades (Pre-K thru 2nd grade) before expanding her work with children into afterschool programming, particularly through curriculum development and enrichment. Her specific areas of professional interest are early childhood literacy, educator development and community activism.
Tiffani holds a B.S. in Business (Marketing) from the University of Maryland College Park and completed her M.A.T. in Elementary Education from Trinity (Washington) University.
Bill Hudson is the Executive Director of the Family Child Care Alliance of Maryland, an organization he co-founded in 2019 with a group of Maryland family child care providers and advocates. He also serves as the Project Manager for the Alliance’s ASPIRE Pre-K program which is building a ground-breaking, statewide network of high-quality Pre-K programs in family child care homes. Started in 2020, the ASPIRE PreK program has grown from an idea to a program with over seventy participating family child care educators in seventeen of Maryland’s twenty three counties, supported by a staff of thirteen. In 2020, Bill also served as the co-chair of the Maryland Family Child Care Task Force, sponsored by the Maryland State Department of Education. Prior to joining the Alliance, he served as the Chief Executive Officer for the National Association for Family Child Care (NAFCC), the only national membership/trade organization developed solely to advancing the field of family child care. In addition to supporting the association’s members, Bill worked to advance the larger Early Care and Education field by serving on the core task force of NAYEC’s Power to the Profession initiative, a national collaborative effort to reimagine the early childhood workforce. He also served on the National Birth to Age 8 Workforce committee and the Early Care and Education Innovation Collaborative, both sponsored by the National Academy of Medicine. Prior to his career shift to early childhood education, Bill spent twenty years in various leadership positions within public libraries, finishing his library career as the director of one of Pennsylvania’s largest county library systems. He has a Bachelor’s degree in psychology from the University of North Carolina at Chapel Hill and lives in Reston, VA.
Dr. Chris Swanson, formerly an Associate Research Professor at the Johns Hopkins School of Education, co-founded both the IDEALS Institute and C-IMPACT, where he currently serves as Executive Director. With 25 years in education, Swanson has been pivotal in developing the Maryland EXCELS quality rating system, chairing the Maryland Competency Workforce Committee, creating the Maryland Accreditation reliability model, and contributing significantly to early childhood, special education, and K-12 policy, research, training, and implementation at all government levels.
Before his academic career, Swanson held leadership roles as principal and national director of professional development at the online charter school operator, Connection Academy. He also served as a central office administrator and classroom teacher in Baltimore County Public Schools, specializing in autism, intellectual and behavioral challenges, and literacy. Swanson began his career at St. Elizabeth, a nonpublic school, working with students aged 14-21 with profound developmental differences.
Swanson earned Bachelor’s degrees in English and education with a minor in journalism from UMBC, and holds a Master’s of Science in Special Education and a Doctorate from Johns Hopkins University. His extensive background blends practical experience with a strong dedication to advancing educational research and policy.
Jon Farley previously served as COO at the IDEALS Institute at Johns Hopkins University. In 2023, he co-founded C-IMPACT with Dr. Swanson, using his expertise to help startups scale revenue and impact while ensuring operational stability. With a background as an analyst, operations leader in private and non-profit sectors, and a former Infantry Officer in the United States Marine Corps, Farley brings a unique perspective to overcoming organizational challenges. He emphasizes the power of data analysis for strategic direction and underscores team engagement in driving successful change.
Farley is adept at structuring rapid growth and cultivating high-performing teams, guiding projects from strategic planning through execution to achieve cost reduction, increased profitability, and sustainable growth. His prior roles include crime and intelligence analyst at the Annapolis Police Department, and managerial positions at COMSORT (later acquired by Merck & Co. Inc.) and Community Analytics. Farley holds a Bachelor’s of Arts in Administration of Justice from Pennsylvania State University and employs a leadership style rooted in Serving Leadership principles, logistical expertise, and a person-centered approach to enhance organizational excellence.

C-IMPACT is a Maryland-based nonprofit organization dedicated to dismantling silos across human services. We approach systems change uniquely to foster a more integrated human service system at both micro and macro levels. Too often sectors such as education and care, physical and mental health, and social public services, and employment operate in isolation, at times even counter-productively, despite serving the same individuals. We view the world through an ecological lens, and know we can getter outcomes for people when supports are coordinated, cross-sector, and locally led.
Our strategy to achieve this involves building a coalition of cross-sector communitybased organizations. At the micro level, we unite mission-aligned nonprofits, starting with community-based organizations, and assist them in securing resources for scalable solutions. We support these organizations in adopting collective impact approaches to collaborate effectively with others across sectors, thereby improving outcomes and bolstering their capacity to pursue larger funding opportunities, ensuring sustainability. On a macro level, we aim to unite independent nonprofits into a cohesive community with a stronger collective voice. This unity empowers them to advocate for policy changes based on their frontline experiences in the communities they serve, addressing the core issues of their missions. Currently, a significant funding disparity exists where a small percentage of nonprofits control the majority of funding. We seek to rectify this by democratizing access to essential infrastructure, expertise, and support systems that larger organizations typically enjoy. This approach enables all nonprofits to better serve their communities and contribute to a more effective human service system.
For more information, please visit www.c-impactnow.org or contact us at cswanson@c-impactnow.org.

The Family Child Care Alliance of Maryland is a collaborative network of national, state,and local partners working to advance the field of family child care for the benefit of providers, children, families, local communities, and the State of Maryland.
The ASPIRE program is designed to make it easier for qualified* family child care (FCC) providers across Maryland to participate in Maryland’s publicly funded PreK program. We believe a FCC home is a GREAT place for three and fouryear-olds to get ready for kindergarten. (*You have a four-year degree and certification by the state to teach PreK, or you have a four-year degree and are willing to take additional steps to become certified.)