AIRCRAFT ACQUISITION COMPARISON*
Curated for Mr. Andrew Braccia

Acquisition Process
NEEDS ANALYSIS JetHQ will help you determine and establish your needs for an aircraft, including aircraft type, model, year, total time, and equipment while keeping you within your operating budget.

Our operational experience gives us real world experience helping find the best plane for your needs and most importantly helping you draft a realistic operating budget
MARKET RESEARCH A thorough market analysis will help you the buyer understand the current market. With full market understanding we can help you quickly identify the best value aircraft on or off market at the time you’d like to purchase.
AIRCRAFT IDENTIFICATION
JetHQ will locate and present the best value aircraft in a clear and concise manner allowing for quick and easy side by side compar ison.
FINAL ANALYSIS In order to demonstrate value differences between final aircraft selections the JetHQ team will conduct a quantitative analysis by assigning values for equipment, condition and maintenance. This provides our clients with the simplest possible way to compare final aircraft and make a final decision.
Acquisition Process Continued
NEGOTIATION
JetHQ will negotiate on your behalf the best possible price and terms on selected aircraft which are all subject to a pre -purchase evaluation.

A mutually agreeable location for pre-purchase inspection will be agreed upon once JetHQ highly experienced in-house maintenance staff has reviewed the aircraft and its technical logbooks and maintenance reports.
PRE-PURCHASE INSPECTION
The JetHQ leadership team, maintenance team, highly experienced pilot staff, and knowledgeable administrative staff will represent you during the entire prepurchase inspection process including a comprehensive pre-purchase evaluation of airframe, engine and avionics at the service provider of your choice. The evaluation will include a verification of equipment, logbook research, maintenance history, inspection status and current one-year maintenance projections.
CLOSING
With everything in place up to this point, JetHQ will work with the Title company, buyer, and seller to ensure a smooth conclusion to your acquisition processes as evidenced by a seamless and timely closing.
DELIVERY AND OPERATING EXPERIENCE
JetHQ will prepare all delivery receipt documents, work to recruit and train aviation personnel. If desired, we can also provide turn-key aircraft management allowing you to get in the air fast. Our ability to take you from closing to flying is unrivalled.
Specification Comparison*
* Data Sourced from 3rd Party Industry Aircraft Cost and Performance Platforms.
Fuselage Dimensions CL 300 CL 350 LONGITUDE SOVEREIGN+ F2000EX EASy F2000LX PRAETOR 600 G280 G450 Length 68.6 (ft) 68.7 (ft) 73.2 (ft) 63.5 (ft) 66.3 (ft) 66.4 (ft) 68.1 (ft) 66.8 (ft) 89.3 (ft) Height 20.0 (ft) 20.0 (ft) 19.4 (ft) 20.3 (ft) 23.2 (ft) 23.2 (ft) 21.2 (ft) 21.3 (ft) 25.2 (ft) Wing Span 63.8 (ft) 69.0 (ft) 68.9 (ft) 72.3 (ft) 63.4 (ft) 70.2 (ft) 70.5 (ft) 63.0 (ft) 77.8 (ft) Cabin Dimensions Length 25' 2'' (ft)(in) 25' 2'' (ft)(in) 25' 2'' (ft)(in) 25' 3'' (ft)(in) 26' 2'' (ft)(in) 26' 2'' (ft)(in) 24' 1'' (ft)(in) 25' 8'' (ft)(in) 37' 0'' (ft)(in) Height 6' 1'' (ft)(in) 6' 0'' (ft)(in) 6' 0'' (ft)(in) 5' 7'' (ft)(in) 6' 2'' (ft)(in) 6' 2'' (ft)(in) 6' 0'' (ft)(in) 6' 1'' (ft)(in) 6' 2'' (ft)(in) Width 7' 2'' (ft)(in) 7' 2'' (ft)(in) 6' 4'' (ft)(in) 5' 5'' (ft)(in) 7' 8'' (ft)(in) 7' 8'' (ft)(in) 6' 8'' (ft)(in) 6' 9'' (ft)(in) 7' 3'' (ft)(in) Cabin Volume 930 (cb ft) 930 (cb ft) 755 (cb ft) 585 (cb ft) 1,028 (cb ft) 1,028 (cb ft) 705 (cb ft) 935 (cb ft) 1,658 (cb ft) Baggage Volume 106 (cb ft) 106 (cb ft) 112 (cb ft) 135 (cb ft) 131 (cb ft) 131 (cb ft) 155 (cb ft) 154 (cb ft) 169 (cb ft) Typical Configuration Crew 2 2 2 2 2 2 2 2 3 Passengers 8 11 12 9 10 10 12 10 14 Pressurization 8.8 (psi) 8.8 (psi) 9.7 (psi) 9.3 (psi) 9.3 (psi) 9.3 (psi) 9.7 (psi) 9.2 (psi) 9.6 (psi) Fuel Capacity Standard 2,096 (gal) 2,112 (gal) 2,164 (gal) 1,700 (gal) 2,487 (gal) 2,487 (gal) 2,409 (gal) 2,179 (gal) 4,370 (gal) Weight Max. Ramp 39,000 (lbs) 40,750 (lbs) 39,700 (lbs) 31,025 (lbs) 42,200 (lbs) 43,000 (lbs) 42,990 (lbs) 39,750 (lbs) 75,000 (lbs) Max. Takeoff 38,850 (lbs) 40,600 (lbs) 39,500 (lbs) 30,775 (lbs) 42,200 (lbs) 42,800 (lbs) 42,857 (lbs) 39,600 (lbs) 74,600 (lbs) Zero Fuel 27,000 (lbs) 28,200 (lbs) 26,800 (lbs) 21,000 (lbs) 29,700 (lbs) 29,700 (lbs) 28,660 (lbs) 28,200 (lbs) 49,000 (lbs) Basic Operating 23,500 (lbs) 24,800 (lbs) 23,600 (lbs) 18,311 (lbs) 24,000 (lbs) 23,585 (lbs) 24,658 (lbs) 24,200 (lbs) 43,200 (lbs) Max. Landing 33,750 (lbs) 34,150 (lbs) 33,500 (lbs) 27,575 (lbs) 39,300 (lbs) 39,300 (lbs) 37,478 (lbs) 32,700 (lbs) 66,000 (lbs)
Specification Comparison Continued*
* Data Sourced from 3rd Party Industry Aircraft Cost and Performance Platforms. ** Range calculation created using general parameters of 2 Crew | 5 PAX.
Speed CL 300 CL 350 LONGITUDE SOVEREIGN+ F2000EX EASy F2000LX PRAETOR 600 G280 G450 Normal Cruise TAS 459 (kn) 459 (kn) 449 (kn) 444 (kn) 459 (kn) 453 (kn) 433 (kn) 459 (kn) 476 (kn) Vmo (Max Op) IAS 320 (kn) 320 (kn) 325 (kn) 305 (kn) 368 (kn) 377 (kn) 320 (kn) 340 (kn) 340 (kn) V1 Takeoff 116 (kn) 127 (kn) 131 (kn) 112 (kn) 110 (kn) 126 (kn) 123 (kn) 132 (kn) 140 (kn) Climb Normal 4,240 (fpm) 2,643 (fpm) 2,846 (fpm) 4,846 (fpm) 4,375 (fpm) 4,350 (fpm) 0 (fpm) 5,000 (fpm) 4,213 (fpm) Engine Out 474 (fpm) 552 (fpm) 1,330 (fpm) 735 (fpm) 490 (fpm) 490 (fpm) 777 (fpm) 680 (fpm) 712 (fpm) Ceiling 45,000 (ft) 45,000 (ft) 45,000 (ft) 47,000 (ft) 47,000 (ft) 47,000 (ft) 45,000 (ft) 45,000 (ft) 45,000 (ft) Landing Performance FAA Field Length 2,290 (ft) 2,303 (ft) 2,595 (ft) 2,149 (ft) 4,333 (ft) 2,260 (ft) 2,165 (ft) 2,365 (ft) 2,663 (ft) Takeoff Performance SL ISA BFL 4,810 (ft) 4,835 (ft) 4,810 (ft) 3,530 (ft) 5,585 (ft) 4,675 (ft) 4,717 (ft) 4,750 (ft) 5,600 (ft) 5000' +20C BFL 6,860 (ft) 6,809 (ft) 6,810 (ft) 4,788 (ft) 7,535 (ft) 6,840 (ft) 6,431 (ft) 7,320 (ft) 8,200 (ft) Range Range** 3,138 (nm) 3,308 (nm) 3,561(nm) 2,826 (nm) 3,980 (nm) 4,038 (nm) 4,196 (nm) 3,067 (nm) 3,991 (nm) Engines Number of 2 2 2 2 2 2 2 2 2 Honeywell Aerospace HTF7000 Honeywell HTF7350 Honeywell HTF7700L Pratt & Whitney Canada PW306D Pratt & Whitney Canada PW308C Pratt & Whitney Canada PW308C Honeywell Aerospace HTF7500E Honeywell HTF7250G Rolls-Royce Deutschland, Ltd. & Co. KG BR710A2-20 Honeywell Aerospace HTF7350 - - - - - - - Rolls-Royce Tay MK 611-8C Thrust (per engine) 7,000 (lbs) 7,323 (lbs) 7,600 (lbs) 5,907 (lbs) 7,002 (lbs) 7,002 (lbs) 7,036 (lbs) 7,624 (lbs) 13,850 (lbs)
Make/Model(s)
Cost Of Ownership Comparison Analysis*
Cost reflected here are for proforma only and are only estimate usage only.
* Data Sourced from 3rd Party Industry Aircraft Cost and Performance Platforms.
CL300 CL350 LONGITUDE SOVEREIGN+ F200EX EASy F2000LX PRAETOR 600 G280 G450 Variable Operating Costs 175 Annual Hours 175 Annual Hours 175 Annual Hours 175 Annual Hours 175 Annual Hours 175 Annual Hours 175 Annual Hours 175 Annual Hours 175 Annual Hours Fuel Consumption 295 Gal/Hr 297 Gal/Hr 316 Gal/Hr 274 Gal/Hr 284 Gal/Hr 280 Gal/Hr 298 Gal/Hr 286 Gal/Hr 517 Gal/Hr Fuel Expense $283,937.50 $285,862.50 $304,150.00 $263,725.00 $273,350.00 $269,500.00 $286,825.00 $275,275.00 $497,612.50 Engine Reserves $149,275.00 $155,225.00 $147,875.00 $131,250.00 $164,500.00 $164,500.00 $147,875.00 $168,525.00 $192,325.00 Unscheduled and Scheduled Maintenance $59,500.00 $54,425.00 $47,425.00 $46,200.00 $55,300.00 $55,300.00 $32,550.00 $51,275.00 $53,375.00 Trip Expenses (Landing Fees, Customs, etc.) $20,125.00 $20,125.00 $20,125.00 $20,125.00 $20,125.00 $20,125.00 $20,125.00 $20,125.00 $20,125.00 $512,837.50 $515,637.50 $519,575.00 $461,300.00 $513,275.00 $509,425.00 $487,375.00 $515,200.00 $763,437.50 Total Owner Flying Operating Costs
Ownership Summary (Monthly) CL300 CL350 LONGITUDE SOVEREIGN+ F200EX EASy F2000LX PRAETOR 600 G280 G450 Total Cost of Ownership $104,028.29 $102,207.29 $96,955.75 $91,108.42 $112,923.25 $114,665.17 $101,405.00 $104,863.92 $143,097.71 $0.00 $0.00 $0.00 $0.00 $0.00 $0.00 $0.00 $0.00 $0.00 -$104,028.29 -$102,207.29 -$96,955.75 -$91,108.42 -$112,923.25 -$114,665.17 -$101,405.00 -$104,863.92 -$143,097.71 Gross Charter Income NET OPERATIONS COST / INCOME (Monthly) Ownership Summary (Yearly) CL300 CL350 LONGITUDE SOVEREIGN+ F200EX EASy F2000LX PRAETOR 600 G280 G450 Total Cost of Ownership $1,248,339.50 $1,226,487.50 $1,163,469.00 $1,093,301.00 $1,355,079.00 $1,375,982.00 $1,216,860.00 $1,258,367.00 $1,717,172.50 $0.00 $0.00 $0.00 $0.00 $0.00 $0.00 $0.00 $0.00 $0.00 -$1,248,339.50 -$1,226,487.50 -$1,163,469.00 -$1,093,301.00 -$1,355,079.00 -$1,375,982.00 -$1,216,860.00 -$1,258,367.00 -$1,717,172.50 Gross Charter Income NET OPERATIONS COST / INCOME (YEARLY)
Fixed Cost Of Ownership Comparison Analysis*
* Data Sourced from 3rd Party Industry Aircraft Cost and Performance Platforms.
Fixed Operating Costs CL300 CL350 LONGITUDE SOVEREIGN+ F200EX EASy F2000LX PRAETOR 600 G280 G450 Management Company Fee $96,000.00 $96,000.00 $96,000.00 $96,000.00 $96,000.00 $96,000.00 $96,000.00 $96,000.00 $96,000.00 Captain Salary $171,000.00 $175,000.00 $162,000.00 $160,000.00 $180,000.00 $185,000.00 $165,000.00 $170,000.00 $200,000.00 First Officer Salary $92,000.00 $95,000.00 $95,000.00 $90,100.00 $130,000.00 $130,000.00 $93,000.00 $99,000.00 $125,000.00 Crew Benefits $13,150.00 $13,500.00 $12,850.00 $12,505.00 $15,500.00 $15,750.00 $12,900.00 $13,450.00 $16,250.00 Flight Crew Recurrent Training $58,000.00 $62,500.00 $55,000.00 $58,000.00 $92,000.00 $96,000.00 $58,000.00 $66,000.00 $115,000.00 Hull Insurance per $100 $34,675.00 $37,750.00 $35,094.00 $32,211.00 $36,450.00 $45,630.00 $35,991.00 $32,000.00 $52,650.00 Liability Insurance per $M $23,400.00 $26,500.00 $22,400.00 $20,100.00 $19,950.00 $22,400.00 $22,400.00 $22,000.00 $36,400.00 Hangar/Office $59,500.00 $16,000.00 $60,000.00 $48,300.00 $101,230.00 $101,230.00 $62,000.00 $63,500.00 $112,000.00 Maint. Software Programs $8,142.00 $8,455.00 $2,800.00 $1,775.00 $7,500.00 $8,362.00 $8,654.00 $12,000.00 $9,335.00 Nav Database $48,500.00 $48,500.00 $0.00 $11,500.00 $32,114.00 $34,500.00 $44,500.00 $33,500.00 $56,450.00 EGPWS/TAWS Database $6,995.00 $6,995.00 $5,500.00 $4,300.00 $6,995.00 $6,995.00 $6,995.00 $7,250.00 $7,100.00 Flight Planning $42,000.00 $42,000.00 $25,200.00 $23,940.00 $42,000.00 $42,000.00 $42,000.00 $44,400.00 $42,000.00 WxServices $16,800.00 $16,800.00 $13,200.00 $15,000.00 $16,800.00 $16,800.00 $18,000.00 $16,800.00 $19,200.00 Charts & Maps $29,400 $29,400 $29,400 $29,400 $29,400 $29,400 $29,400 $29,400 $29,400 Air to Ground $22,740.00 $23,250.00 $16,250.00 $15,670.00 $22,665.00 $23,290.00 $21,445.00 $24,667.00 $23,750.00 Cabin/Iridium Phone $13,200 $13,200 $13,200 $13,200 $13,200 $13,200 $13,200 $13,200 $13,200 Total Fixed Costs $735,502.00 $710,850.00 $643,894.00 $632,001.00 $841,804.00 $866,557.00 $729,485.00 $743,167.00 $953,735.00
Bombardier Challenger 300 Dimensions*

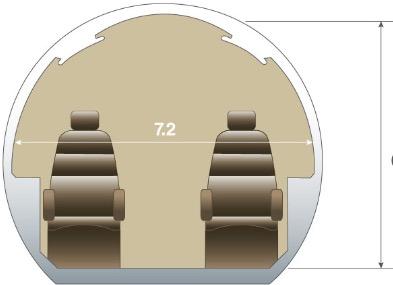
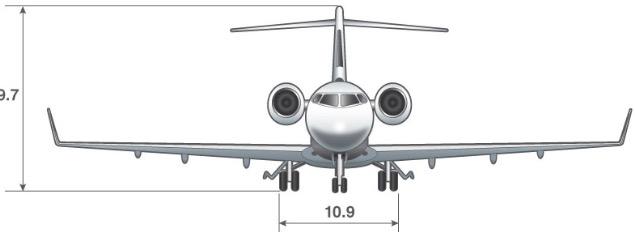
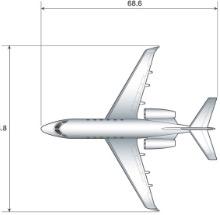

63.8 68.6 10.9 19.7 6.1 27.8
* Data Sourced from 3rd Party Industry Aircraft Cost and Performance Platforms.
Bombardier Challenger 300 Interior*


* Data Sourced from 3rd Party Industry Aircraft Cost and Performance Platforms. Note: Alternate Configurations May Be Available


Challenger 350 Dimensions*


* Data Sourced from 3rd Party Industry Aircraft Cost and Performance Platforms.

27.8 68.6
63.8 19.7 10.9
Challenger 350 Interior*


* Data Sourced from 3rd Party Industry Aircraft Cost and Performance Platforms. Note: Alternate Configurations May Be Available


Citation Longitude Dimensions*


29.0 73.1 68.9 26.0 11.4
* Data Sourced from 3rd Party Industry Aircraft Cost and Performance Platforms.
Citation Longitude Interior*
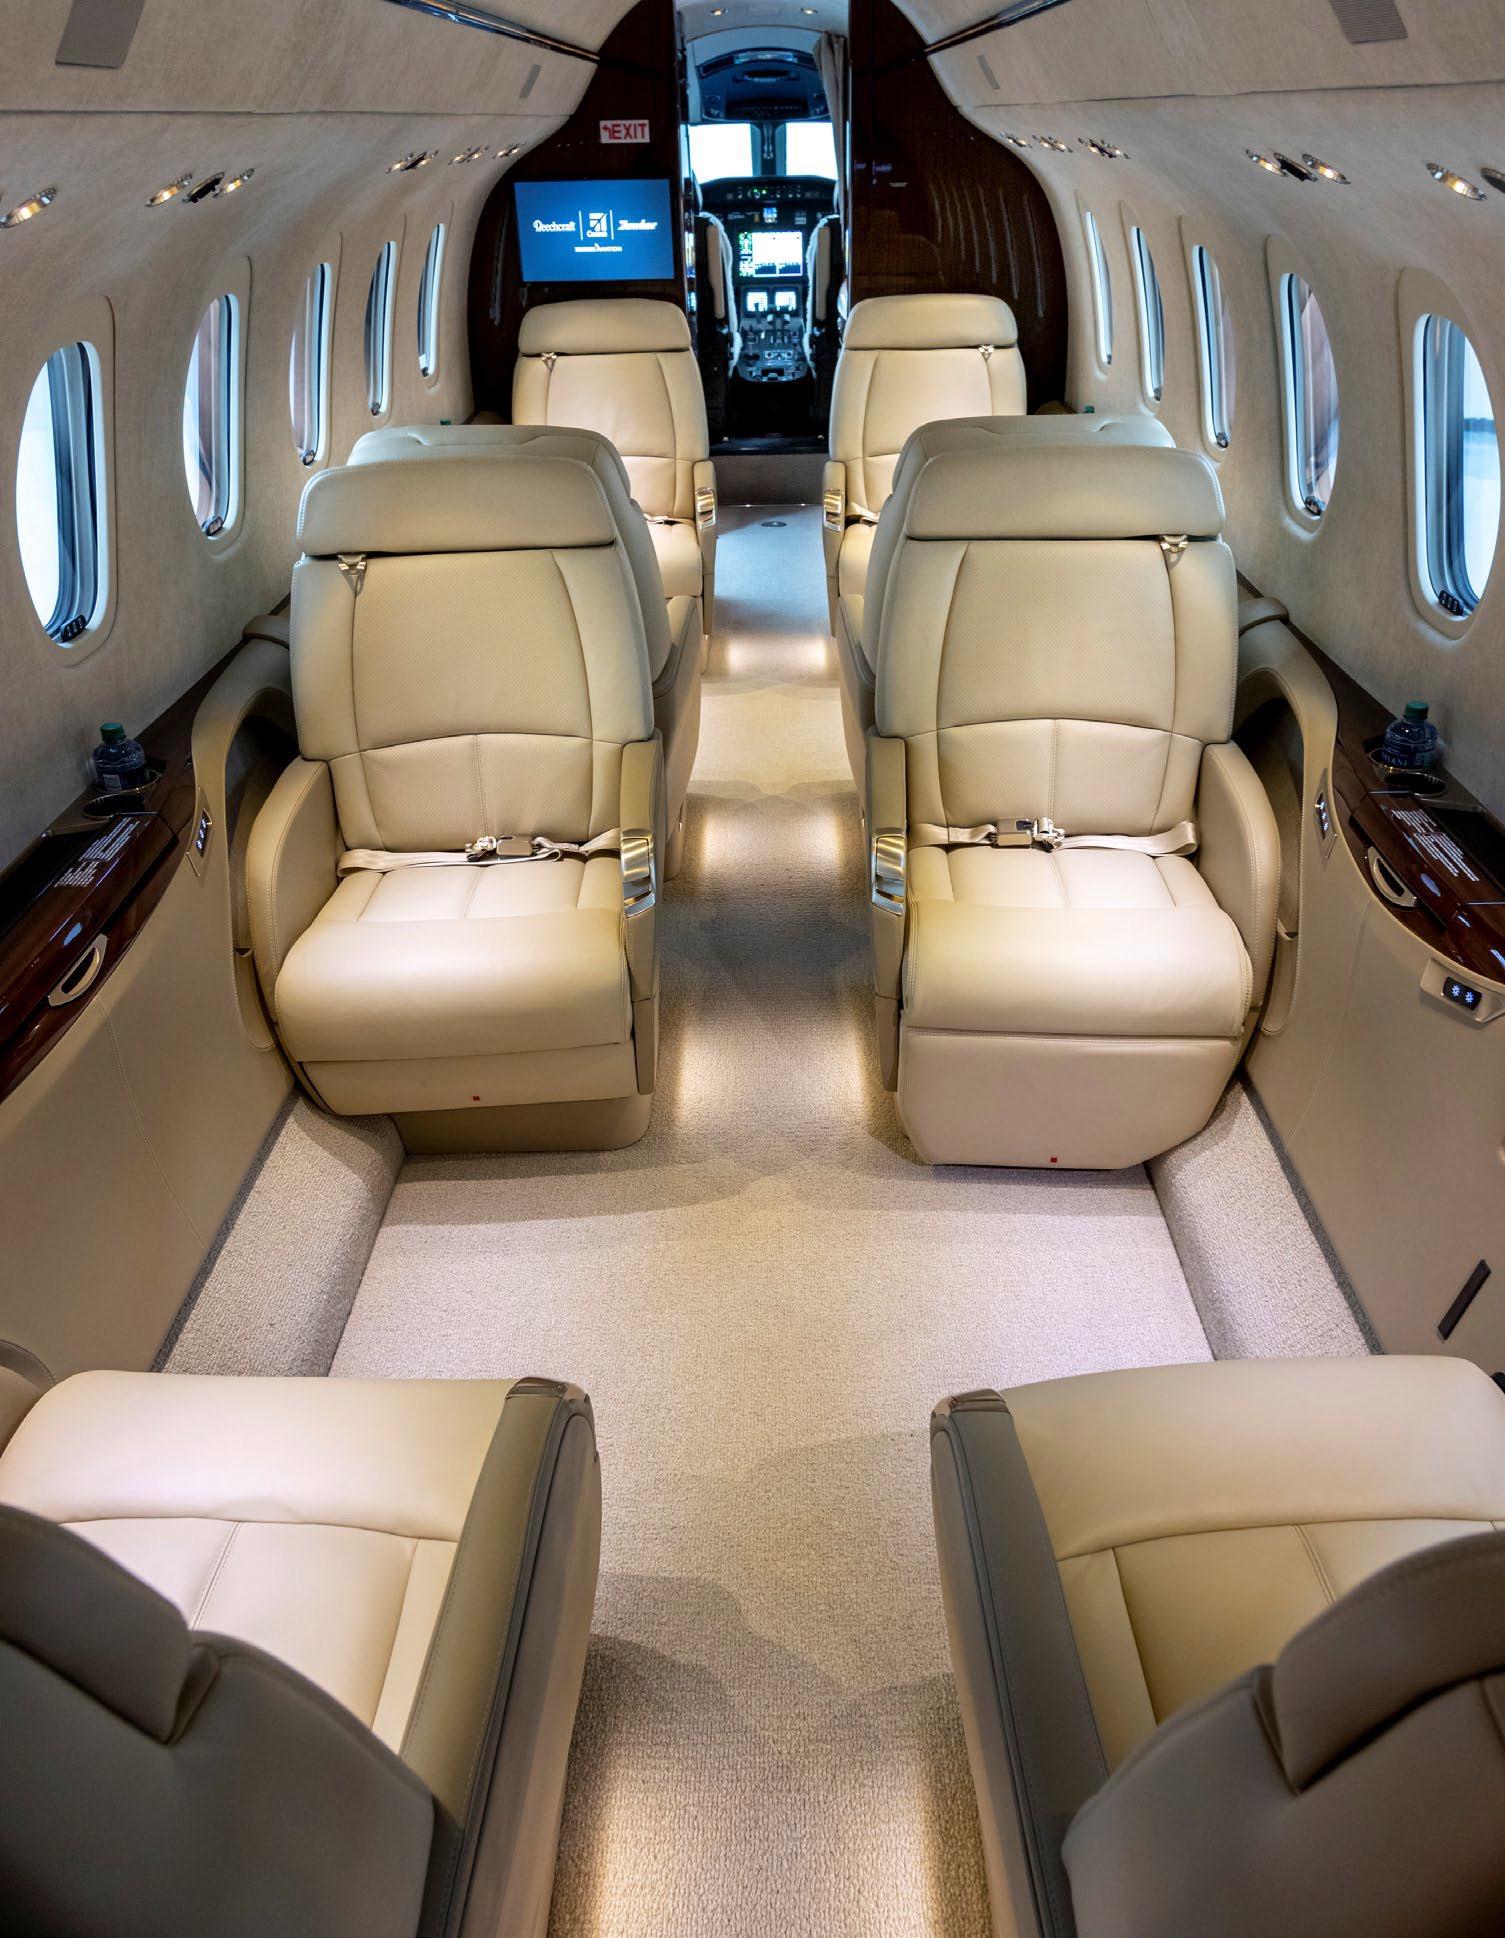


* Data Sourced from 3rd Party Industry Aircraft Cost and Performance Platforms. Note: Alternate Configurations May Be Available

Citation Sovereign+ Dimensions*
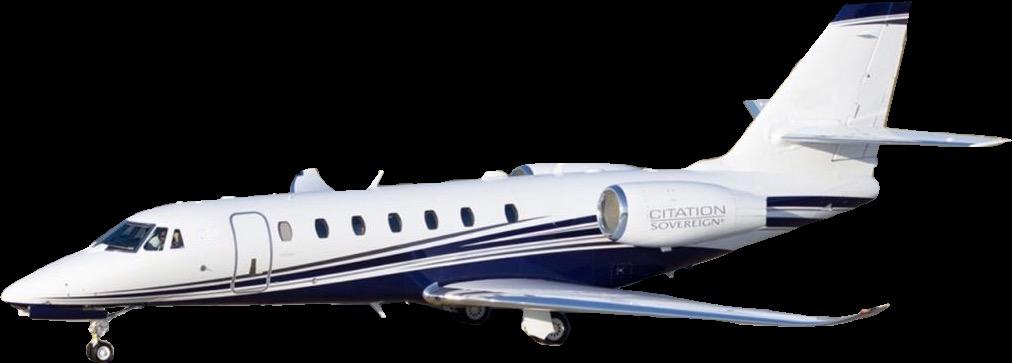
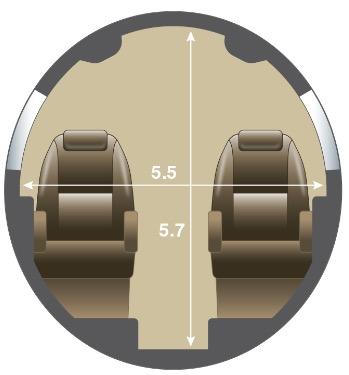

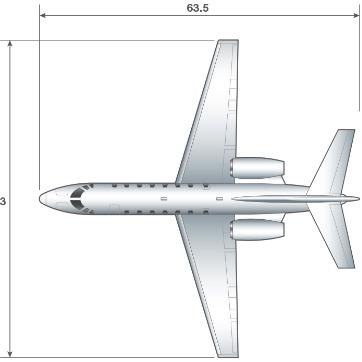

63.3 63.5 10.0 20.3 27.8
* Data Sourced from 3rd Party Industry Aircraft Cost and Performance Platforms.
Citation Sovereign+ Interior*

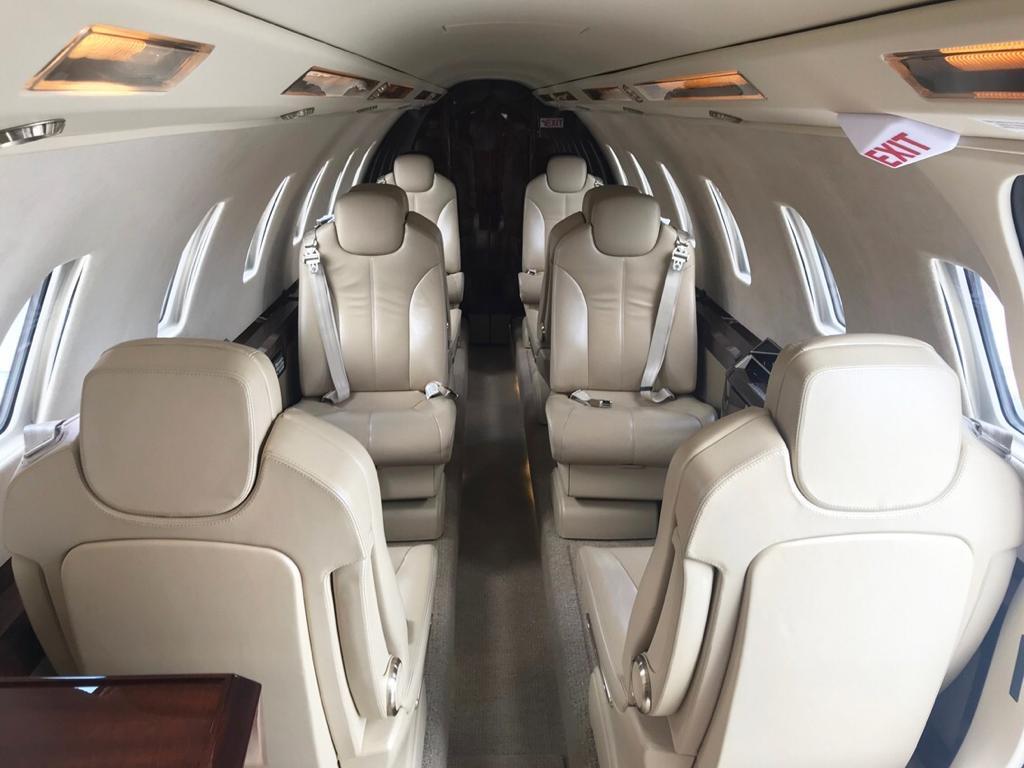


* Data Sourced from 3rd Party Industry Aircraft Cost and Performance Platforms. Note: Alternate Configurations May Be Available


Falcon 2000EX EASy Dimensions*

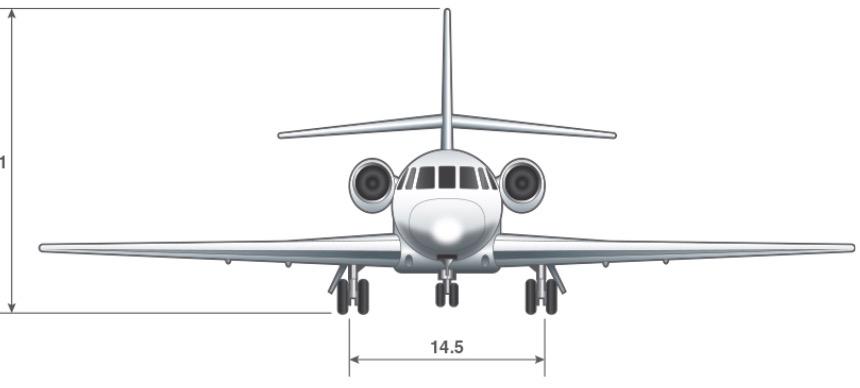


* Data Sourced from 3rd Party Industry Aircraft Cost and Performance Platforms.

66.3 66.4 24.2 23.1 14.5
Falcon 2000EX EASy Interior*
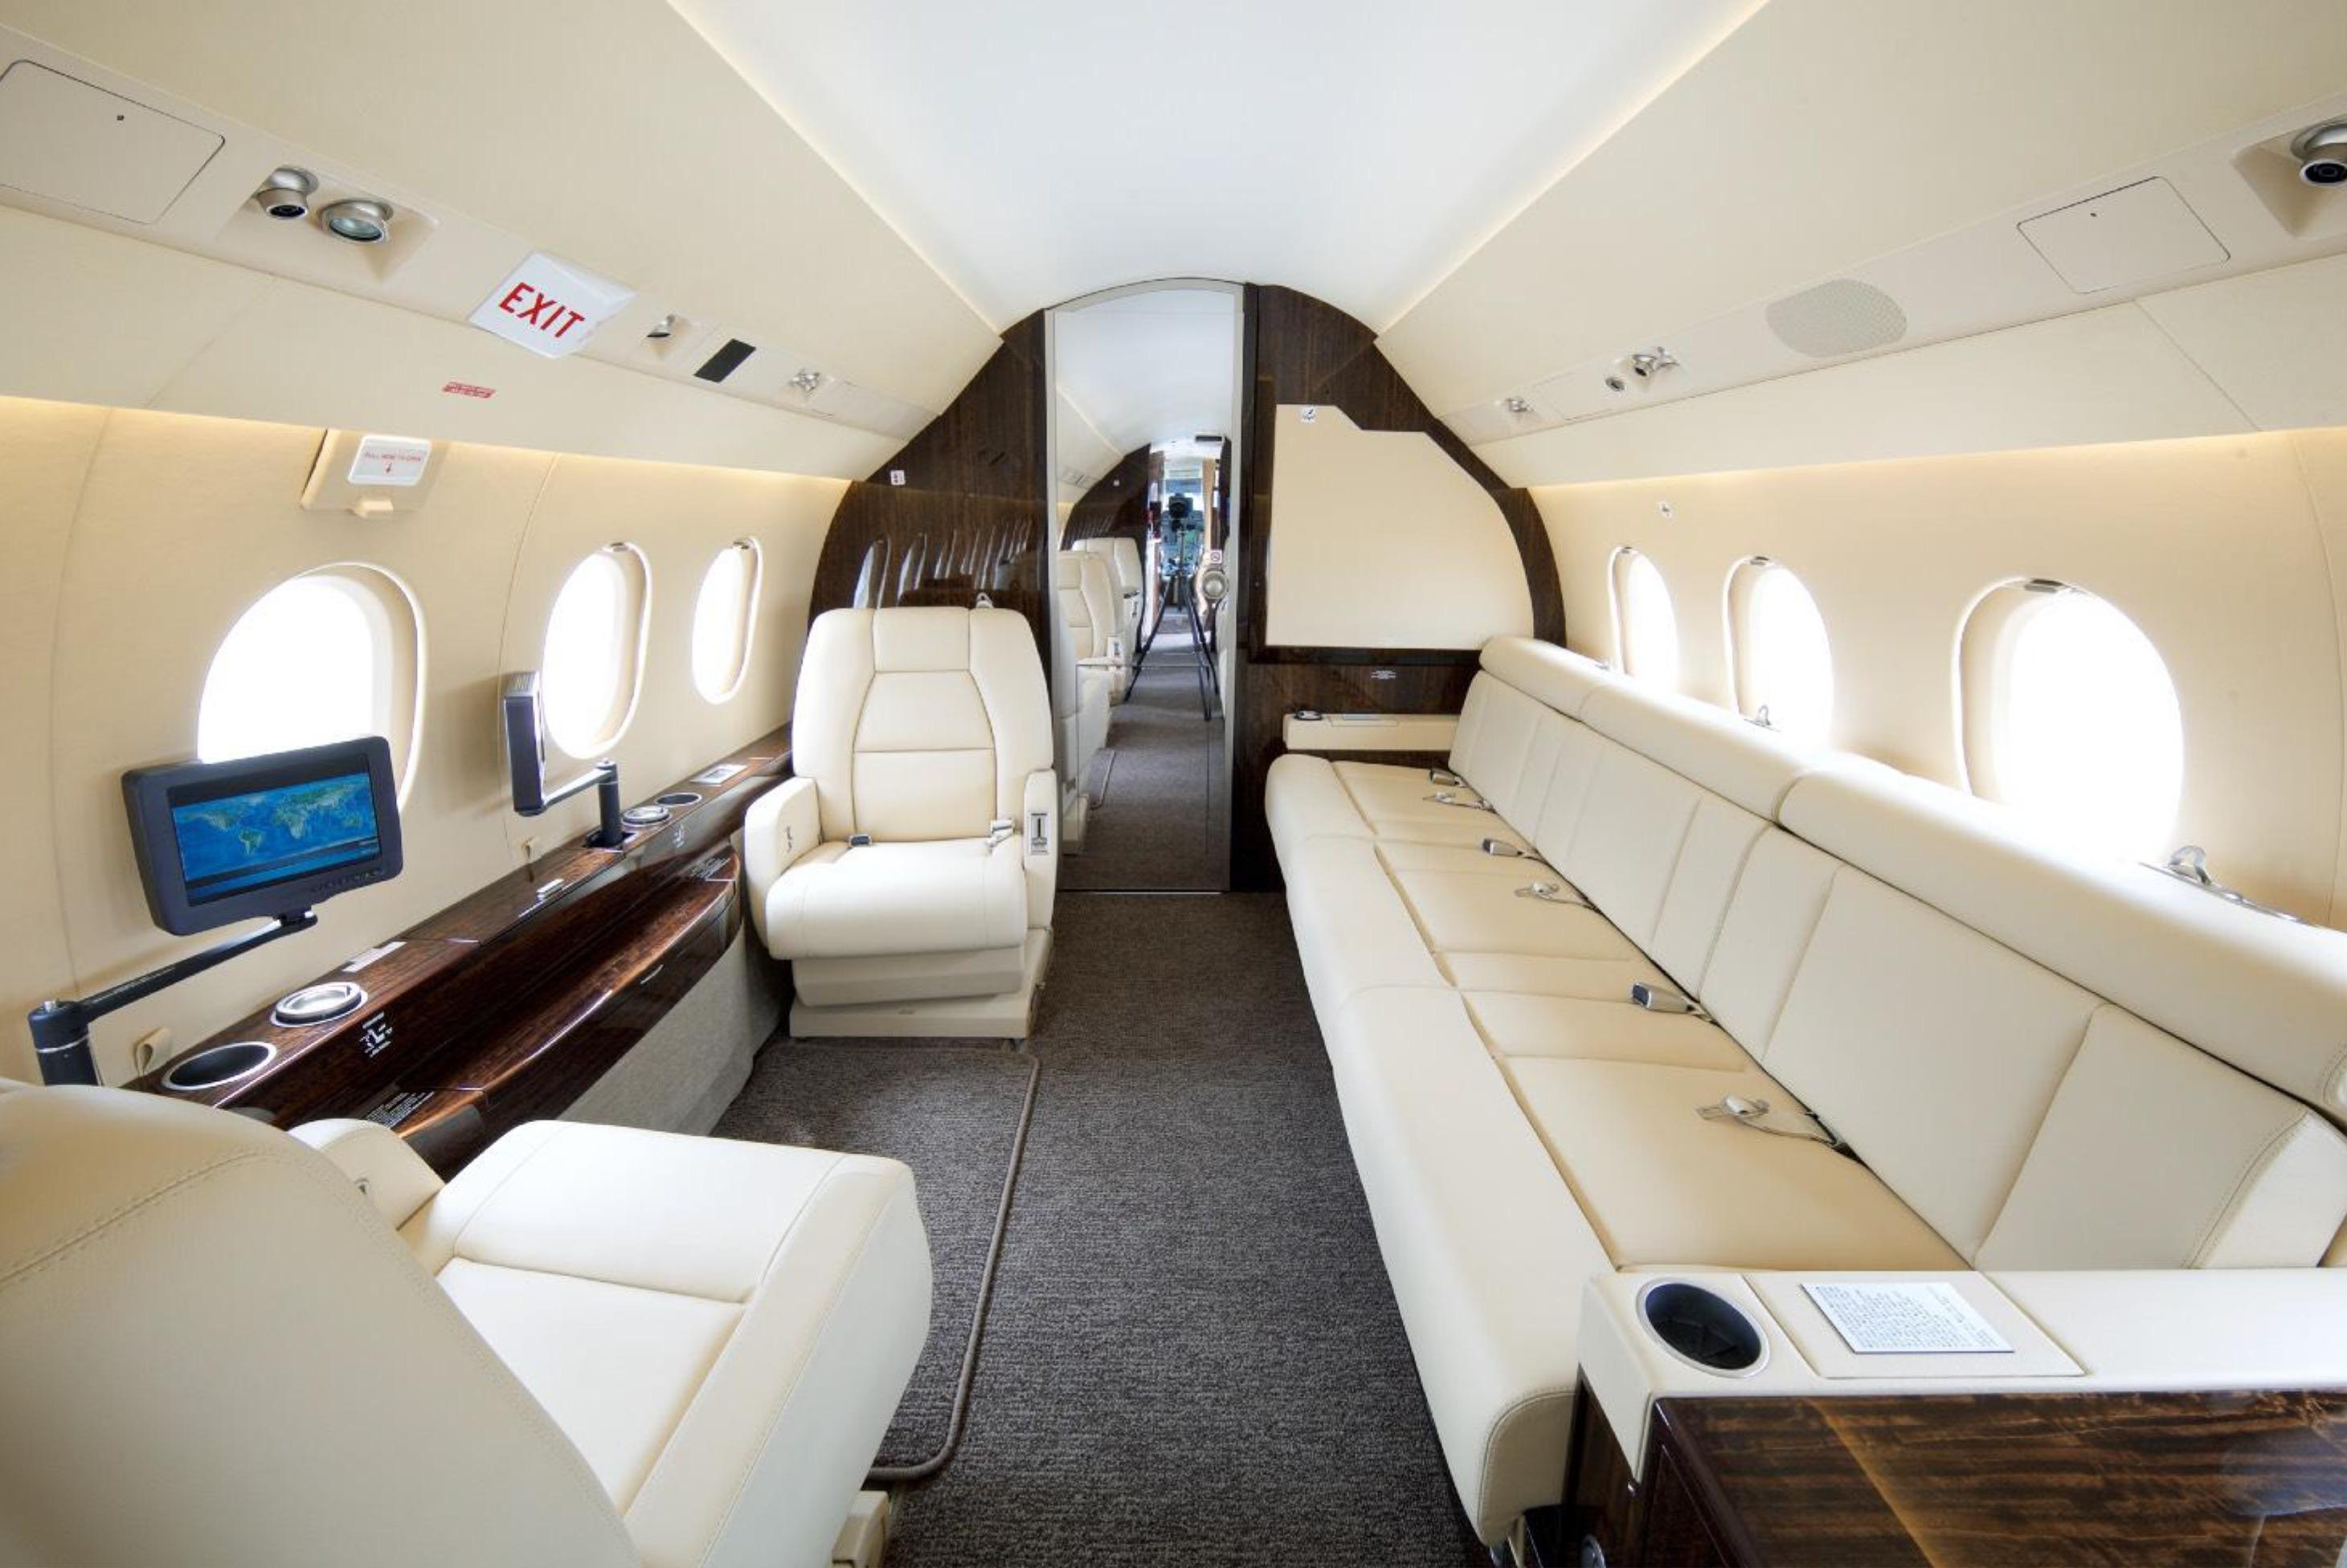
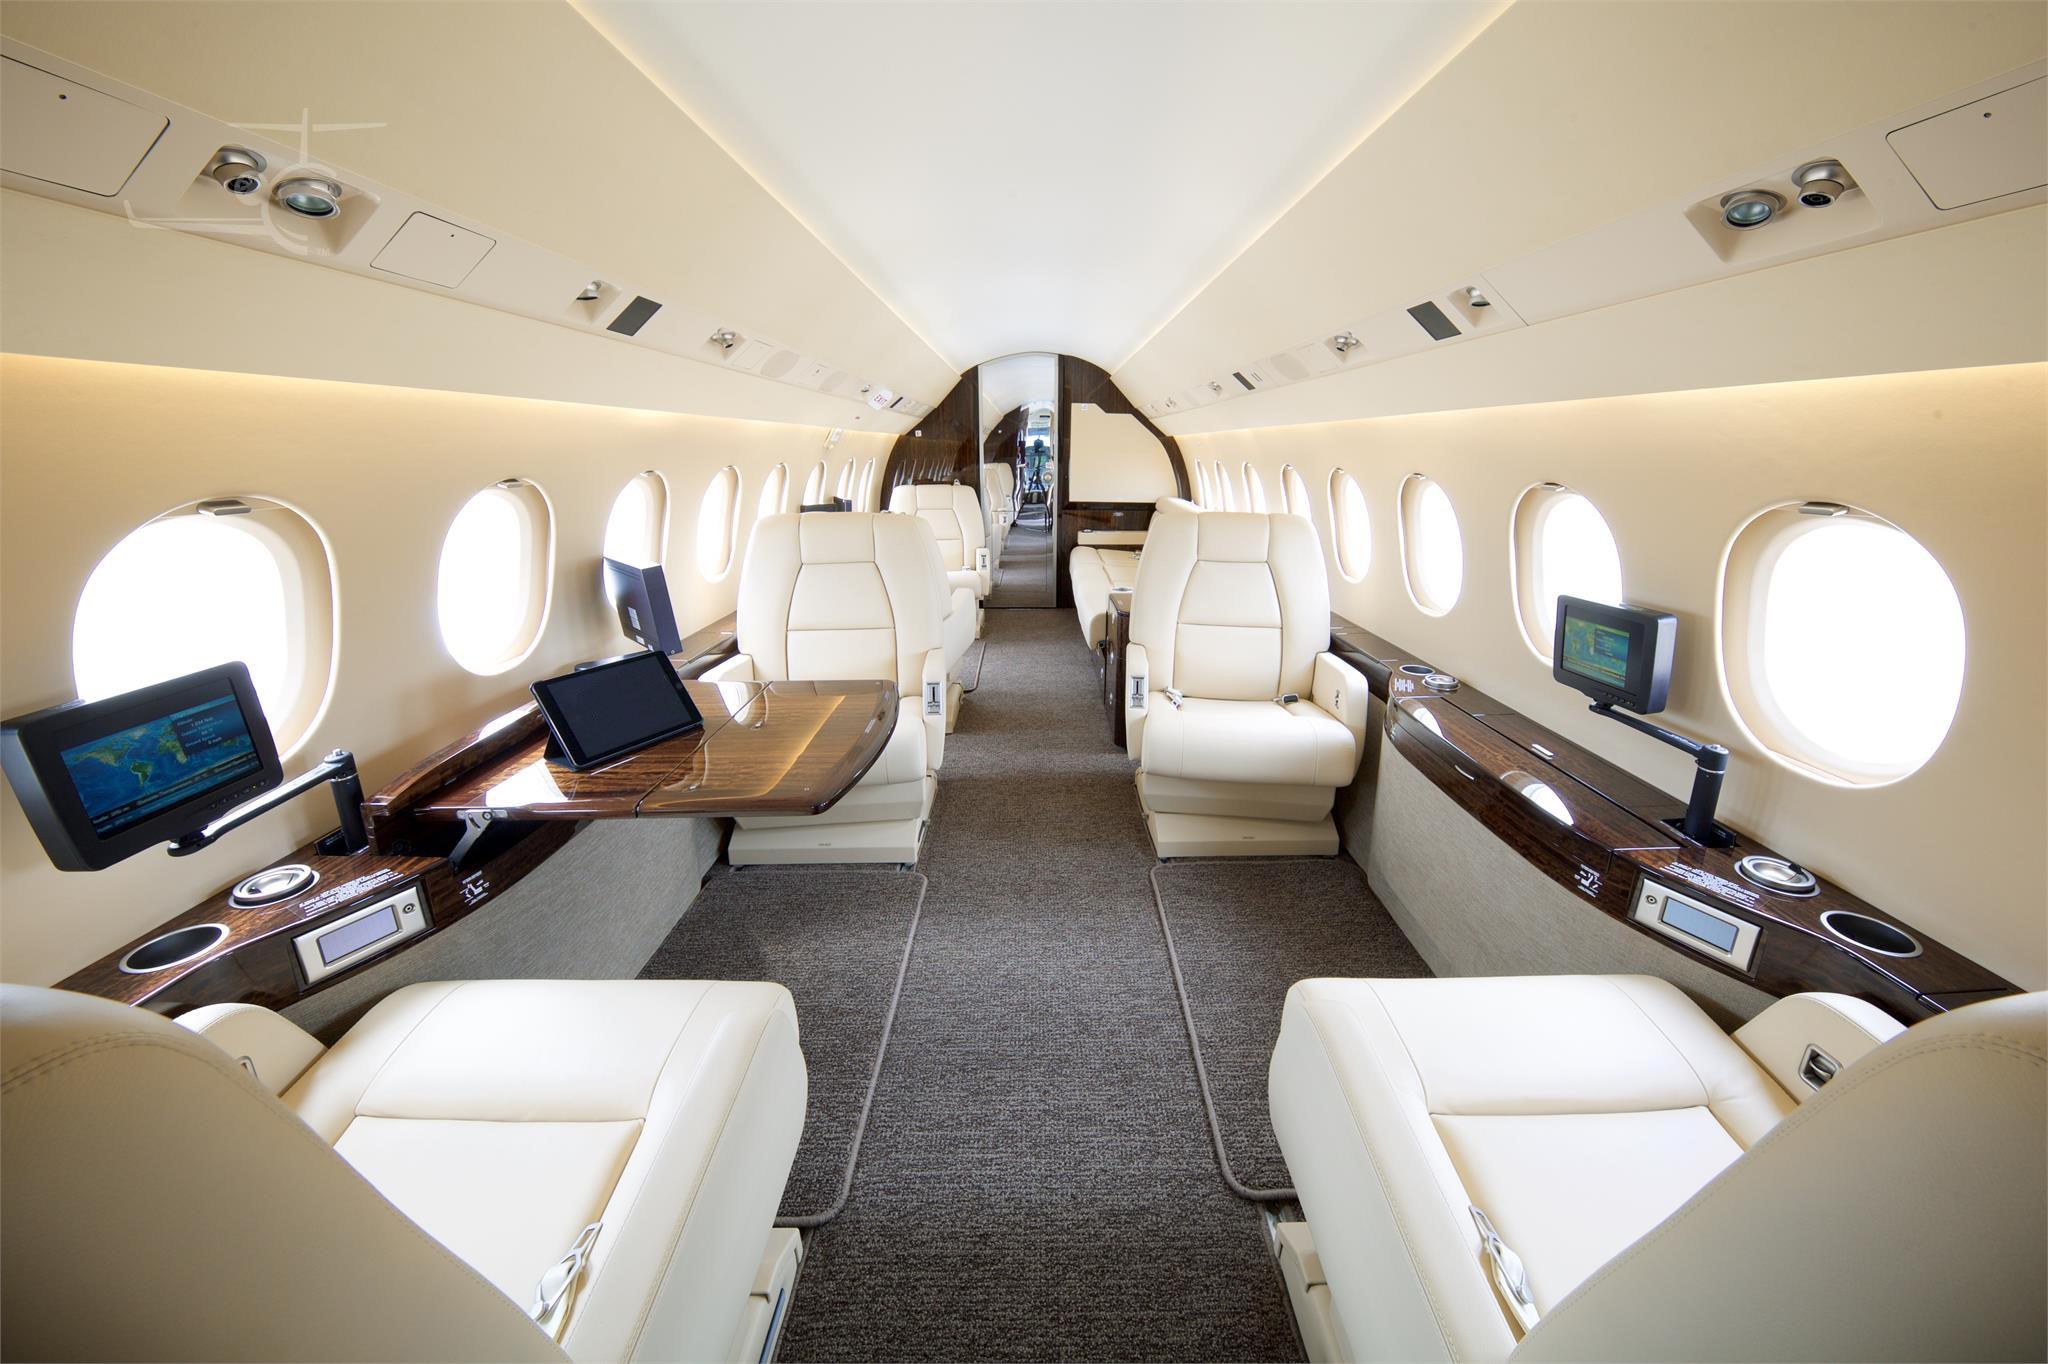


* Data Sourced from 3rd Party Industry Aircraft Cost and Performance Platforms. Note: Alternate Configurations May Be Available


Falcon 2000LX Dimensions*
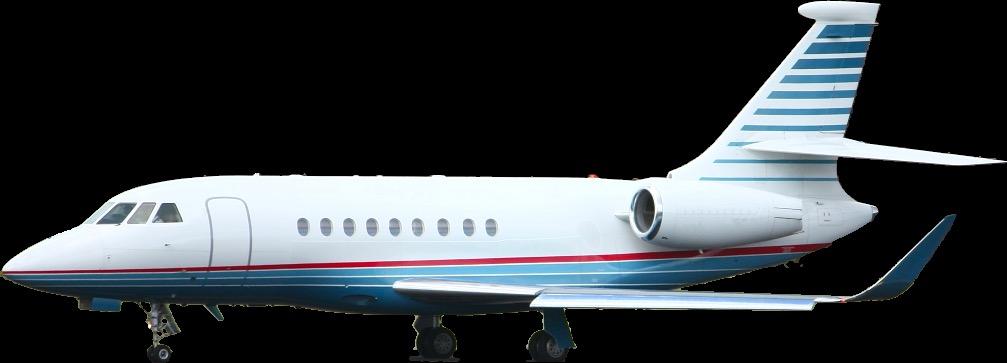

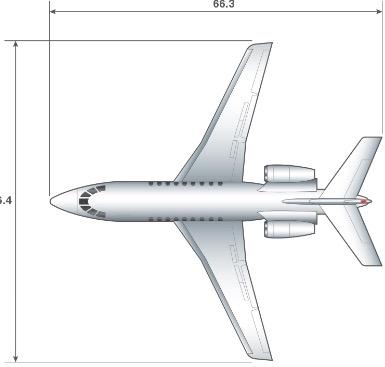


24.2 66.3 66.4 14.5 23.1
* Data Sourced from 3rd Party Industry Aircraft Cost and Performance Platforms.
Dassault Falcon 2000LX Interior*

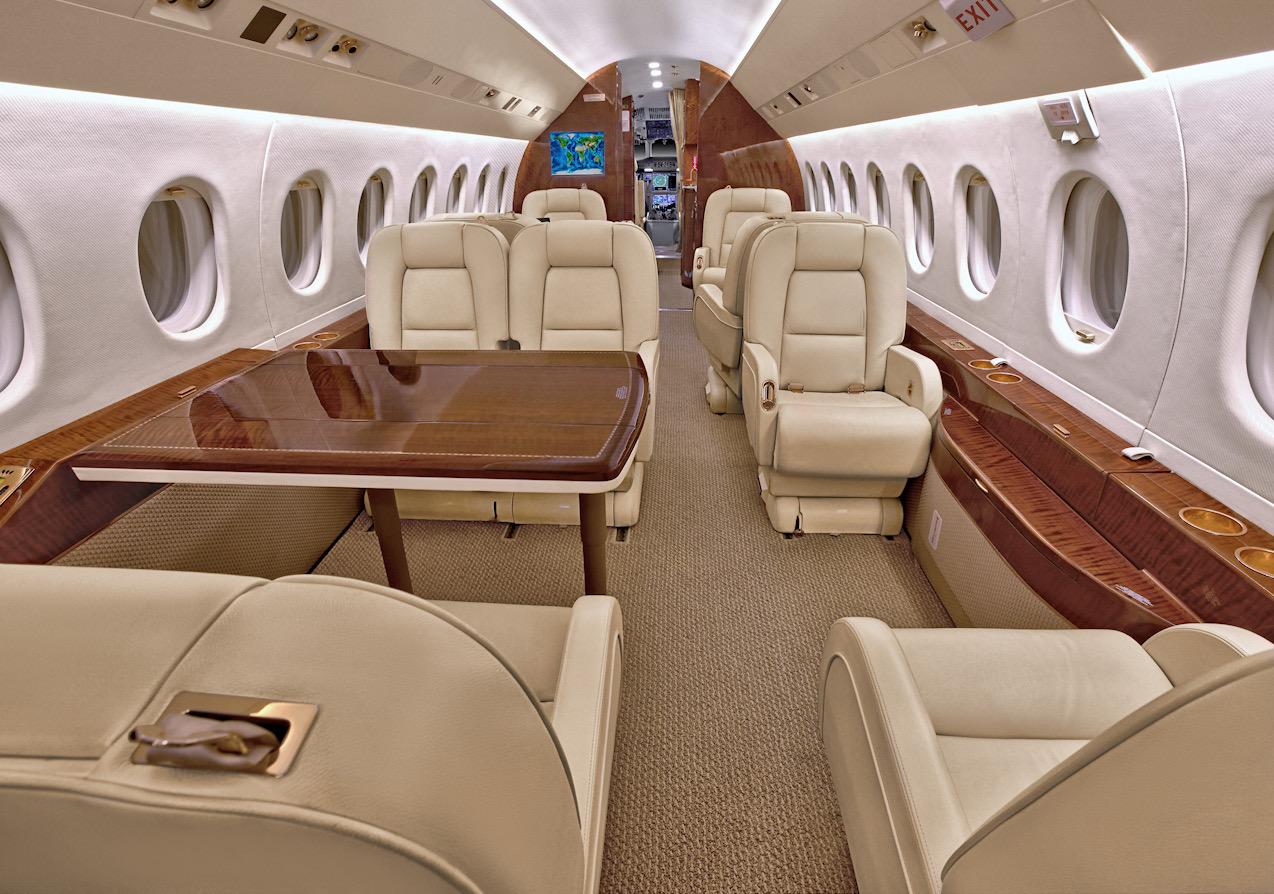


* Data Sourced from 3rd Party Industry Aircraft Cost and Performance Platforms. Note: Alternate Configurations May Be Available


Embraer Praetor 600 Dimensions*
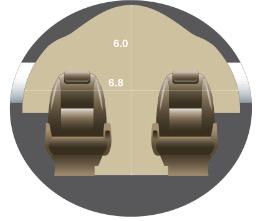


28.5 21.1 11.1 68.1 70.5
* Data Sourced from 3rd Party Industry Aircraft Cost and Performance Platforms.
Embraer Praetor 600 Interior*
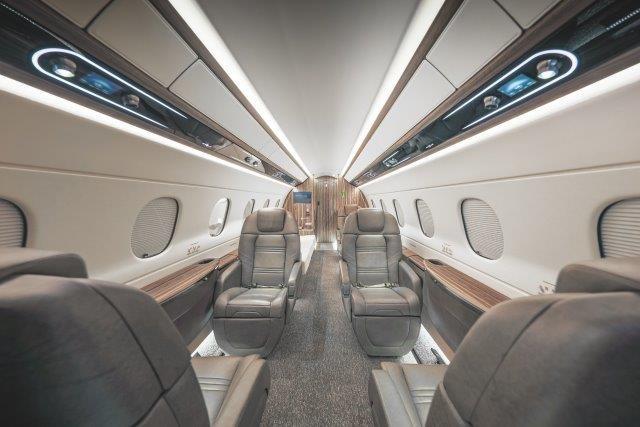


* Data Sourced from 3rd Party Industry Aircraft Cost and Performance Platforms. Note: Alternate Configurations May Be Available


Gulfstream G280 Dimensions*

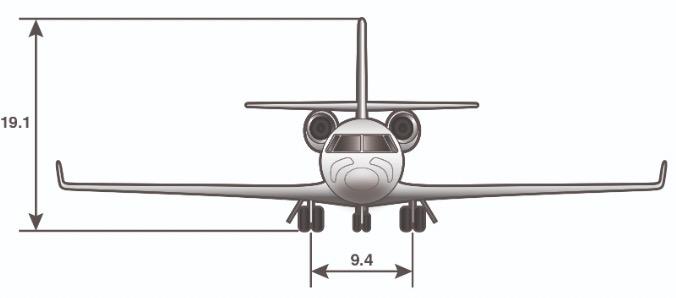


24.4 66.8 63.0 24.3 10.6
* Data Sourced from 3rd Party Industry Aircraft Cost and Performance Platforms.
Gulfstream G280 Interior*


* Data Sourced from 3rd Party Industry Aircraft Cost and Performance Platforms. Note: Alternate Configurations May Be Available


Gulfstream G450 Dimensions*
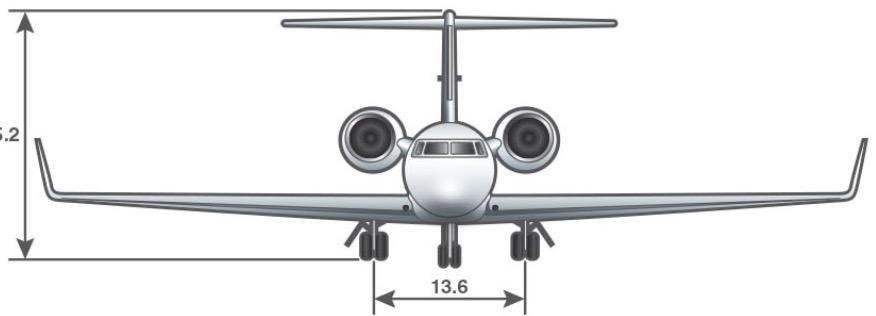
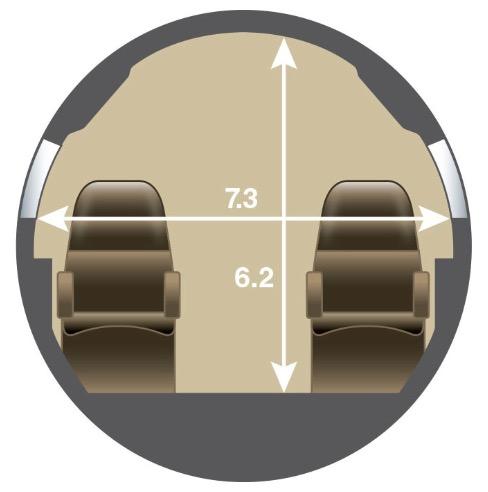


3rd

89.3 77.8 39.1 25.2 13.6
* Data Sourced from
Party Industry Aircraft Cost and Performance Platforms.
Gulfstream G450 Interior*


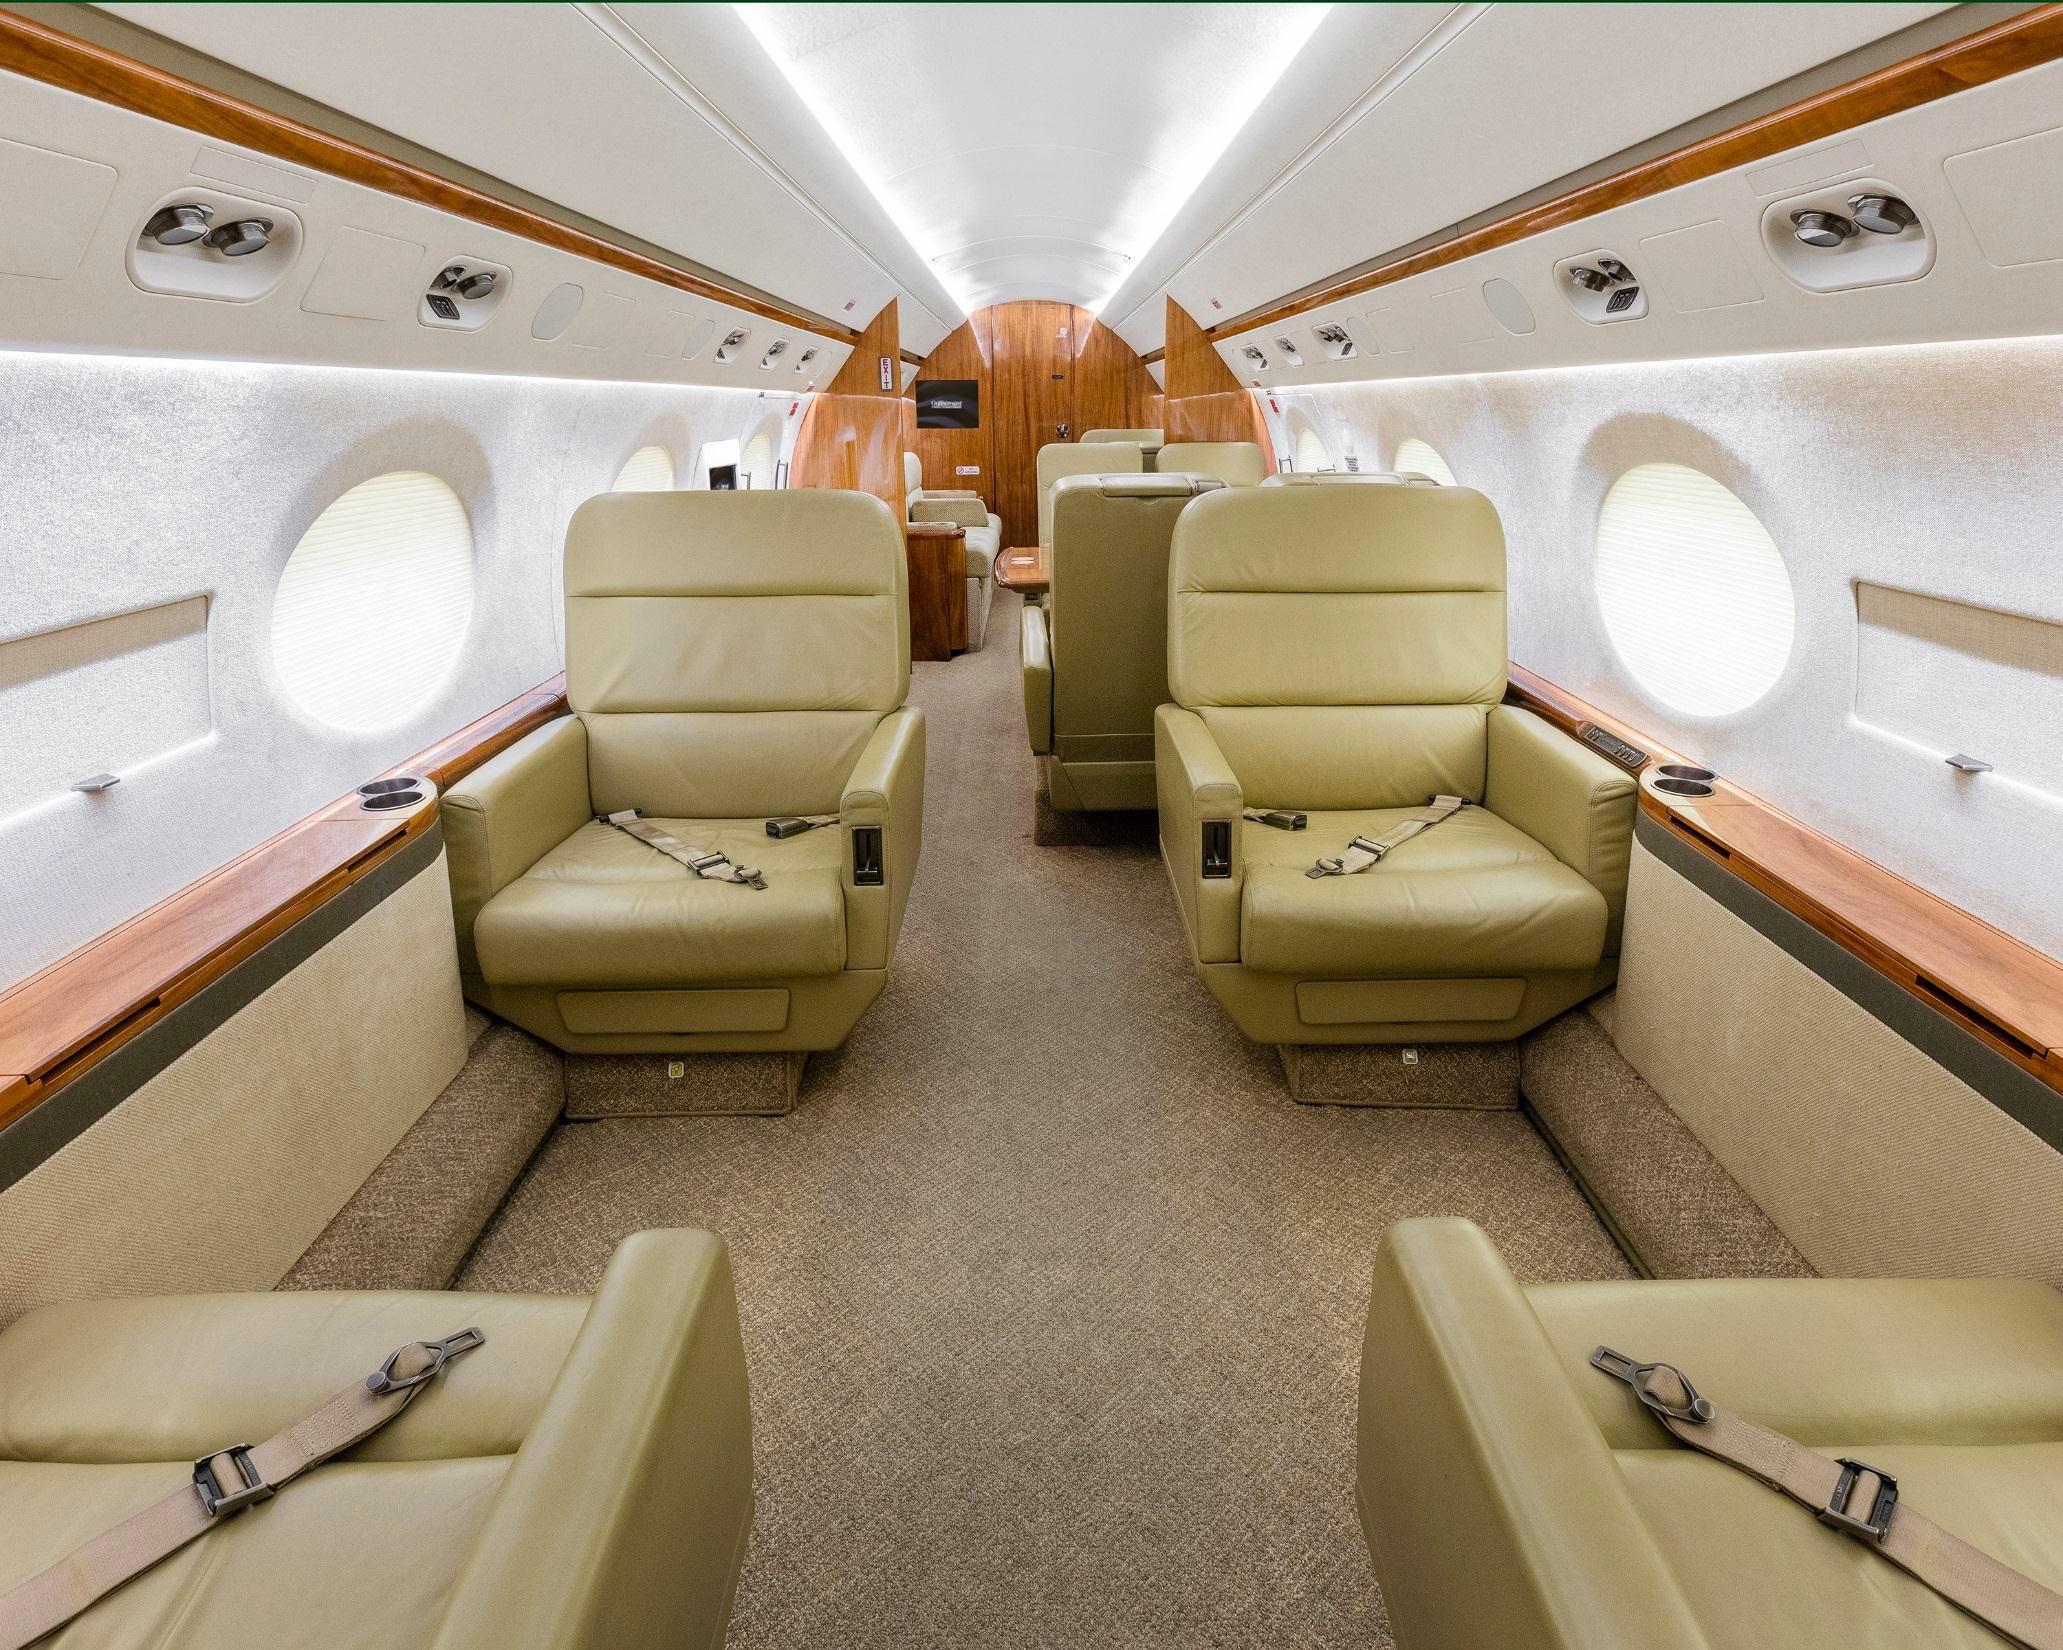

* Data Sourced from 3rd Party Industry Aircraft Cost and Performance Platforms. Note: Alternate Configurations May Be Available


Challenger 300 vs Challenger 350 vs Sovereign+ KSFO (San Francisco, CA)*

Assumptions: Range values presented for turbine powered aircraft are predominantly expressed under the requirements for NBAA IFR Reserves and 0 wind. 2 Crew & 5 PAX.
Wide View


Focused View
* Data is sourced Aircraft Cost Calculator. Range shown is for estimation purposes only and should not be used for actual flight.


G280 vs Citation Longitude vs Praetor 600 KSFO (San Francisco, CA)*


Assumptions: Range values presented for turbine powered aircraft are predominantly expressed under the requirements for NBAA IFR Reserves and 0 wind. 2 Crew & 5 PAX.
Wide View


* Data is sourced Aircraft Cost Calculator. Range shown is for estimation purposes only and should not be used for actual flight.
Focused View
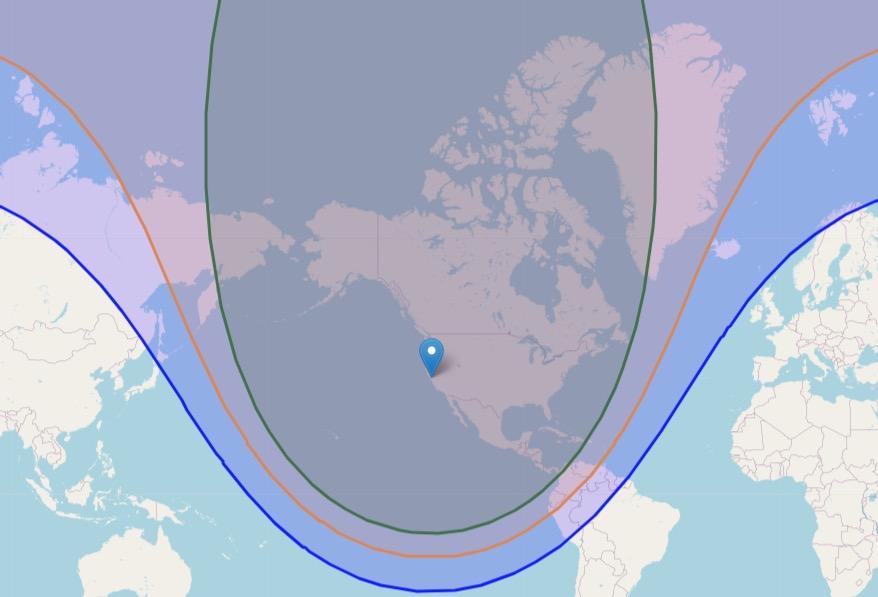
G450 vs Falcon 2000EX Easy vs Falcon 2000LX KSFO (San Francisco, CA)*
Assumptions: Range values presented for turbine powered aircraft are predominantly expressed under the requirements for NBAA IFR Reserves and 0 wind. 2 Crew & 5 PAX.
Focused View
Wide View


* Data is sourced Aircraft Cost Calculator. Range shown is for estimation purposes only and should not be used for actual flight.


Route Analysis

Route Studies – SFO (San Francisco, CA) to HPN (White Plains, NY)


 * Data Sourced from 3rd Party Industry Aircraft Cost and Performance Platforms.
Route Studies –SFO (San Francisco, CA) to HPN (White Plains, NY)

Aircraft Distance ETE Flight Level Fuel Used (lb’s) Fuel Used (Gallon’s) Fuel Cost (@$5,50) CHALLENGER 300 2,245 NM 4h 40m 41,000 9,736 1,167.39 $6,420.62 CHALLENGER 350 2,245 NM 4h 38m 41,000 10,083 1,208.99 $6,649.46 LONGITUDE 2,245 NM 4h 41m 45,000 8,673 1,039.93 $5,719.60 SOVEREIGN+ 2,245 NM 5h 19m 47,000 6,986 837.65 $4,607.07 F2000EX EASy 2,245 NM 4h 52m 47,000 8,745 1,048.56 $5,767.09 F2000LX 2,245 NM 4h 51m 47,000 8,097 970.86 $5,339.75 PRAETOR 600 2,245 NM 4h 55m 45,000 8,796 1,054.68 $5,800.72 G280 2,245 NM 4h 41m 45,000 8,668 1,039.33 $5,716.31 G450 2,245 NM 4h 33m 41,000 16,401 1,966.55 $10,816.01
* Data Sourced from 3rd Party Industry Aircraft Cost and Performance Platforms.
Route Studies – SFO (San Francisco, CA) to MIA (Miami, FL)

* Data Sourced from 3rd Party Industry Aircraft Cost and Performance Platforms.


Route Studies – SFO (San Francisco, CA) to MIA (Miami, FL)

Aircraft Distance ETE Flight Level Fuel Used (lb’s) Fuel Used (Gallon’s) Fuel Cost (@$5,50) CHALLENGER 300 2,246 NM 4h 26m 41,000 8,958 1,074.10 $5,907.55 CHALLENGER 350 2,246 NM 4h 23m 41,000 9,381 1,124.82 $6,186.51 LONGITUDE 2,246 NM 4h 26m 45,000 8,172 979.86 $5,389.21 SOVEREIGN+ 2,246 NM 4h 57m 47,000 6,666 799.28 $4,396.04 F2000EX EASy 2,246 NM 4h 36m 47,000 8,205 983.81 $5,410.97 F2000LX 2,246 NM 4h 37m 47,000 7,511 900.6 $4,953.30 PRAETOR 600 2,246 NM 4h 35m 45,000 8,492 1,018.23 $5,600.24 G280 2,246 NM 4h 25m 45,000 8,235 987.41 $5,430,76 G450 2,246 NM 4h 19m 41,000 15,257 1,829.38 $10,061.57
* Data Sourced from 3rd Party Industry Aircraft Cost and Performance Platforms.
Route Studies – SFO (San Francisco, CA) to SBN (South Bend, IN)
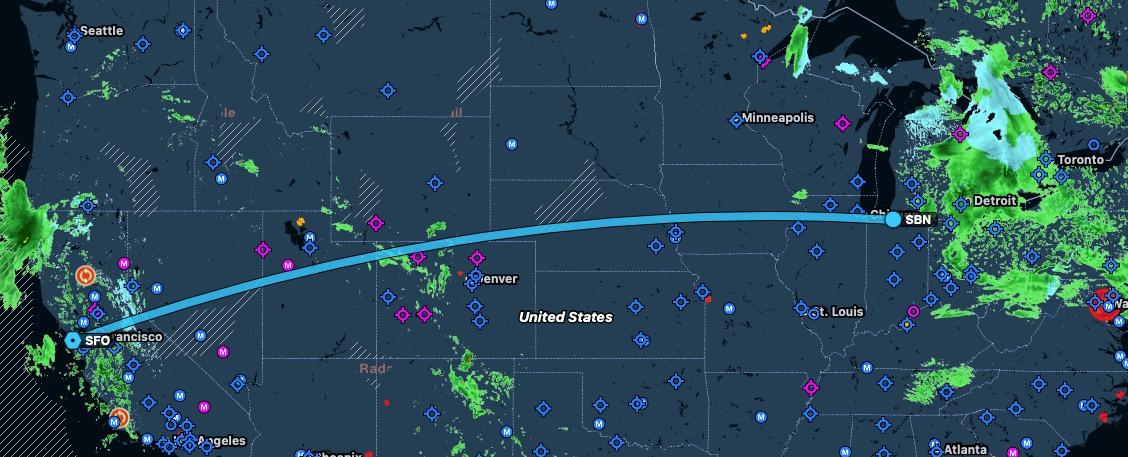

 * Data Sourced from 3rd Party Industry Aircraft Cost and Performance Platforms.
Route Studies –SFO (San Francisco, CA) to SBN (South Bend, IN)
* Data Sourced from 3rd Party Industry Aircraft Cost and Performance Platforms.

Aircraft Distance ETE Flight Level Fuel Used (lb’s) Fuel Used (Gallon’s) Fuel Cost (@$5,50) CHALLENGER 300 1,676 NM 3h 35m 41,000 7,407 888.13 $4,884.71 CHALLENGER 350 1,676 NM 3h 37m 41,000 6,843 820.50 $4,512.77 LONGITUDE 1,676 NM 3h 35m 45,000 6,729 806.83 $4,437.59 SOVEREIGN+ 1,676 NM 4h 03m 47,000 5,380 645.08 $3,547.96 F2000EX EASy 1,676 NM 3h 42m 47,000 6,692 802.40 $4,413.19 F2000LX 1,676 NM 3h 42 47,000 6,092 730.46 $4,017.51 PRAETOR 600 1,676 NM 3h 40m 45,000 6,502 779.62 $4,287.89 G280 1,676 NM 3h 34 45,000 6,690 802.16 $4,411.87 G450 1,676 NM 3h 31m 41,000 12,366 1,482.73 $8,155.04
Route Studies – SFO (San Francisco, CA) to BNA (Nashville, TN)


 * Data Sourced from 3rd Party Industry Aircraft Cost and Performance Platforms.
Route Studies –SFO (San Francisco, CA) to BNA (Nashville, TN)
* Data Sourced from 3rd Party Industry Aircraft Cost and Performance Platforms.

Aircraft Distance ETE Flight Level Fuel Used (lb’s) Fuel Used (Gallon’s) Fuel Cost (@$5,50) CHALLENGER 300 1,710 NM 3h32m 41,000 7,301 875.42 $4,814.81 CHALLENGER 350 1,710 NM 3h 33m 41,000 6,759 810.43 $4,457.37 LONGITUDE 1,710 NM 3h 31m 45,000 6,643 796.52 $4,380.88 SOVEREIGN+ 1,710 NM 3h 58m 47,000 5,319 637.77 $3,507.73 F2000EX EASy 1,710 NM 3h 39m 47,000 6,586 789.69 $4,343.29 F2000LX 1,710 NM 3h 40m 47,000 5,995 718.82 $3,953.54 PRAETOR 600 1,710 NM 3h 36m 45,000 6,429 770.86 $4,239.75 G280 1,710 NM 3h 31 45,000 6,606 792.09 $4,356.47 G450 1,710 NM 3h 28m 41,000 12,218 1,464.99 $8,057.43
Route Studies – SFO (San Francisco, CA) to SJD (Cabo San Lucas)

* Data Sourced from 3rd Party Industry Aircraft Cost and Performance Platforms.


Route Studies –SFO (San Francisco, CA) to SJD (Cabo San Lucas)
* Data Sourced from 3rd Party Industry Aircraft Cost and Performance Platforms.

Aircraft Distance ETE Flight Level Fuel Used (lb’s) Fuel Used (Gallon’s) Fuel Cost (@$5,50) CHALLENGER 300 1,085 NM 2h 20m 41,000 4,928 590.89 $3,249.88 CHALLENGER 350 1,085 NM 2h 23m 41,000 4,689 562.23 $3,092.27 LONGITUDE 1,085 NM 2h 23m 45,000 4,623 554.32 $3,048.74 SOVEREIGN+ 1,085 NM 2h 40m 47,000 3,712 445.08 $2,447.96 F2000EX EASy 1,085 NM 2h 28m 47,000 4,423 530.34 $2,916.85 F2000LX 1,085 NM 2h 26m 47,000 4,159 498.68 $2,742.75 PRAETOR 600 1,085 NM 2h 26m 45,000 4,447 533.21 $2,932.67 G280 1,085 NM 2h 21m 45,000 4,510 540.77 $2,974.22 G450 1,085 NM 2h 18m 41,000 8,302 995.44 $5,474.94
Your Headquarters for Global Aircraft Sales
JetHQ was founded on the belief that the most valuable asset in aviation is trust. We strive to not simply acquire and sell aircraft for our clients but build lasting relationships. Our team brings decades of aviation experience and real-time industry insight and analysis to each complex transaction.
Whether you are buying or selling an aircraft, be confident that JetHQ will be a dedicated partner looking out for your interests, every step of the way.
Let’s start. Descriptions
not
representations or warranties.
of specifications
the sole responsibility of purchaser.
do
constitute
Verification
remains


 * Data Sourced from 3rd Party Industry Aircraft Cost and Performance Platforms.


 * Data Sourced from 3rd Party Industry Aircraft Cost and Performance Platforms.


 * Data Sourced from 3rd Party Industry Aircraft Cost and Performance Platforms.


