


HAYWOOD COUNTY
December,2024Vol58.


Understandingthelocalrealestatemarketisoneofthemostimportantaspectsofbuyingorsellingahome.Whether you’redebatinghowmuchtoofferorifyoushouldacceptanofferyou’vereceived,marketknowledgeispower!
Makinganinformeddecisioninvolvesstayingcurrentwithboththe“macro-market”aswellasthe“micro-market”for youruniquesituation.OurKellerWilliamsProfessionalsagentspridethemselvesinbeingalocalmarketexperts,and oneofthemostimportantthingswecandoforourclientsistoempowerthemwiththatsameinformation.
Withthatinmind,we’vecommissionedthismonth’sRuizReporttomakesureyou’reasuptodateaspossiblewith currentmarketconditions,usingaccuratedatadirectlyfromtheMLS.Clickinganyofthepricerangesonslide4will takeyoutoavailablepropertiesonourwebsitesowecangetstartedASAP!
Pleaseenjoythearea’smostinformativemarketreport,onus.Don’thesitatetosendusane-mailatorgiveusacallat 828-254-7253ifyoushouldhaveanyquestions.
Sincerely,
JeffStewart TeamLeader
(vs. last month) (vs. this month last year)


Haywoodadded7morenewlistingstothemarketthanittookoff (putundercontract),whichincreasedtheoverallsupply.Home sales(closings)remainedflatinDecember,justrememberthat manyofthosehomeswentundercontractinapreviousmonth.


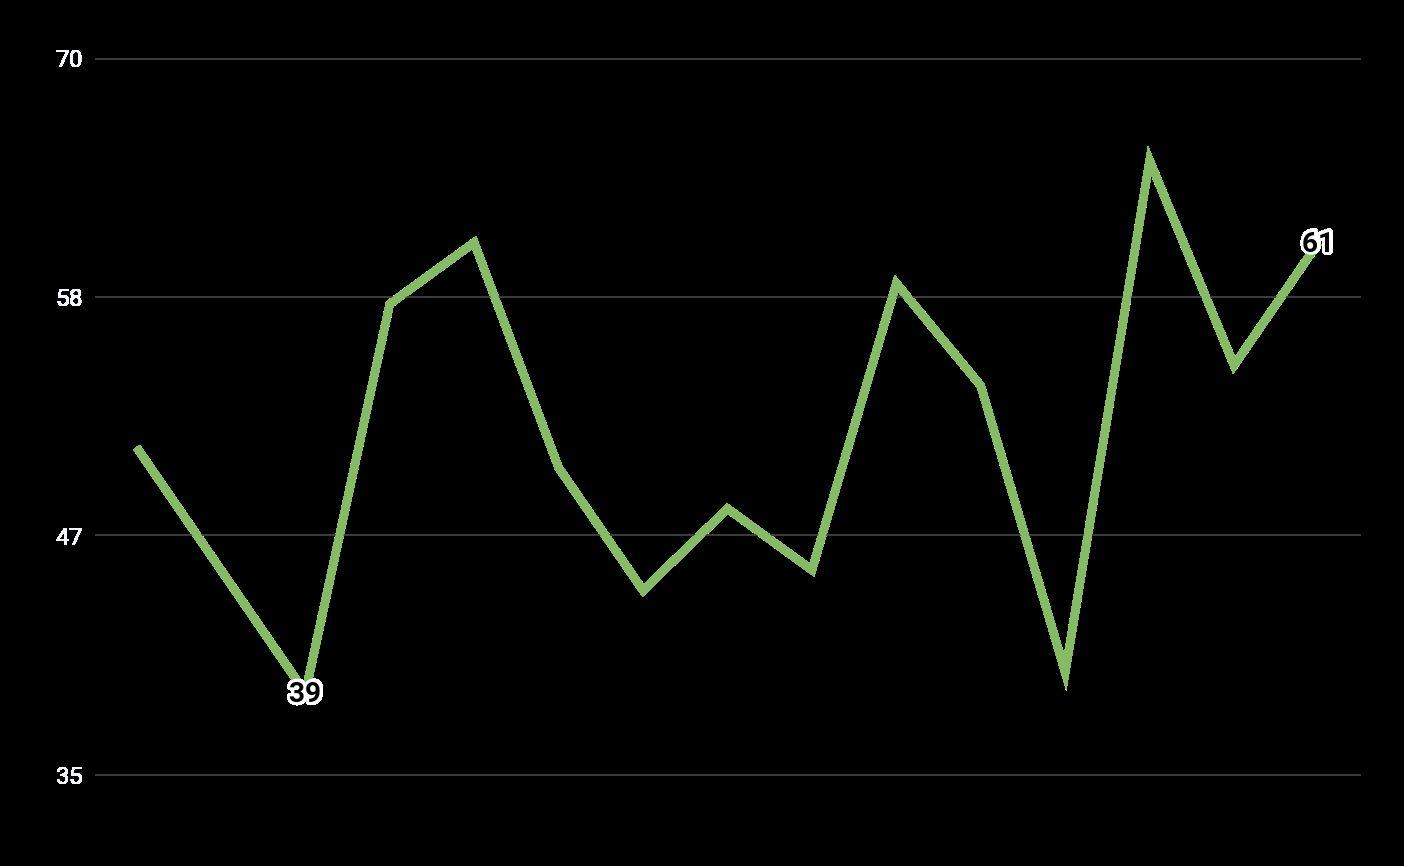
Thetotalnumberofactivelistingsdecreased10%comparedto November,50%ofhomeswentundercontractin33-daysorless, andatthisratethere’sabout3.8-monthsofsupplytogoaround. DecemberwasaSeller'smarket.
(vs. last month) (vs. this month last year)
TheaveragepriceofahomeinHaywoodCountywas $11klessthan itwasthistimelastDecember.Onaverage,propertiessoldfor97% oftheirlistpriceatthetimetheofferwasmade,and93%ofthe pricetheyoriginallylistedfor.
ActiveListings:Thisisthetotalnumberoflistings thatwereforsaleatanygivenpointduringthemonth.
UnderContract:Thisisthetotalnumberoflistings thatacceptedanoffertopurchaseduringthemonth.
UnderContract(%):Thisisthe“UnderContract” columnrepresentedasapercentageofthecounty.
PendingRatio:Thisratioiscalculatedusinga snapshottakenat11:59pmonthelastdayofthe month.Itusedtoshowapricerange’scompetitiveness bycomparingthenumberoflistingsundercontractto thetotalnumberoflistingsonthemarketatthetime thesnapshotwastaken(active+undercontract).
Monthsofinventoryrepresentshowlongitwould taketodepletethecurrentinventoryassumingnonew homesareputonthemarket.It'scommonlyusedto determinethehealthofaparticularmarket.
Between0-4monthsofinventoryisconsidereda seller'smarketbecausesupplyisrelativelylow,which meansthatsellershavemorecontroltosettermsor raiseprices.5-7monthssignalsa balancedmarketthereisahealthymixofbuyersandsellers.8ormore monthsofinventoryindicatesabuyer'smarket, whichmeansbuyershavemorenegotiatingpower
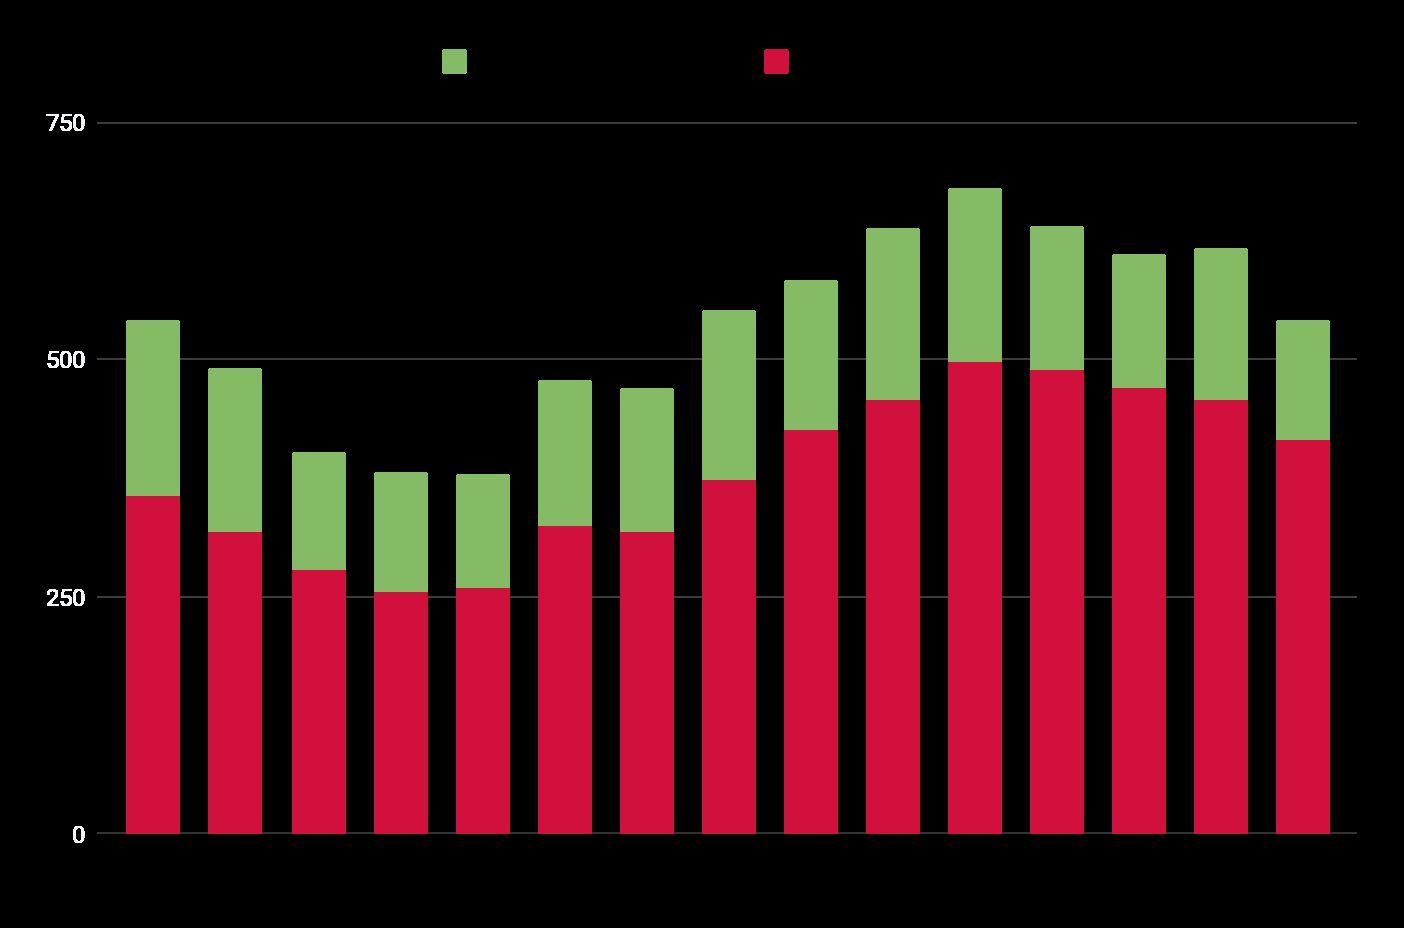
➔ The number of active listings decreasedby 10%inDecember.TotalActivelistings,the numberofpropertieslistedforsaleatany point during the month, was up 48% comparedtolastyear.
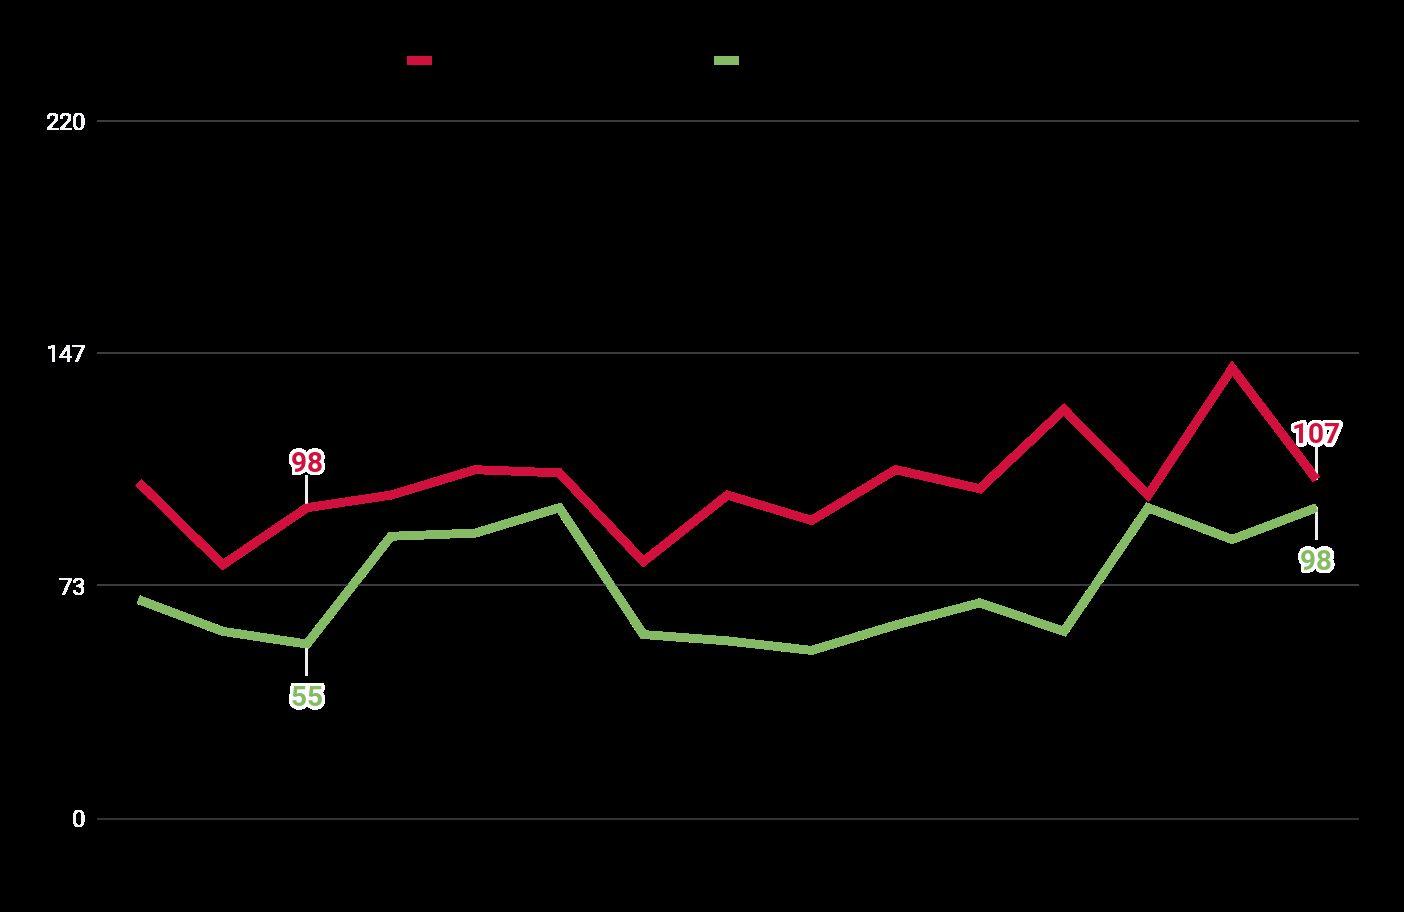
➔ Totalhomesundercontractdecreased36% from last month, and Haywood had 11% less homes under contract in December thanitdidthistimelastyear.
➔ Overall volume was down 14% from last monthbutup37%fromthistimelastyear.
➔ New listings decreased 23% from last month, but were up 15% from last December’snumbers.
➔ 36%lesshomeswentundercontract,and Haywood had less homes going under contract than this month last year, down 11%.
➔ ProTip:keepinganeyeonthedifference between homes added to the market (new listings) and those taken off (by goingundercontract)isthebestwayto gaugesupply&demand!
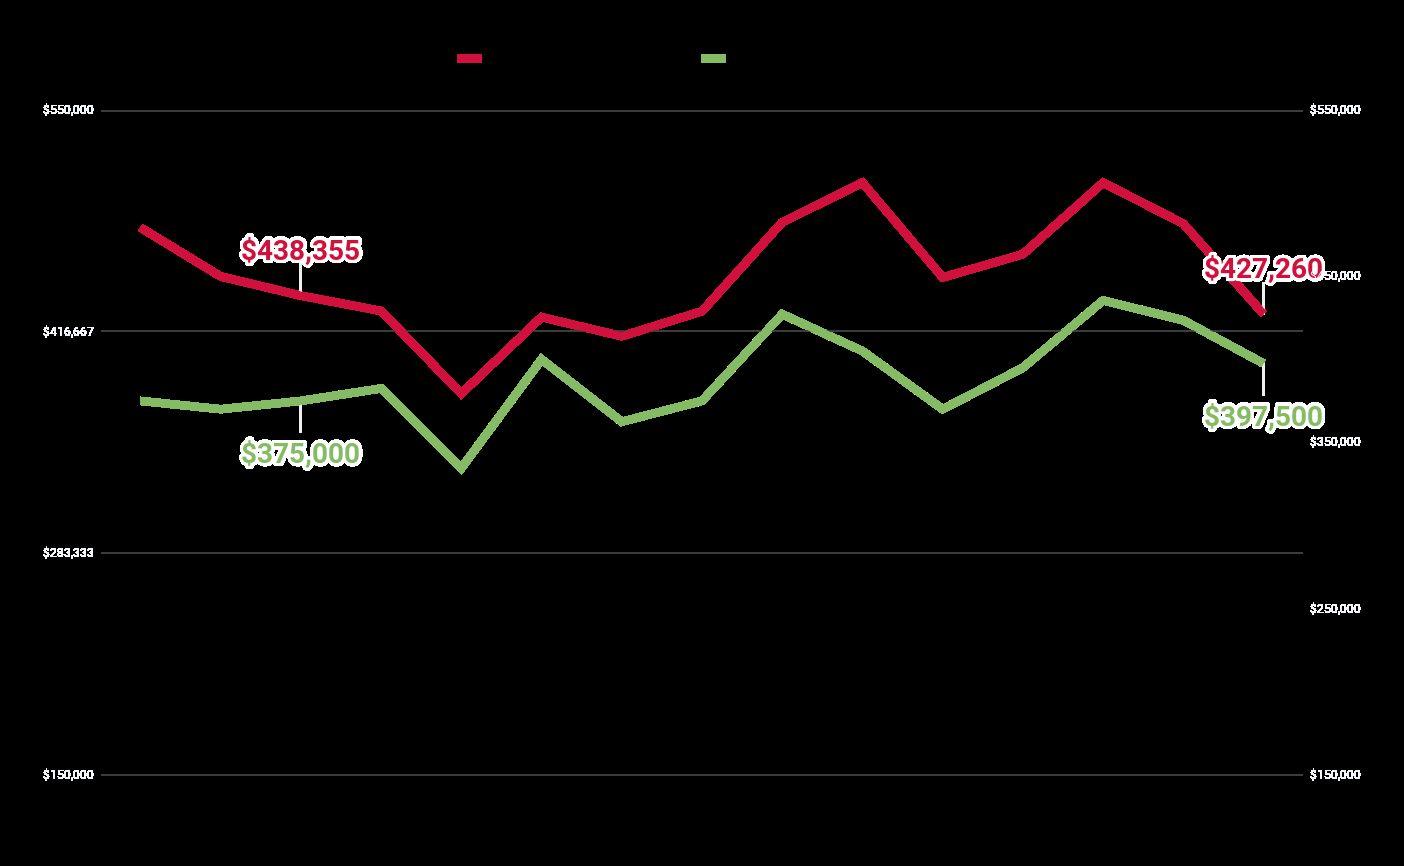
Themedianpriceisthe“middleprice,”meaninghalfofthehomessoldduringthemonthwerecheaperand halfweremoreexpensivethanthemedian.Theaverageprice isthetotalsalesdividedbynumberofsales.
➔ The average home price in Haywood County decreased 11%, and homes were valued 3% lower compared to last December.
➔ Thepositivehomevalueappreciationtrend seemstobeholdingdespiteinterestrates. Pro Tip: monthly price fluctuations are less indicative than annual trends for understandingmarketshifts!
➔ Theconsistentlyhigheraveragevs.median home price tells us that Haywood’s high-end market is strong, with higher priced homes raising the average for the wholemarket.
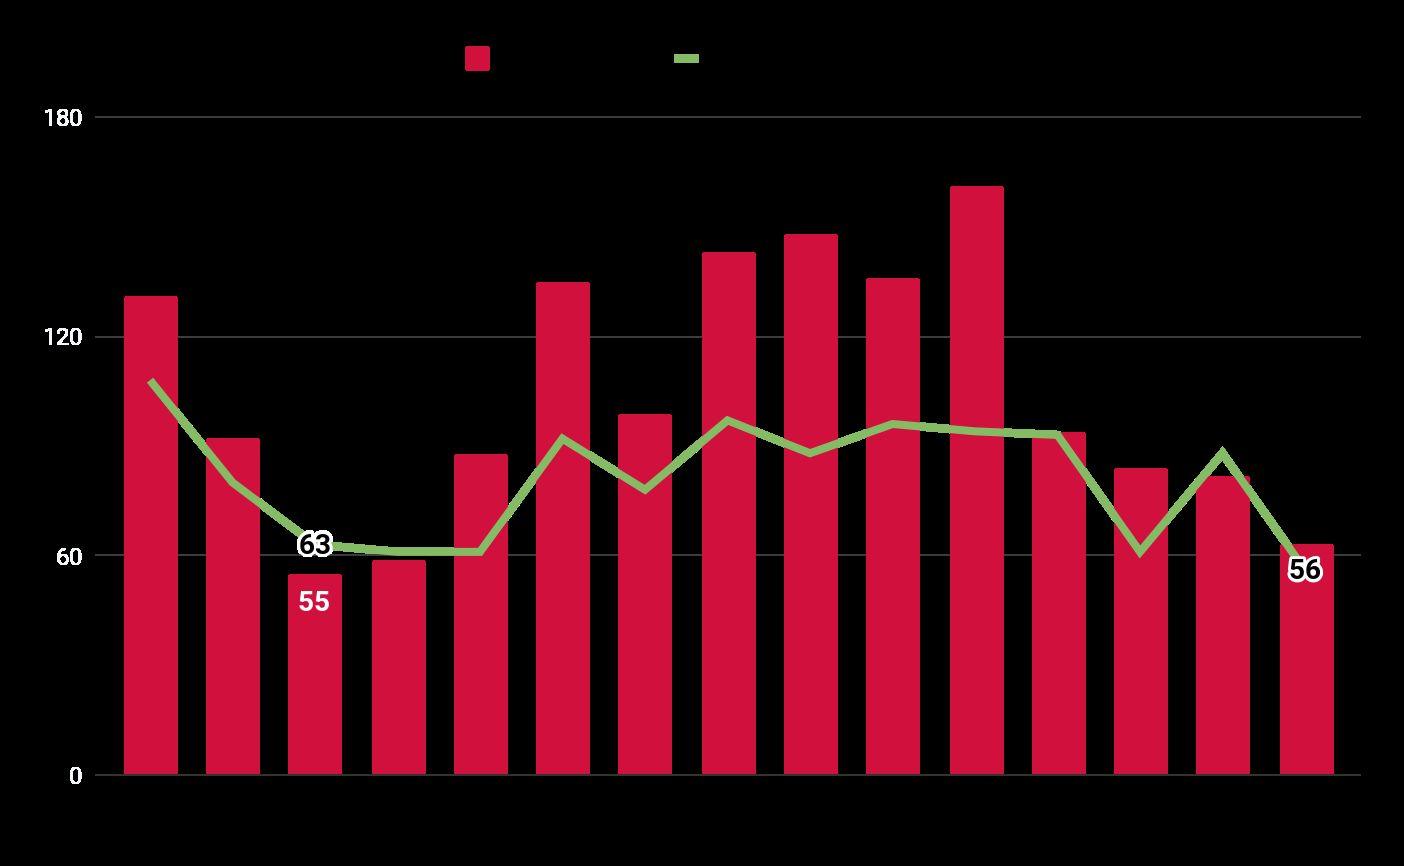
➔ Homes went under contract 41-days faster, on average, than they did in November,andthemediandaysittookto signapurchasecontractwas33-days(!!!).
➔ Homesbetween$600-699ksoldfastest inDecember,withamedian9-daysonthe market, followed by homes in the $150-174krange,whichtookamedianof 16-days.
➔ HomesinHaywoodaresellingquicklydue to a combination of extremely low inventoryandhighdemandforhomes.
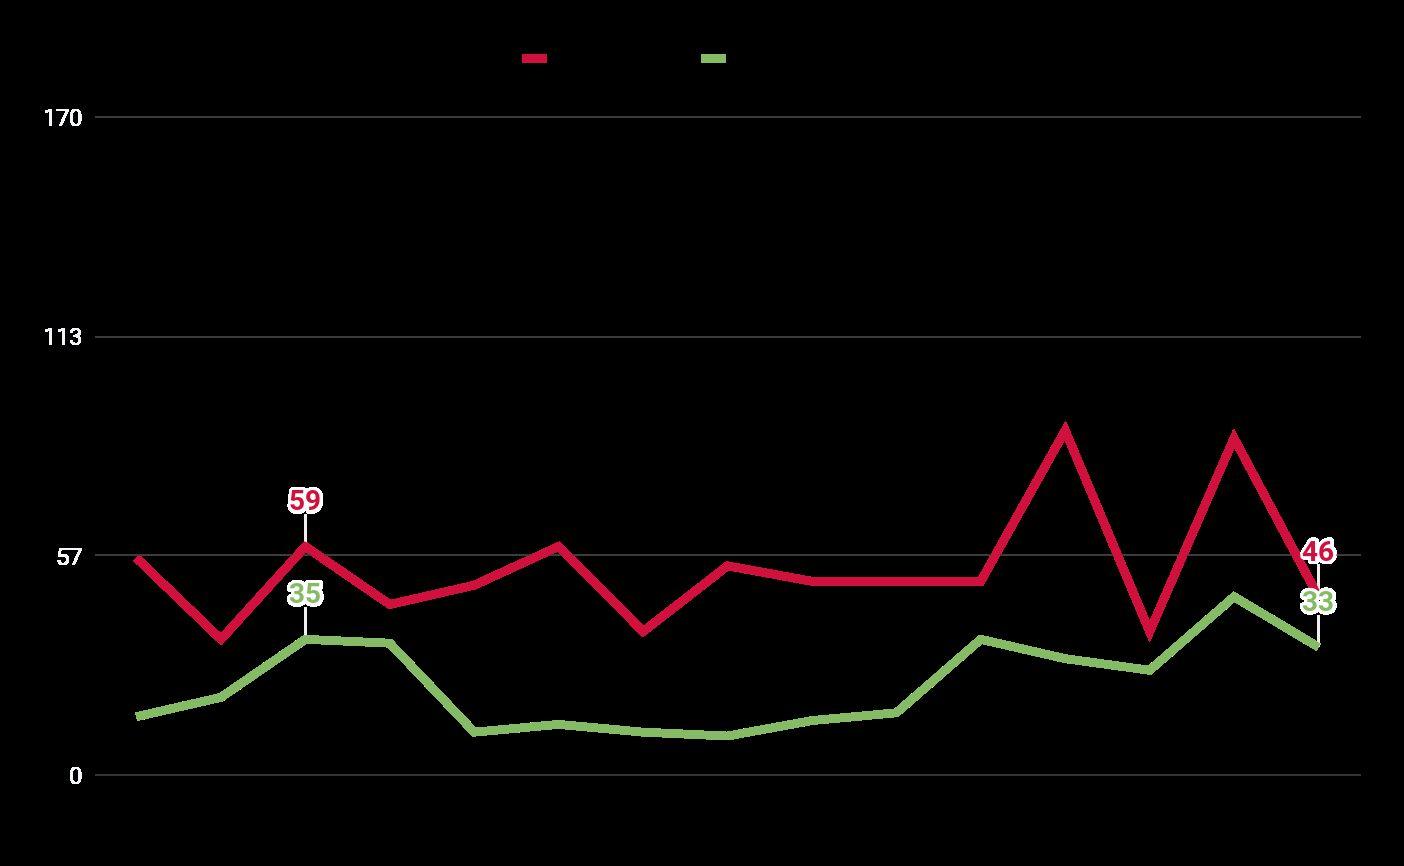
ThemedianDOMisthe“middleDOM,”meaninghalfofthehomesduringthemonthwentUCfasterandhalf tooklongerthanthemedian.TheaverageDOM isthetotalDOMdividedbynumberofsales.
➔ Contract to close time took an average of6-daysmorecomparedtolastmonth, which was 22-days slower compared to lastDecember.
➔ Homes valued valued between $600k-699ktookamongthelongestto close. December closings data put that segmentataround89-days,onaverage.
➔ Homes valued valued greater than $1M closed fastest, closing in ~29-days, on average.
➔ Sellers got paid an average of 35-days fasterafter listing their homes according toDecembersalesdata,but9-daysslower thanDec.,2023.
➔ This decrease was mostly due to a reduction in time spent on the market (DOM) since the time spent during the contracttocloseprocesswentup.
➔ Homes valued valued between $150k-174k sold fastest, averaging 47-days, followed by the valued up to $99k price range which took 82-days, on average.
DataforthisreportwaspulledfromCanopyMLSforSingleFamilyandCondo/Townhousepropertieson January 3rd, 2024. Realtors are required to update their transactions on the MLS within 48hrs, so while mostrecordsforthemonthshouldhavebeenaccountedfor,anyupdatesthatoccuredafterthereport was pulled will not have made the cut. This should not have a material effect on the data given the overallvolumeoftransactions.
Pleasesendmeane-mailifyouhaveanycomments,questions,requests,orcorrections.
Seebelowforsomerelevantformulas.
MonthsInventory= Pending= ActiveListingsThisMonth 12-MonthPendingHomesAverage UnderContractEndOfMonth ActiveEndOfMonth