

QUARTER TWO Market Report
WEST MICHI GAN 2025

LAKESHORE: Muskegon County
January 1st through June 30th, 2025
Volume YTD +25.62% increased to $536,414,260 Homes Sold YTD +8.66% increased to 1,255 Average Sale Price YTD +15.61% increased to $427,421
Inventory
Average Days on the Market
887 2024 52 2024 YTD
61 2025 YTD 2025 1,003
LAKESHORE: Muskegon County
January 1st through June 30th, 2025
Sales Volume by Price Range
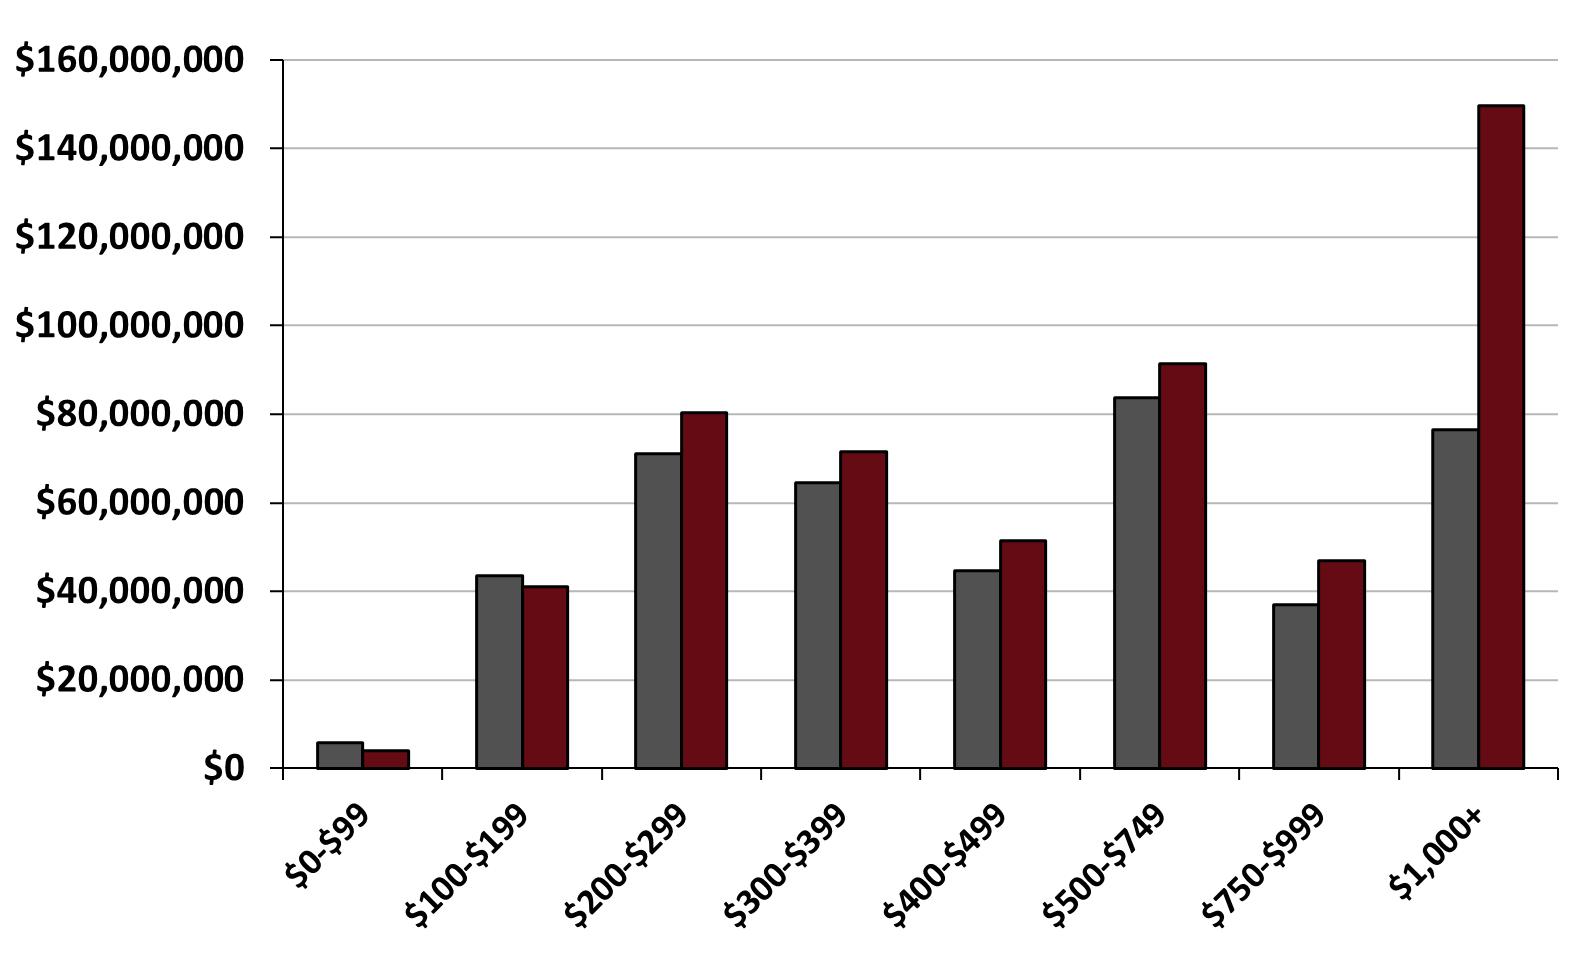

LAKESHORE: Muskegon County
January 1st through June 30th, 2025
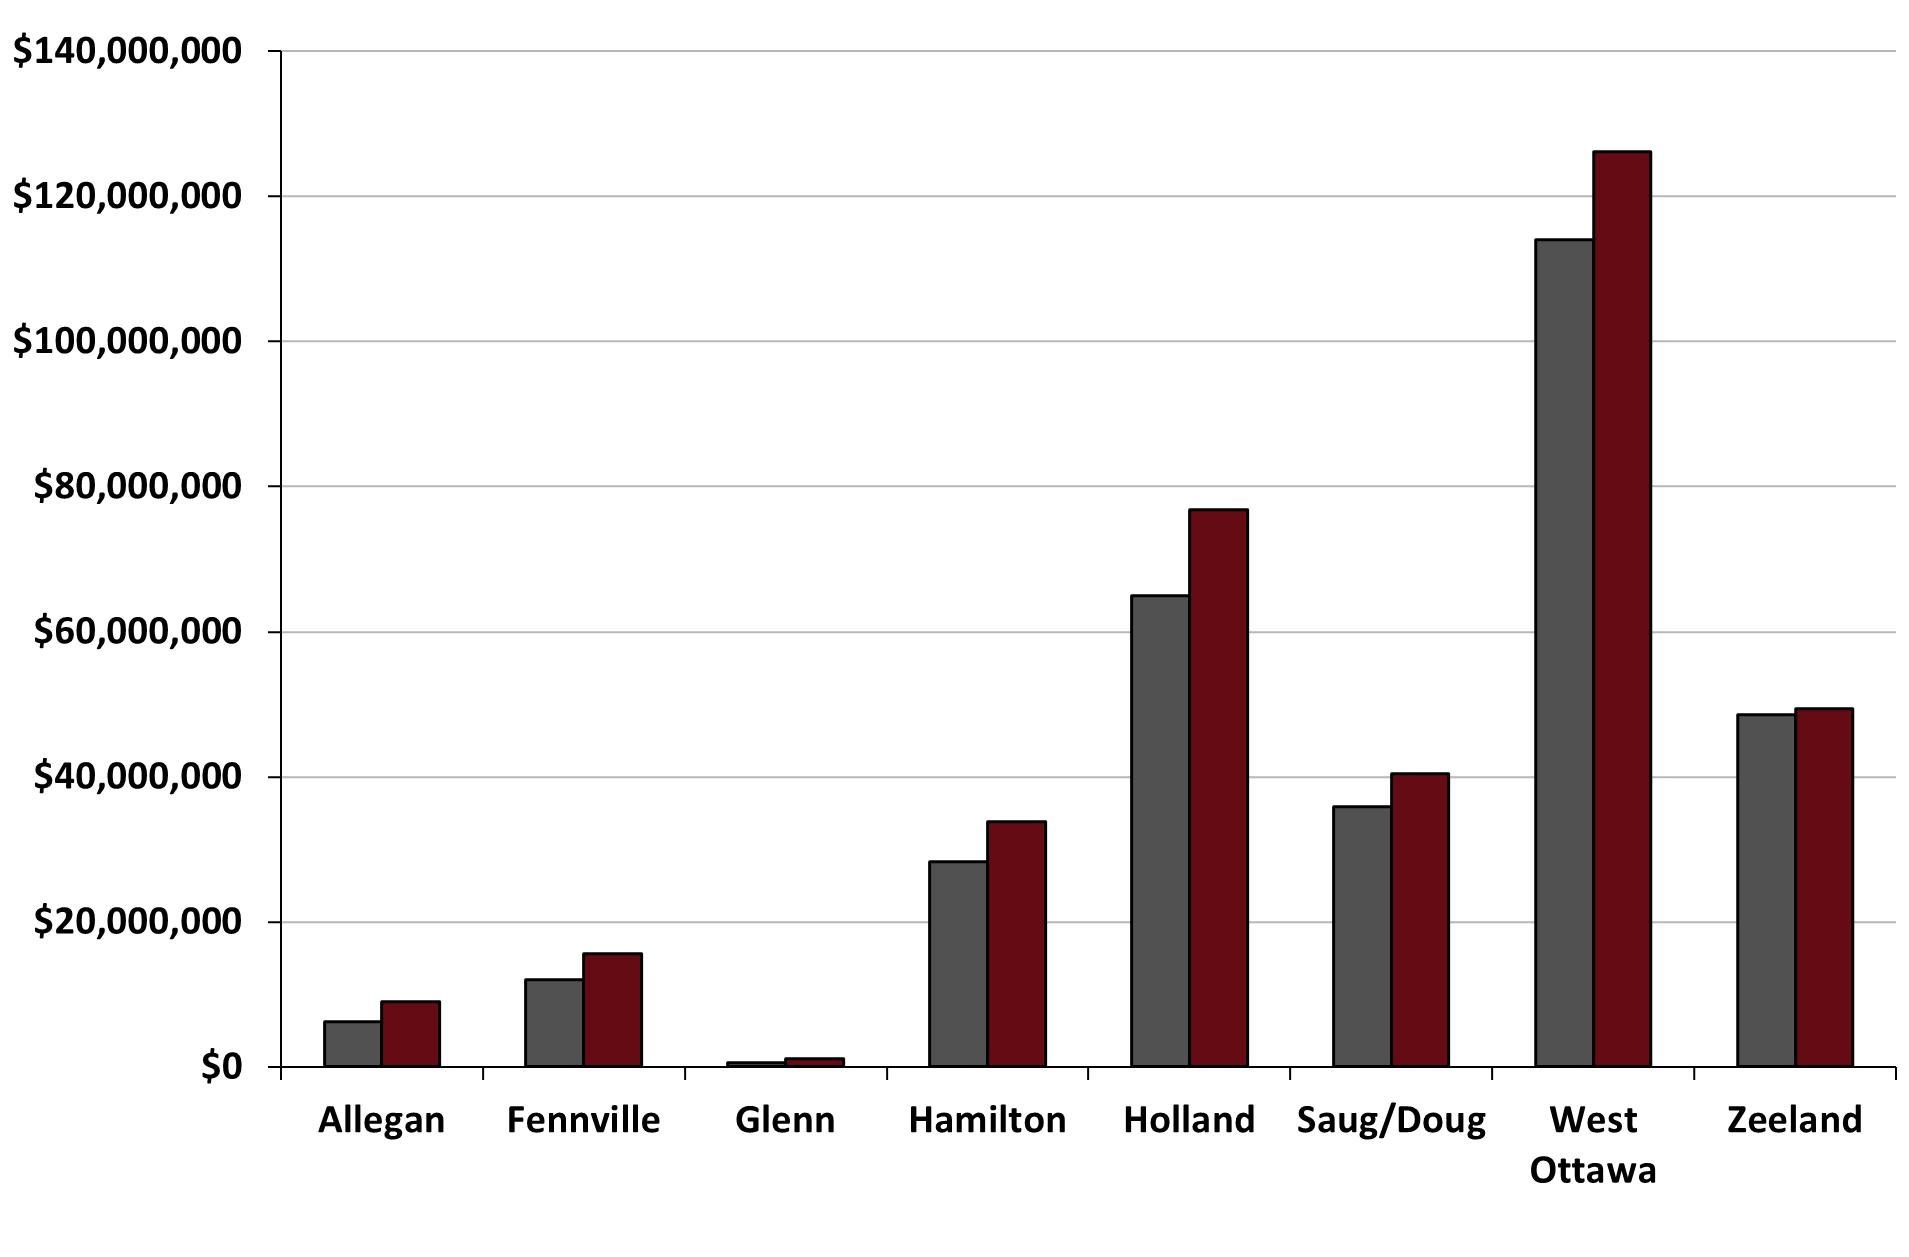
Sales Volume by School District

School Districts
YTD Change by School


LAKESHORE: North Ottawa County
January 1st through June 30th, 2025
Volume YTD
increased to $536,414,260 Homes Sold YTD
increased to 1,255
Inventory
887 2024
Sale Price YTD +15.61% increased to $427,421
Average Days on the Market
52 2024 YTD
61 2025 YTD 2025 1,003
January 1st through June 30th, 2025
Sales Volume by Price Range
LAKESHORE: North Ottawa County
January 1st through June 30th, 2025
Sales Volume by School District
YTD Change by School


LAKESHORE: Mason Oceana Manistee
January 1st through June 30th, 2025
+13.56%
increased to $372,721,293
Inventory
262 2024
Homes Sold YTD +3.24% increased to 765
Average Sale Price YTD +10.00%
increased to $487,217
Average Days on the Market
33 2024 YTD
38 2025 YTD 2025 329 *YTD = Year to Date
January 1st through June 30th, 2025
by

LAKESHORE: Mason Oceana Manistee
January 1st through June 30th, 2025
Sales Volume by School District
School Districts
YTD Change by School
