

INTERNATIONAL SCHOOL BASEL ISB MATHEMATICS CONTINUUM GUIDE

The aspirations and expectations of the mathematics program at ISB are:
To make connections with students’ mathematical experiences and develop an understanding of the principles, history and nature of mathematics and its application to real life.
To use mathematics as a tool and a universal language to solve problems in the world around them.
To give students opportunities to explore the world through the lens of a mathematician and engage in the enjoyment of the discipline and its nature.
To ensure students have the academic competencies required to engage in further mathematical studies and to use mathematics confidently in their daily life.
This is achieved through an inquiry approach to develop an understanding of mathematical concepts. We believe in equitable access to mathematics for every student, through intentional challenge and support to reach their academic potential.
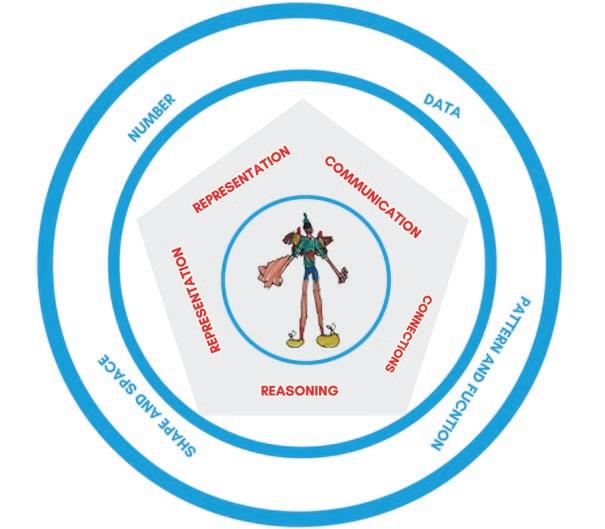
Mathematics processes are at the core of mathematics learning at ISB.
Key areas of mathematical knowledge taught throughout the school.
The number system is a language for describing quantity and the relationships between quantities. Within the number system there are different types of numbers with different properties that can be explored. Number sense allows for estimation, computation and the concept that the value attributed to a digit depends on its place value.
The identification and generalisation of patterns underpins all of mathematics. By identifying patterns through numbers, shapes, and algebraic symbols, relationships can be explored and described. Generalising patterns and developing functions to describe relationships facilitates modeling of real life situations.
Data is concerned with posing questions, collecting, displaying, analysing, and interpreting information in order to make inferences and inform decisions. Statistics and probability modelling are used to describe trends and patterns observed in data.
Shape and Space encompasses three main dimensions of mathematics: geometry, spatial reasoning and measurement. It facilitates an appreciation of the connections between mathematical concepts of position, shape, size, pattern, number, and data. Spatial awareness allows for analysing, measuring and transforming geometric quantities in two and three dimensions.
Mathematical processes are a dimension of ISB’s Mathematics Curriculum that enable students to achieve the learning expectations in each grade level for each of the mathematical branches. Processes are embedded throughout the curriculum and are essential in enabling learners to explore content and reach a greater depth and sophistication of their mathematical understanding.
By representing concepts in various ways, students develop flexibility in their thinking about those concepts. As students move from one representation to another, they make connections and deepen their understanding of the relationship between the concrete, visual and abstract representations of mathematical ideas. This helps students to recognize connections among related mathematical concepts in order to solve problems and communicate their thinking.
Mathematical reasoning helps students think logically and make sense of mathematics. Students will develop their ability to reason through exploration and investigations. Students will explore and record results, analyze observations and learn to employ inductive reasoning to form generalizations based on their findings. Students also learn to use counter-examples to disprove conjectures. Students can use deductive reasoning to assess the validity of conjectures and to formulate proofs.
Making connections deepens students’ understanding of the relationships among concepts and skills. As students continue to make such connections, they begin to see that mathematics is more than a series of isolated skills and concepts and that it can be applied to multiple contexts.
Communication allows students to express mathematical ideas and arguments coherently and clearly. It clarifies, reinforces and modifies ideas, attitudes and beliefs about mathematics. Through communication students make connections between concrete, visual, symbolic, oral, written and mental representations of mathematical ideas.
Problem solving enables students to apply prior understandings in new contexts. It allows students to reason, communicate ideas, make connections, and apply knowledge and skills. It promotes the collaborative sharing of ideas and strategies, and promotes talking about mathematics. It increases opportunities for the use of critical and creative thinking skills.
Drawing by an ISB Grade 2 student.
IB Primary Year Programme (PYP):
(Early Childhood 1-3, Grades 1-5)
Mathematics is taught by the Homeroom teacher Mathematics is taught by the Homeroom (HR) teacher

Mathematics is taught within the Transdisciplinary Units of Inquiry and as stand alone units
Students in Grades 1-5 have 6 x 50 minute lessons per week
In Early Childhood Mathematics is embedded in their daily learning experiences The Mathematics Coordinator supports HR teachers with the teaching of stand alone mathematics units across the Junior School.
IB Middle Years Programme (MYP): (Grade 6, 7 & 8 ):
Students in Grade 6-8 have 3 lessons per week
IB Middle Years & IB Diploma Programmes: (Grades 9 -12)
Grade 9 - 10: students have 4 x 55 mins lessons, in a week
Grade 11-12, IB Diploma:
SL AA/AI courses: 3 x 55 mins lessons, in a week
HL AA course: 4x 55 mins lessons, in a week
Mathematics progression from Early Childhood to Grade 12 is mapped for each grade level and each Mathematics branch. The Mathematics continuum provides an overview for teachers of what students will be expected to accomplish in the previous as well as the year after.
Teachers use these expectations to plan their mathematics units ensuring transitions for students are smooth and teachers can build on students’ prior knowledge and prepare them for the next grade level. ISB mathematicss units are reviewed every year, but the agreed expectations provide the foundation for this review.
From Grades 9-12, students follow specific mathematics courses.
1. Begin to use number words and numerals to represent quantities in real life situations.
2. Explore ways that numbers can be built and represented.
3. Say the number sequence by 1s from 1 to 10 forwards.
4. Use the language of mathematics to compare quantities in real life situations.
1. Begin to collect and represent information in a variety of ways.
1. Connect number names and numerals to the quantities they represent.
2. Explore ways to record quantities and begin to read and write numbers.
3. Use number words and numerals to represent quantities in real life situations
4. Say the number sequence by1s from 1 to 10 forwards and backwards.
5. Explore multiple ways that numbers can be built and represented.
6. Begin to count to determine the number of objects in a set with one-to-one correspondence.
7. Count to determine the number of objects in a set.
1. Collect and represent information in a variety of ways.
1. Say the number sequence by 1s starting anywhere from 1 to 10 and from 10 to 1.
2. Recognize, at a glance, and name familiar arrangements of 1 to 5 objects or dots.
3. Relate a numeral, 1 to 10, to its respective quantity.
4. Represent and describe numbers 2 to 10, concretely and pictorially.
5. Compare quantities, 1 to 10, using one-toone correspondence.
1. Collect and represent information in a variety of ways.
1. Sort, describe and compare real objects.
2. Begin to recognise and name basic 2D shapes.
3. Describe position and direction, for example, inside, outside, above, below, next to, behind, in front of, up, down.
4. Explore and understand the vocabulary related to paths, regions and boundaries of their immediate environment (inside, outside, above, below) and their position (next to, behind, in front of, up, down).
5. Identify, describe and sequence events in their daily routine, for example, before, after, bedtime, storytime, today, tomorrow.
6. Identify and describe attributes of real objects, for example, long, short, heavy, light, empty, full, hot, cold.
7. Begin to compare the attributes of real objects, for example, longer, shorter, heavier.
1. Begin to identify that patterns repeat.
2. Begin to identify patterns in the local environment and everyday situations, for example, sounds, actions, objects, nature.
1. Sort, describe and compare real objects and 2-D shapes.
2. Recognise and name basic 2-D shapes and describe some of their characteristics,
3. Compare the attributes of real objects.
4. Identify, describe and sequence events.
5. Follow and give directions related to position and movement.
6. Explore, understand and use the vocabulary related to the paths, regions and boundaries of their immediate environment ( inside, outside, above, below)and their position (next to, behind, in front of, up, down).
1. Identify that patterns repeat
2. Explore, describe, extend and create patterns in various ways, for example, using words, drawings, symbols, materials, actions, sounds and numbers.
3. Identify patterns in the local environment and everyday situations, for example, sounds, actions, objects, nature.
1. Use direct comparison to compare two objects based on a single attribute, such as length (height), mass (weight) and volume (capacity).
2. Sort 3-D objects using a single attribute.
1. Demonstrate an understanding of repeating patterns (two or three elements) by:
identifying
reproducing
extending
creating patterns using manipulatives, sounds and actions.
1. Say the number sequence, 0 to 100, by:
• 1s forward and backward between any two given numbers
• 2s to 20, forward starting at 0
• 5s and 10s to 100, forward starting at 0.
2. Recognize, at a glance, and name familiar arrangements of 1 to 10 objects or dots.
3. Demonstrate an understanding of counting by:
• indicating that the last number said identifies “how many”
• showing that any set has only one count
• using the counting on strategy
• using parts or equal groups to count sets.
4. Represent and describe numbers to 20 concretely, pictorially and symbolically.
5. Compare sets containing up to 20 elements to solve problems using:
• referents
• one-to-one correspondence.
6. Estimate quantities to 20 by using referents.
7. Identify the number, up to 20, that is one more, two more, one less and two less than a given number.
8. Demonstrate, concretely and pictorially, how a given number can be represented by a variety of equal groups with and without singles.
9. Demonstrate an understanding of addition of numbers with answers to 20 and their corresponding subtraction facts, concretely, pictorially and symbolically by:
• using familiar and mathematical language to describe additive and subtractive actions from their experience
• creating and solving problems in context that involve addition and subtraction
• modeling addition and subtraction using a variety of concrete and visualrepresentations, and recording the process symbolically.
10. Describe and use mental mathematics strategies (memorization not intended), such as:
• counting on and counting back
• making 10
• doubles
• using addition to subtract to determine the basic addition facts to 18 and related subtraction facts.
1. Collect and represent information in a variety of ways.
1. Demonstrate an understanding of measurement as a process of comparing by:
• identifying attributes that can be compared
• ordering objects
• making statements of comparison
• filling, covering or matching.
2. Sort 3-D objects and 2-D shapes using one attribute, and explain the sorting rule.
3. Replicate composite 2-D shapes and 3-D objects.
4. Compare 2-D shapes to parts of 3-D objects in the environment.
1. Demonstrate an understanding of repeating patterns (two to four elements) by:
• describing
• reproducing
• extending
• creating patterns using manipulatives, diagrams, sounds and actions.
2. Translate repeating patterns from one representation to another.
3. Describe equality as a balance and inequality as an imbalance, concretely and pictorially (0 to 20).
4. Record equalities using the equal symbol.
1. Say the number sequence from 0 to 100 by:
• 2s,and 10s, forward and backward, using starting points that are multiples of 2, 5 and 10 respectively
• 10s using starting points from 1 to 9
• 2s starting from 1.
2. Demonstrate if a number (up to 100) is even or odd.
3. Describe order or relative position using ordinal numbers (up to tenth).
4. Represent and describe numbers to 100, concretely, pictorially and symbolically.
5. Compare and order numbers up to 100.
6. Estimate quantities to 100 using referents.
7. Illustrate, concretely and pictorially, the meaning of place value for numerals to 100.
8. Demonstrate and explain the effect of adding zero to or subtracting zero from any number.
9. Demonstrate an understanding of addition (limited to 1 and 2-digit numerals) with answers to 100 and the corresponding subtraction by:
• using personal strategies for adding and subtracting with and without the support of manipulatives
• creating and solving problems that involve addition and subtraction
• explaining that the order in which numbers are added does not affect the sum
• explaining that the order in which numbers are subtracted may affect the difference.
10. Apply mental mathematics strategies, such as:
• using doubles
• making 10
• one more, one less
• two more, two less
• building on a known double
• addition for subtraction to determine basic addition facts to 18 and related subtraction facts.
1. Gather and record data about self and others to answer questions.
2. Construct and interpret concrete graphs and pictographs to solve problems.
1. Relate the number of days to a week and the number of months to a year in a problem-solving context.
2. Relate the size of a unit of measure to the number of units (limited to nonstandard units) used to measure length and mass (weight).
3. Compare and order objects by length, height, distance around and mass (weight) using nonstandard units, and make statements of comparison
4. Measure length to the nearest non-standard unit by: • using multiple copies of a unit • using a single copy of a unit (iteration process).
5. Demonstrate that changing the orientation of an object does not alter the measurements of its attributes.
6. Describe, compare and construct 3-D objects, including:
• cubes
• spheres
• cones • cylinders • pyramids.
7. Identify 2-D shapes as parts of 3-D objects in the environment
1. Demonstrate an understanding of repeating patterns (three to five elements)
2. Demonstrate an understanding of increasing patterns: (for PR1 and PR2) by • describing
• extending
• comparing • creating patterns using manipulatives, diagrams, sounds and actions (numbers to 100)
3. Demonstrate and explain the meaning of equality and inequality by using manipulatives and diagrams (0 to 100).
4. Record equalities and inequalities symbolically using the equal symbol or the not equal symbol.
1. Say the number sequence forward and backward from 0 to 1000 by: 5s, 10s or 100s using any starting point 3s us ing starting points that are multiples of 3 4s using starting points that are multiples of 4 25s using starting points that are multiples of 25.
2. Represent and describe numbers to 1000, concretely, pictorially and symbolically.
3. Compare and order numbers to 1000.
4. Estimate quantities less than 1000 using referents.
5. Illustrate, concretely and pictorially, the meaning of place value for numerals to 1000.
6. Describe and apply mental mathematics strategies for adding two 2-digit numerals, such as:
• adding from left to right
• taking one addend to the nearest multiple of ten and then compensating
• using doubles.
7. Describe and apply mental mathematics strategies for sub tracting two 2-digit numerals, such as:
• taking the subtrahend to the nearest multiple of ten and then compensating
• thinking of addition
• using doubles.
8. Apply estimation strategies to predict sums and differenc es of two 2-digit numerals in a problem solving context.
9. Demonstrate an understanding of addition and subtrac tion of numbers with answers to 1000 (limited to 1, 2 and 3-digit numerals) by:
• using personal strategies for adding and subtracting with and without the support of manipulatives
• creating and solving problems in contexts that involve addition and subtraction of numbers concretely, pictorially and symbolically.
10. Demonstrate an understanding of division by:
• representing and explaining division using equal sharing and equal grouping
• creating and solving problems in context that involve equal sharing and equal grouping
• modelling equal sharing and equal grouping using concrete and visual representations, and recording the process symbolically
• relating division to repeated subtraction
• relating division to multiplication. (limited to division related to multiplication facts up to 5 × 5)
11. Demonstrate an understanding of fractions by:
• explaining that a fraction represents a part of a whole
• describing situations in which fractions are used
• comparing fractions of the same whole with like denominators.
1. Collect first-hand data and organize it using:
• tally marks
• line plots
• charts
• lists to answer questions.
2. Construct, label and interpret bar graphs to solve problems.
1. Relate the passage of time to common activities us ing non-standard and standard units (minutes, hours, days, weeks, months, years).
2. Relate the number of seconds to a minute, the num ber of minutes to an hour and the number of days to a month in a problem-solving context.
3. Demonstrate an understanding of measuring length (cm, m) by:
• selecting and justifying referents for the units cm and m
• modelling and describing the relationship between the units cm and m
• estimating length using referents
• measuring and recording length, width and height.
4. Demonstrate an understanding of perimeter by:
• estimating perimeter using referents for centimetre or metre
• measuring and recording perimeter (cm, m)
• constructing different shapes for a given perimeter (cm, m) to demonstrate that many shapes are possible for a perimeter.
5. Demonstrate an understanding of measuring mass (g, kg) by:
• selecting and justifying referents for the units g and kg
• modelling and describing the relationship between the units g and kg
• estimating mass using referents
• measuring and recording mass.
6. Describe 3-D objects according to the shape of the faces, and the number of edges and vertices.
7. Sort regular and irregular polygons, including:
• triangles
• quadrilaterals
• pentagons
• hexagons
• octagons according to the number of sides.
1. Demonstrate an understanding of increasing patterns by:
• describing
• extending
• comparing
• creating patterns using manipulatives, diagrams, sounds and actions (numbers to 1000).
2. Demonstrate an understanding of decreasing patterns by:
• describing
• extending
• comparing creating patterns using manipulatives, diagrams, sounds and actions (numbers to 1000).
13. Solve one-step addition and subtraction equations involving symbols representing an unknown number.
1. Represent and describe whole numbers to 10 000, concretely, pictorially and symbolically.
2. Compare and order numbers to 10 000.
3. Demonstrate an understanding of addition of numbers with answers to 10 000 and their corresponding subtractions (limited to 3 and 4-digit numerals) by:
• using personal strategies for adding and subtracting
• estimating sums and differences
• solving problems involving addition and subtraction.
4. Demonstrate an understanding of addition and subtraction of decimals (limited to hundredths) by:
• using compatible numbers
• estimating sums and differences
• using mental math strategies to solve problems
5. Explain the properties of 0 and 1 for multiplication and the property of 1 for division.
6. Describe and apply mental mathematical strategies, such as: Skip counting from a known fact, using doubling or halving, using doubling or halving and adding or subtracting one more group, using patterns in the 9 facts to determine basic multiplication facts to9 x 9 and related division facts.
7. Demonstrate an understanding of multiplication (2- or 3-digit by 1-digit) to solve problems by:
• using personal strategies for multiplication with and without concrete materials
• using arrays to represent multiplication
• connecting concrete representations to symbolic representations
• estimating products.
8. Demonstrate an understanding of division (1-digit divisor and up to 2-digit dividend) to solve problems by:
• using personal strategies for dividing with and without concrete materials
• estimating quotients
• relating division to multiplication.
9. Demonstrate an understanding of fractions less than or equal to one by using concrete and pictorial representations to:
• name and record fractions for the parts of a whole or a set
• compare and order fractions
• model and explain that for different wholes, two identical fractions may not represent the same quantity
• provide examples of where fractions are used.
10. Relate decimals to fractions (to hundredths).
1. Demonstrate an understanding of many-toone correspondence.
2. Construct and interpret pictographs and bar graphs involving many-toone correspondence to draw conclusions.
1. Read and record time using digital and analog clocks, including 24-hour clocks.
2. Read and record calendar dates in a variety of formats
3. Demonstrate an understanding of area of regular and irregular 2-D shapes by:
• recognizing that area is measured in square units
• selecting and justifying referents for the units cm2 or m2
• estimating area by using referents for cm2 or m2
• determining and recording area (cm2 or m2)
• constructing different rectangles for a given area (cm2 or m2) in order to demonstrate that many different rectangles may have the same area.
4. Describe and construct rectangular and triangular prisms.
5. Demonstrate an understanding of line symmetry by:
• identifying symmetrical 2-D shapes
• creating symmetrical 2-D shapes
• drawing one or more lines of symmetry in a 2-D shape.
6. Demonstrate an understanding of congruency, concretely and pictorially.
1. Identify and describe patterns found in tables and charts, including a multiplication chart
2. Reproduce a pattern shown in a table or chart using concrete materials.
3. Represent and describe patterns and relationships using charts and tables to solve problems.
4. Express a given problem as an equation in which a symbol is used to represent an unknown number.
5. Solve one-step equations involving a symbol to represent an unknown number.
1. Represent and describe whole numbers to 1 000 000.
2. Demonstrate an understanding of addition and subtraction of decimals (limited to thousandths).
3. Use estimation strategies including:
• front-end rounding
• compensation
• compatible numbers in problem-solving contexts.
4. Apply mental mathematics strategies and number properties, such as:
• skip counting from a known fact
• using doubling or halving
• using patterns in the 9s facts
• using repeated doubling or halving to determine answers for basic multiplication facts to 81 and related division facts.
5. Apply mental mathematics strategies for multiplication, such as:
• annexing then adding zero
• halving and doubling
• using the distributive property.
6. Demonstrate, with and without concrete materials, an understanding of division (3-digit by 1-digit) and interpret the remainder to solve problems.
7. Demonstrate an understanding of fractions by using concrete and pictorial representations to:
• create sets of equivalent fractions
• compare fractions with like and unlike denominators.
8. Describe and represent decimals (tenths, hundredths, thousandths) concretely, pictorially and symbolically.
9. Relate decimals to fractions (to thousandths).
10. Compare and order decimals (to thousandths) by using:
• benchmarks
• place value
• equivalent decimals.
1. Differentiate between first-hand and second-hand data
2. Construct and interpret double bar graphs to draw conclusions.
1. Design and construct different rectangles given either perimeter or area, or both (whole numbers) and draw conclusions.
2. Demonstrate an understanding of measuring length (mm and km) by:
• selecting and justifying referents for the units mm and km.
• modelling and describing the relationship between mm and cm units, and between mm and m units.
• modelling and describing the relationship between m and km units.
3. Demonstrate an understanding of volume by:
• selecting and justifying referents for cm3 or m3 units
• estimating volume by using referents for cm3 or m3
• measuring and recording volume (cm3 or m3)
• constructing rectangular prisms for a given volume.
4. Demonstrate an understanding of capacity by:
• describing the relationship between mL and L
• selecting and justifying referents for mL or L units
• estimating capacity by using referents for mL or L
• measuring and recording capacity (mL or L).
5. Describe and provide examples of edges and faces of 3-D objects, and sides of 2-D shapes that are:
• parallel
• intersecting
• perpendicular
• vertical or horizontal.
6. Identify and sort triangles and quadrilaterals, including:
• rectangles; squares. Right angled triangles, scalene, equilateral, isosceles triangles
• trapezoids
• parallelograms
• rhombuses according to their attributes
6. Identify and sort different types of angles: acute, obtuse, right angles and reflex
1. Determine the pattern rule to make predictions about subsequent terms (elements).
2. Solve problems involving missing numbers in one-step number equations with whole number coefficients and whole number solutions
1. Understand and use the relationship between exponents and roots
2. Model, read, write and compare integers in appropriate contexts
3. Understand the concept of directed numbers and use manipulatives to model and represent directed numbers
4. Understand that directed numbers can be represented on the number line
5. Understand that addition and subtraction of directed numbers can be modeled in different ways.
6. Build strategies for adding and subtracting directed numbers
7. Understand how to flexibly and efficiently use directed numbers for addition and subtraction
8. Build strategies for multiplying and dividing directed numbers
9. Fluently and flexibly use directed numbers for multiplication and division
10. Flexibly and efficiently use strategies to determine highest common factor and lowest common multiple
11. Use understanding of equivalent fractions to model adding and subtracting fractions with visual representation
12. Flexibly and efficiently use strategies for addition and subtraction of fractions
13. Use understanding of equivalent fractions to model multiplication of a fraction by a whole number using the area model.
14. Use understanding of equivalent fractions to model multiplication of a fraction by a fraction using the area model
15. Use understanding of equivalent fractions to model division of a fraction by a fraction using the area model
16. Use understanding of equivalent fractions to model division of a fraction by a fraction using lowest common denominator
1. Understand the importance of relevant, reliable and valid data collection
2. Understand when data should be collected from a sample versus a population.
3. Understand that data can be organised in a frequency table
4. Understand that numerical data is either discrete or continuous
5. Understand that measures of central tendency (mean, median, mode) provide key information about a data set
6. Understand that location/dispersion provide key information about a data set
7. Understand that large discrete data sets or continuous data can be grouped
8. Understand that group data gives rise to a modal group.
9. Understand that the midpoint of a group can be used to represent the data.
10. Understand that numerical data (discrete) can be represented with a stem and leaf plot
11. Understand that continuous data can be represented with a frequency histogram.
12. Understand that numerical data can be represented using a scatter plot.
13. Understand that scatter plots can identify relationships between variables
14. Understand that a line of best fit can be used to represent the linear trend between variables.
1. Develop generalisation of angle sums for quadrilateral and triangle
2. Measure angles using degrees
3. Use understanding of angle measurement within problems using bearings
4. Use understandings of the properties of shapes to determine perimeter
5. Develop the generalisation of area for triangles, parallelograms and trapezoids
6. Understand that area can be converted between metric units
7. Understand how to transform a 2D shape on a coordinate grid
8. Understand that two number lines intersect at (0, 0) and form a Cartesian Plane .
9. Understand the relationship between the independent and dependent variables and axes
10. Plot coordinate points in a Cartesian Plane
1. Use pattern to develop the generalisation that repeated multiplication can be represented in exponential notation
2. Use patterns to understand the inverse relationship between exponents and roots
3. Understand that number patterns can be analysed and generalised using single relationships
4. Develop a generalisation to represent a pattern using words and symbols in an equation
5. Develop an understanding that we use a variable to represent a concept or item
6. Understand that algebraic expressions can be simplified by grouping like terms
7. Understand an equation in terms of a balance and be able to use inverse operations to solve simple linear equation
8. Understand how to substitute a known value for a variable in an algebraic relationship
1. Flexibly and efficiently use strategies for addition and subtraction of fractions
2. Understand how to flexibly and efficiently use strategies for multiplication and division of fractions
3. Understand how to flexibly and efficiently use strategies for addition and subtraction of decimals
4. Build strategies for multiplying and dividing decimal numbers
5. Use concept of equivalent fractions to understand percentages as hundredths
6. Represent percentages as equivalent fractions
7. Understand and use percentage as a tool for representing a part of a whole or a change.
8. Convert between fractions, decimals and percentages
9. Understand how fractions, decimals and percentages are used interchangeably in real- life situations
10. Understand the concept of a ratio and use ratio language and notation to describe a ratio relationship between two quantities
11. Understand that visual representation is a strategy to show part-part relationships
12. Understand equivalent ratios by comparing visual representations
13. Understand and use unit ratios to solve problems
14. Identify and use unit rate associated with ratios of fractions, including ratios of lengths, areas and other quantities measured in like or different units
1. Understand the concept of chance being between 0 and 1
2. Understand how to determine the probability of a single event occurring
3. Understand the concept of theoretical and experimental probability
4. Understand that visual representations can be used to help determine the probability of two or more events occurring (with or without replacement)
1. Develop generalisations of the relationships between the sides in a right angle triangle
2. Develop generalisation of Pythagoras’ Theorem and use it to find side lengths in right angled triangles.
3. Develop generalisation of corresponding and alternate angle theorem
4. Develop generalisations of internal and external angles of polygons
5. Understand the difference between circle and other shapes
6. Use understandings of the properties of circles to develop a generalisation of circumference
7. Use understandings of compound shapes and properties of circles for finding perimeters.
8. Use understandings of the properties of circles to develop a generalisation of area
9. Use understandings of compound shapes and properties of circles for finding areas.
10. Construct angle bisectors and perpendicular bisectors
1. Be able to identify generalisations of sequences as arithmetic
2. Use generalisations from number patterns to make predictions and solve problems with more than one operation
3. Understand how to apply the area model to understand the law of distribution in order to simplify algebraic expressions
4. Understand how to substitute a known value for a variable in an algebraic relationship
5. Understand an equation in terms of a balance and be able to use inverse operations to solve more complex linear equations (multi-step)
1. Understand the number system and its sets (natural, whole, integers, rational, irrational)
2. Understand how large and small numbers can be written using scientific notation
3. Understand that scientific notation can be used to represent large and small numbers
4. Understand that accuracy is affected by rounding to a given number of significant figures
5. Understand and use index laws with integer exponents
6. Understand that fraction operations can be generalised and applied to algebraic fractions
7. Understand that ratios can be used to find dimensions of similar figures and find currency conversions
8. Understand how to use direct proportion as a model for real life situations
1. Understand that a linear relationship between two variables can be described in terms of correlation
2. Understand that a linear relationship between two variables can be modelled by a linear equation
1. Use understandings of compound shapes and properties of circles for finding surface areas of prisms.
2. Use understandings of compound shapes and properties of circles for finding volumes of prisms.
3. Understand that volume can be converted between metric units.
4. Understand that Pythagoras’ Theorem can be used to determine the distance between two points
5. Understand how to determine the midpoint of a line segment
6. Understand that the gradient of a linear model function corresponds to the rate of change between the variables.
7. Understand the relationship between the gradient of parallel lines
8. Understand how to use the gradient and intercepts to determine the equation of a linear relationship
9. Understand that the ratio of side lengths of right angled triangles is related to the angle
1. Be able to identify generalisations of sequences as geometric with powers of 2 and 3
2. Use patterns to develop generalisations of index laws involving integer exponents
3. Use the area model to understand the law of distribution in order to simplify algebraic expressions including introduction to the binomial expansion
4. Use the area model to understand factoring an expression with a highest common factor
5. Understand how a quadratic expression with an x2 coefficient of one can be factorised into linear factors
6. Understand that a linear function generates a set of coordinates that can be plotted
7. Understand that real life linear relationships can be modeled by a linear function
8. Understand that the gradient of a linear function corresponds to the rate of change between the variables.
9. Understand an equation in terms of a balance and be able to use inverse operations to solve equations with fractional coefficients
10. Understand how to solve equations with simple algebraic fractions
1. Understand the number system and its sets (natural, whole, integers, rational, irrational, real).
2. Understand that an absolute value has magnitude but no direction.
3. Be able to use the absolute value within logarithms.
4. Be able to apply percentages within sequence and series.
5. Be able to model and use logarithms as the inverse of exponents.
6. Have a conceptual understanding of the logarithm laws, be able to use the laws in simple equations.
7. Understand and use index laws with real exponents.
8. Understand the concept of surds and irrational numbers as exact values
9. Be able to flexibly and efficiently use irrational numbers for addition and subtraction.
10. Be able to flexibly and efficiently use irrational numbers for multiplication and division.
11. Understand that fraction operations can be generalised and applied to irrational numbers.
12. Be able to apply the concept of ratio to area and volume of similar figures.
13. Be able to use indirect proportion as a model for real-life situations.
1. Understand that key statistics of a data set can be represented as box and whisker plot and can be used to compare multiple sets of data.
2. Understand that cumulative frequency can be represented in a cumulative frequency chart and used to calculate percentiles.
3. Understand that the Inter-Quartile Range represents the dispersion of the data around the central 50%
4. Understand that the Standard Deviation is the average spread of data around the mean.
5. Understand that a linear relationship between two variables can be quantified by the Pearson Correlation Coefficient.
6. Understand that the relationship between two variables can be modelled with the linear regression line and that the linear regression line function is found by minimising errors.
7. Understand that the graphical calculator can be used to find key statistics, the correlation coefficient and the regression line.
8. Understand that the statistical model is developed by considering all of the key statistics and graphs, and that decisions are made by considering them holistically.
9. Understand and be able to communicate via formal set notation.
10. Understand how to calculate the probability of more than one event occurring.
11. Understand that visual representations can be used to demonstrate sample space and the effect of introducing conditions.
12. Understand that events can be independent or dependent.
1. Develop generalisations of the relationships between 2D right angletriangle side length and how these enable the calculation of a length in a 3D shape.
2. Develop the use of ratio within the context of area and volumes.
3. Develop and use generalisations of circle theorems.
4. Be able to use radians as a measurement of angles.
5. Be able to use Pythagoras’ Theorem to find side lengths in 3D.
6. Be able to use an understanding of compound shapes and properties of circles for finding perimeters, using degrees and radians.
7. Be able to use trigonometry to find the area of triangles.
8. Be able to use an understanding of compound shapes and properties of circles to find surface areas of prisms, using degrees and radians.
9. Be able to use an understanding of compound shapes and properties of circles to find volumes of prisms, cones, pyramids and spheres.
10. Be able to use an understanding of trigonometry to find side lengths and angles in 2D and 3D.
11. Be able to use an understanding of trigonometry to discover sine rule and cosine rule within non-right angle triangles.
12. Be able to apply trigonometry in real life situations including bearings.
13. Understand how the unit circle relates to the trigonometric graphs and be able to use it to find related angles.
14. Be able to calculate the gradient of a perpendicular line.
1. Be able to identify generalisations of quadratic and cubic sequences.
2. Use patterns to generalise arithmetic or geometric series.
3. Be able to use patterns to develop generalisations of index laws involving real exponents.
4. Understand how a quadratic expression can be factorised into linear factors and vertex form.
5. Understand that the domain set is a list of all the values that can be inputted into a function.
6. Understand that the range set is a list of all the values that are generated by a function.
7. Understand that a quadratic function maps a domain set onto a range set that generates a parabola when represented on the coordinate plane.
8. Understand that an exponential function maps a domain set onto a range which has a limit.
9. Understand that domain and range sets can be restricted leading to horizontal and vertical asymptotes.
10. Understand that the range set of one function can become the domain of another, leading to composite functions.
11. Understand that the range set of one function can be mapped onto the domain set, leading to inverse functions.
12. Understand that real-life quadratic relationships can be modelled by a quadratic function.
13. Understand that real-life periodic relationships can be modelled by a trigonometric function.
14. Understand that real-life relationships can be modelled by an exponential function.
15. Be able to solve complex equations with algebraic fractions.
16. Be able to solve complex equations with irrational solutions.
17. Be able to solve simple exponential equations with the same base by comparing exponents.
18. Be able to solve exponential equations by using logarithms.
19. Understand the relationship between the independent and dependent variables in a linear equation compared to a linear inequality.
20. Understand that a linear inequality results in a set of solutions.
21. Understand that the solution to simultaneous linear and quadratic equations satisfies both equations independently.
22. Understand that there could be none-1-2 solutions to simultaneous linear and quadratic equations.
23. Understand that domain and range sets can be transformed and be able to predict the effect on the graphical representation on the coordinate plane.
13. Understand why events can be mutually exclusive and how we can represent this on a Venn diagram.
14. Understand the relationship between individual probabilities and conditional probabilities.
15. Be able to describe probabilities using correct notations.
24. Understand that function formulae can be determined by considering the transformation of a parent function.
25. Understand the relationship between transformation notation and the effect on the graphical representation on the coordinate grid.
26. Understand the concept of rates of change.
27. Be able to differentiate simple polynomials.
28. Be able to prove curriculum theorems.
1. Understand the number system and its sets (natural, whole, integers, rational, irrational, real, imaginary)
2. Understand that an absolute value has magnitude but no direction
3. Be able to use the absolute value within logarithms
4. Be able to graph the modulus function and use the absolute values within calculus and logarithms
5. Be able to apply percentages within sequence and series.
6. Be able to model and use logarithms as the inverse of exponents.
7. Be able to fluently and flexibly model, read and use logarithms.
8. Have a conceptual understanding of the logarithm laws, and be able to use laws in simple equations.
9. Be able to extend the use of logarithms to solve complex equations.
10. Understand and use index laws with real exponents.
11. Understand the concept of surds and irrational numbers as exact values.
12. Understand the concept of why imaginary numbers are used to describe unreal roots and quadratic equations.
13. Be able to flexibly and efficiently use irrational numbers for addition and subtraction.
14. Be able to flexibly and efficiently use irrational numbers for multiplication and division.
15. Understand that fraction operations can be generalised and applied to irrational numbers.
16. Be able to flexibly and efficiently use matrix array systems to perform multiple operations simultaneously.
17. Be able to apply the concept of ratio to area and volume of similar figures.
18. Be able to use indirect proportion as a model for real-life situations.
1. Understand that key statistics of a data set can be represented as box and whisker plot and can be used to compare multiple sets of data.
2. Understand that cumulative frequency can be represented in a cumulative frequency chart and used to calculate percentiles.
3. Understand that continuous data with varying group sizes should be represented on a frequency density histogram where the area of the bar represents the frequency of the group.
4. Understand that the Inter-Quartile Range represents the dispersion of the data around the central 50%.
5. Understand that the Standard Deviation is the average spread of data around the mean.
6. Understand that a linear relationship between two variables can be quantified by the Pearson Correlation Coefficient.
7. Understand that the relationship between two variables can be modelled with the linear regression line and that the linear regression line function is found by minimising errors.
8. Understand that the graphical calculator can be used to find key statistics, the correlation coefficient and the regression line.
9. Understand that the statistical model is developed by considering all of the key statistics and graphs, and that decisions are made by considering them holistically.
10. Understand and be able to communicate via formal set notation.
11. Understand how to calculate the probability of more than one event occurring.
1. Develop generalisations of the relationships between 2D right angletriangle side length and understand how these enable the calculation of a length in a 3D shape.
2. Develop the use of ratio within the context of area and volumes.
3. Develop generalisations and proofs of circle theorems.
4. Be able to use radians as a measurement of angles.
5. Be able to use an understanding of Pythagoras’ Theorem to find side lengths in 3D.
6. Be able to use an understanding of compound shapes and properties of circles to find perimeters, using degrees and radians.
7. Be able to use trigonometry to find the area of triangles.
8. Be able to use an understanding of compound shapes and properties of circles to find surface areas of prisms, using degrees and radians.
9. Be able to use an understanding of compound shapes and properties of circles for finding volumes of prisms, cones, pyramids and spheres.
10. Be able to use an understanding of trigonometry to find side lengths and angles in 2D and 3D.
11. Be able to use an understanding of trigonometry to discover sine rule and cosine rule within non-right angle triangles.
12. Be able to apply trigonometry in reallife situations including bearings.
13. Understand how the unit circle relates to the trigonometric graphs and be able to use it to find related angles.
14. Be able to solve simple trigonometric equations and use the unit circle to find solution sets.
1. Be able to identify generalisations of quadratic and cubic sequences.
2. Be able to identify generalisations of non-standard sequences.
3. Use patterns to generalise arithmetic or geometric series.
4. Be able to apply geometric series within a variety of contexts.
5. Be able to find the sum of an infinite series.
6. Be able to use patterns to develop generalisations of index laws involving real exponents.
7. Understand how a quadratic expression can be factorised into linear factors and vertex form.
8. Be able to use polynomial division.
9. Be able to factorise higher order polynomials.
10. Understand and be able to apply the factor theorem and the remainder theorem.
11. Understand that the domain set is a list of all the values that can be inputted into a function.
12. Understand that the range set is a list of all the values that are generated by a function.
13. Understand that a quadratic function maps a domain set onto a range set which generates a parabola when represented on the coordinate plane.
14. Understand that an exponential function maps a domain set onto a range which has a limit.
15. Understand that domain and range sets can be restricted leading to horizontal, vertical and oblique asymptotes.
16. Understand that the range set of one function can become the domain of another, leading to composite functions.
17. Understand the relationship between the restrictions on domain and range sets for inverse functions
18. Understand that the range set of one function can be mapped onto the domain set, leading to inverse functions.
19. Understand that real-life quadratic relationships can be modelled by a quadratic function.
20. Understand that real-life periodic relationships can be modelled by a trigonometric function.
21. Understand that real-life relationships can be modelled by an exponential function.
22. Be able to solve complex equations with higher order algebraic fractions. be able to solve complex equations with irrational solutions.
23. Be able to solve simple exponential equations with the same base by comparing exponents.
24. Be able to solve exponential equations by using logarithms.
19. Understand the concept of arrangements and be able to describe them with factorial notation.
20. Understand that repeated arrangements (order does not matter) can be cancelled out and efficiently calculated by consideration of combinations.
21. Be able to apply combinations within probability theory.
22. Be able to flexibly and efficiently use array systems to perform multiple operations simultaneously.
23. Be able to multiply two matrices.
24. Be able to calculate determinants and inverse matrices for 2x2 systems.
12. Understand that there is pattern and structure within random events.
13. Understand that the number of possible outcomes can be efficiently determined by considering combinatorics.
14. Understand that theoretical probability under defined conditions can lead to probability models.
15. Understand when and how to use the Binomial Distribution and Normal Distribution models to calculate the probability of events.
16. Understand that expected outcomes can be determined efficiently using probability models.
17. Understand that visual representations can be used to demonstrate sample space and the effect of introducing conditions.
18. Understand that events can be independent or dependent.
19. Understand why events can be mutually exclusive and how we can represent this on a Venn diagram.
20. Understand the relationship between individual probabilities and conditional probabilities.
21. Be able to describe probabilities using correct notation.
15. Be able to use simple Pythagorean trigonometric identities to solve trigonometric equations.
16. Application of embedded skills.
17. Be able to calculate the gradient of a perpendicular line.
25. Be able to solve exponential equations by using logarithms within quadratic equations.
26. Understand the relationship between the independent and dependent variables in a linear equation compared to a linear inequality.
27. Understand the relationship between the independent and dependent variables in a quadratic equation compared to quadratic inequality.
28. Understand that linear inequality results in a set of solutions.
29. Understand that quadratic inequality results in a set of solutions.
30. Understand that the solution to simultaneous linear and quadratic equations satisfies both equations independently.
31. Understand that the solution to simultaneous quadratic equations satisfies both equations independently.
32. Understand that there could be none-1-2 solutions to simultaneous linear and quadratic equations.
33. Understand that there could be none-1-2 solutions to simultaneous quadratic equations.
34. Understand that domain and range sets can be transformed and be able to predict the effect on the graphical representation on the coordinate plane.
35. Understand that function formulae can be determined by considering the transformation of a parent function.
36. Be able to apply transformations to a trigonometric function.
37. Understand the relationship between transformation notation and the effect on the graphical representation on the coordinate grid.
38. Understand the concept of rates of change.
39. Understand the concept of a limit within the context of the gradient function.
40. Be able to differentiate simple polynomials.
41. Be able to find the gradient function from first principles for polynomial functions.
42. Be able to prove curriculum theorems.
43. Understand the concept of proof by induction via matrix pattern investigations.
1. Be able to use scientific notation within a variety of applied contexts.
2. Understand when to round to a given number of significant figures.
3. Understand the significance of percentage error when approximating calculations.
4. Use the absolute values within, errors, calculus and logarithms
5. Be able to graph the modulus function
6. Apply logarithm skills within the areas of Calculus, further functions, trigonometry.
7. extend the use of logarithms to solve complex equations
8. Understand that quadratic equations can have non-real roots and be able to relate to the function
9. Understand the concept of imaginary roots and roots as complex numbers.
10. Flexibly and efficiently use imaginary and complex numbers for addition and subtraction
11. Flexibly and efficiently use imaginary and complex numbers for multiplication and division
12. Be able to manipulate factorial algebra
13. Understand that repeated arrangements (order does matter) can be cancelled out and efficiently calculated by consideration of permutations
14. Be able to apply Combinations within the binomial expansion.
15. Be able to apply Combinations within the binomial distribution
16. Understand that repeated arrangements (order does not matter) can be cancelled out and efficiently calculated by consideration of combinations
17. Be able to apply combinatorics to within other contexts including complex restrictions.
18. Understand the concept of an imaginary number, be able to perform arithmetic operations with imaginary and complex numbers
1. Be able to determine the correct method of sampling for a given data set
2. Understand the effect adding constants to a data set has on the mean and the standard deviation.
3. Understand that a linear relationship between two variables can be quantified by the Pearson Correlation Coefficient.
4. Understand that the relationship between two variables can be modelled with the linear regression line and that the linear regression line function is found by minimising errors.
5. Be able to apply integration to probability density functions.
6. Be able to manipulate expectation algebra
7. Be able to manipulate set notation.
8 Understand that there are patterns and structure within random events.
9. Understand that theoretical probability under defined conditions can lead to probability models.
10. Understand when and how to use the Binomial Distribution and Normal Distribution models to calculate the probability of events.
11. Understand that expected outcomes can be determined efficiently using probability models.
12. Understand that the number of possible outcomes can be efficiently determined by considering combinatorics.
1. Be able to solve simple trigonometric equations and use the unit circle to find solution sets
2. Be able to use simple Pythagorean trigonometric identities to solve trigonometric equations
3. Be able to use double angle trigonometric identities to solve trigonometric equations (not tangent)
4. Be able to form and use composite trigonometric functions
5. Be able to use double angle tangent identity, reciprocal and inverse identities to solve trigonometric equations
6. Be able to use compound angle identities to solve trigonometric equations
7. Understand the concept of a vector
8. Be able to describe transformations in 2D vector form
9. Be able to describe vectors in 2D component (i, j)
10. Be able to perform operations with vectors geometrically
11. Be able to find the vector joining two points
12. Be able to find the scalar product
13. Be able to find the angle between two vectors
14. Be able to find the point of intersection of two vectors
15. Be able to determine intersection or skew
16. Be able to apply to kinematic problems
17. Be able to describe all points in a plane using various vector plane equations
1. Be able to identify arithmetic and geometric sequences.
2. Be able to apply sequences within finance
3. Be able to find the sum of arithmetic and geometric series
4. Be able to find the sum of an infinite series
5. Be able to manipulate expressions using sigma notation
6. Be able to prove the sum of a series using proof by induction
7. Be able to identify and use the Maclaurin Series
8. Be able to apply index laws within unfamiliar contexts
9. Be able to use the Binomial expansion to raise binomial brackets to higher powers
10. Be able to express a quotient as the sum of two separate algebraic fractions
11. Be able to use polynomial divisions
12. Be able to factorise higher order polynomials
13. Understand and be able to apply the factor theorem and the remainder theorem
14. Be able to find the sum and products of roots of polynomials
15. Be able to use partial fractions to convert improper algebraic fractions to mixed algebraic expressions
16. Understand that the domain set is a list of all the values that can be inputted into a function.
17. Understand that the range set is a list of all the values that are generated by a function.
18. Understand that a Quadratic function maps a domain set onto a range set that generates a parabola when represented on the coordinate plane
19. Understand that an exponential function maps a domain set onto a range which has a limit.
20. Understand that the inequality function maps a domain set onto a range area, be able to identify the feasible region.
21. Understand that domain and range sets can be restricted leading to horizontal and vertical asymptotes.
22. Understand the concept of the modulus function
23. Understand how rational functions can have holes, oblique asymptotes and be able to identify the asymptotes using polynomial division
24. Understand that mapping a trigonometric function forms a periodic graph when represented on a coordinate grid.
25. Understand that the relationship between the restrictions on domain and range sets for composite functions
26. Understand the concept of Odd and Even functions
27. Understand that the relationship between the restrictions on domain and range sets for inverse functions Understand that a trigonometric model is used for periodic behaviour data
28. Be able to solve equations graphically for a variety of complex functions be able to solve systems of equations using matrices.
19. Understand that imaginary and complex numbers can be represented on the complex plane (Argand diagram). Be able to express complex numbers in polar form and manipulate complex algebra using trigonometric identities
20. Understand the concept of roots of complex numbers and unity
21. Be able to solve systems of equations using matrices.
22. Be able to find the perpendicular vector to 2 or 3 planes by using the determinant
18. Be able to find the vector equation describing the line where 2 or 3 vector planes intersect
19. Be able to find the angle between two planes and a line and a plane
20. Be able to find the Vector product
21. Be able to combine two linear vectors
22. Understand the concept of linear independence of vectors
29. Understand that domain and range sets can be transformed and be able to predict the effect on the graphical representation on the coordinate plane.
30 Understand that function formulae can be determined by considering the transformation of a parent function.
31 Understand the concept of a modulus function as a transformation
32 Be able to apply transformations to a trigonometric function.
33 Understand the relationship between transformation notation and the effect on the graphical representation on the coordinate grid.
34 Be able to apply transformations to trigonometric functions
35 Understand the concept of a limit and convergence and divergence
36 Be able to find the gradient function from first principles for polynomial functions
37 Understand the concept of rates of change.
38 Understand the concept of a limit within the context of the gradient function.
39 Be able to differentiate simple polynomials.
40. Be able to find the gradient function from first principles for polynomial functions.
41. Be able to differentiate complex functions from first principles
42 Be able to determine maximum points, minimum points , points of inflection and be apply to optimisation problems
43 Be able to find the equation of tangents and normals for all functions.
44 Be able to use the chain rule, product rule and quotient rule with all combinations of functions
45 Be able to integrate polynomial, logarithm and trig functions using direct reverse, inspection and substitution methods
46 Be able to apply integration to areas under a curve and between 2 curves
47 Be able to apply calculus methods to kinematics problems - no gdc
48 Application of all differentiation techniques to include the reciprocal trigonometric and inverse trigonometric functions
49. Be able to integrate reciprocal and inverse trigonometric functions within area and volume context
50 Be able to use integration by parts and complex substitution
51. Be able to find the non-stationary point of inflection
52 Be able to calculate related rates of change
53 Be able to differentiate implicitly
54. Formal consideration of limits - including L’Hopitals
55. Be able to solve first order differential equations using Euler’s method, separation of variables and the integrating factor
56 Understand and be able to use Maclaurin Series
57. Understand the LHS to RHS as a series of logical steps to demonstrate equivalence.
58. Simple proof of curriculum theorems
59. Be able to prove recurrence relations using proof by induction
60 Understand the concept of proof by contradiction
1. Be able to use scientific notation within a variety of applied contexts.
2. Understand when to round to a given number of significant figures.
3. Understand the significance of percentage error when approximating calculations.
4. Use the absolute values within, errors, calculus and logarithms
5. Apply logarithm skills within the areas of Calculus, further functions, trigonometry.
6. Extend the use of logarithms to solve complex equations
7. Understand that quadratic equations can have non-real roots and be able to relate to the function
8. Be able to manipulate factorial algebra
9. Be able to apply Combinations within the binomial expansion.
10. Be able to apply Combinations within the binomial distribution
1. Be able to determine the correct method of sampling for a given data set
2. Understand the effect adding constants to a data set has on the mean and the standard deviation.
3. Understand that a linear relationship between two variables can be quantified by the Pearson Correlation Coefficient.
4. Understand that the relationship between two variables can be modelled with the linear regression line and that the linear regression line function is found by minimising errors.
5. Be able to manipulate set notation.
6. Understand that there are patterns and structure within random events.
7. Understand that theoretical probability under defined conditions can lead to probability models.
8. Understand when and how to use the Binomial Distribution and Normal Distribution models to calculate the probability of events.
9. Understand that expected outcomes can be determined efficiently using probability models.
1. Be able to solve simple trigonometric equations and use the unit circle to find solution sets
2. Be able to use simple Pythagorean trigonometric identities to solve trigonometric equations
3. Be able to use double angle trigonometric identities to solve trigonometric equations (not tangent)
4. Be able to form and use composite trigonometric functions
1. Be able to identify arithmetic and geometric sequences.
2. Be able to apply sequences within finance
3. Be able to find the sum of arithmetic and geometric series
4. Be able to find the sum of an infinite series
5. Be able to apply index laws within unfamiliar contexts
6. Be able to use the Binomial expansion to raise binomial brackets to higher powers
7. Understand that the domain set is a list of all the values that can be inputted into a function.
8. Understand that the range set is a list of all the values that are generated by a function.
9. Understand that a Quadratic function maps a domain set onto a range set that generates a parabola when represented on the coordinate plane
10. Understand that an exponential function maps a domain set onto a range which has a limit.
11. Understand that domain and range sets can be restricted leading to horizontal and vertical asymptotes.
12. Understand that mapping a trigonometric function forms a periodic graph when represented on a coordinate grid.
13. Understand that the relationship between the restrictions on domain and range sets for composite functions
14. Understand that the relationship between the restrictions on domain and range sets for inverse functions
15. Understand that a trigonometric model is used for periodic behaviour data
16. be able to solve equations graphically for a variety of complex functions
17. Understand that domain and range sets can be transformed and be able to predict the effect on the graphical representation on the coordinate plane.
18. Understand that function formulae can be determined by considering the transformation of a parent function.
19. be able to apply transformations to a trigonometric function.
20. Understand the relationship between transformation notation and the effect on the graphical representation on the coordinate grid.
21. Be able to apply transformations to trigonometric functions
22. Understand the concept of a limit and convergence
23. Be able to find the gradient function from first principles for polynomial functions
24. Understand the concept of rates of change.
25. Understand the concept of a limit within the context of the gradient function.
26. Be able to differentiate simple polynomials.
27. Be able to find the gradient function from first principles for polynomial functions.
28. Be able to determine maximum points, minimum points , points of inflection and be apply to optimisation problems
29. Be able to find the equation of tangents and normals for all functions.
30. Be able to use the chain rule, product rule and quotient rule with all combinations of functions
31. Be able to integrate polynomial, logarithm and trig functions using direct reverse, inspection and substitution methods
32. Be able to apply integration to areas under a curve and between 2 curves
33. Be able to apply calculus methods to kinematics problems - no gdc
34. Understand the LHS to RHS as a series of logical steps to demonstrate equivalence.
35. Simple proof of curriculum theorems
1. Understand the number system and its sets (natural, whole, integers, rational, irrational, real, imaginary and complex)
2. Be able to use scientific notation within a variety of applied contexts
3. Understand when to round to a given number of significant figures.
4. Understand the significance of percentage error when approximating calculations.
5. Use the absolute values within, errors, calculus and logarithms
6. Be able to use logarithms as models using technology.
7. Apply logarithm skills within the areas of Calculus, further functions, trigonometry.
8. Understand that quadratic equations can have non-real roots and be able to relate to the function
9. Understand the concept of imaginary roots and roots as complex numbers.
10. Flexibly and efficiently use imaginary and complex numbers for addition and subtraction
11. Flexibly and efficiently use imaginary and complex numbers for multiplication and division
12. Be able to manipulate factorial algebra
13. Be able to apply Combinations within the binomial distribution
14. Understand the concept of an imaginary number, be able to perform arithmetic operations with imaginary and complex numbers
15. Understand that imaginary and complex numbers can be represented on the complex plane (Argand diagram). Be able to express complex numbers in polar form and manipulate complex algebra using trigonometric identities
16. Understand the concept of roots of complex numbers and unity
1. Be able to determine the correct method of sampling for a given data set
2. Understand the effect adding constants to a data set has on the mean and the standard deviation.
3. Understand that a linear relationship between two variables can be quantified by the Pearson Correlation Coefficient.
4. Understand that the relationship between two variables can be modelled with the linear regression line and that the linear regression line function is found by minimising errors.
5. Understand that ranked data correlation can be quantified using the Spearman’s Rank correlation coefficient.
6. Be able to manipulate set notation.
7. Understand that there are patterns and structure within random events.
8. Understand that theoretical probability under defined conditions can lead to probability models
9. Understand when and how to use the Binomial Distribution, the Poisson Distribution and Normal Distribution models to calculate the probability of events.
10. Be able to apply matrices to probability
1. Be able to use perpendicular bisectors to find the optimal distance in real life context
2. Application of embedded skills.
3. Be able to use Voronoi diagrams
4. Be able to apply adjacency matrices within graph theory. Be able to produce and use tree and cycle algorithms
5. Understand the concept of a vector
6. Be able to describe transformations in 2D vector form
7. Be able to describe vectors in 2D component (i, j)
8. Be able to perform operations with vectors geometrically
9. Be able to find the vector joining two points
10. Be able to find the scalar product
11. Be able to find the angle between two vectors
12. Be able to find the point of intersection of two vectors
13. Be able to determine intersection or skew
14. Be able to apply to kinematic problems
1. Be able to identify arithmetic and geometric sequences. Be able to apply sequences within finance
2. Be able to apply sequences within finance
3. Be able to find the sum of arithmetic and geometric series
4. Be able to find the sum of an infinite series
5. Be able to apply arithmetic and geometric sequences within finance
6. Be able to manipulate expressions using sigma notation
7. Be able to apply index laws within unfamiliar contexts
8. Be able to express a quotient as the sum of two separate algebraic fractions
9. Understand that the domain set is a list of all the values that can be inputted into a function.
10. Understand that the range set is a list of all the values that are generated by a function.
11. Be able to create, fit and use models for a range of functions
12. Understand that a trigonometric model is used for periodic behaviour data
13. Be able to use and apply log-log graphs, logistic and piecewise functions
14. Be able to solve equations graphically for a variety of complex functions
15. Be able to solve systems of equations using matrices.
16. Understand that domain and range sets can be transformed and be able to predict the effect on the graphical representation on the coordinate plane.
17. Understand that function formulae can be determined by considering the transformation of a parent function.
18. Be able to apply transformations to a trigonometric function.
19. Understand the relationship between transformation notation and the effect on the graphical representation on the coordinate grid.
20. Be able to apply transformations to trigonometric functions
21. Be able to use log-log transformation
22. Be able to use matrices for combinations of geometrical transformations and use transformations as models
23. Understand the concept of rates of change.
24. Understand the concept of a limit within the context of the gradient function.
17. Be able to apply complex numbers and the complex plane within real life situations
18. Be able to solve systems of equations using matrices. Application of matrix methods to solving systems of equations, coordinate set transformations and probability.
11. Understand that expected outcomes can be determined efficiently using probability models.
12. Be able to use Goodness of Fit tests and the Test of Independence
13. Be able to use hypothesis testing and confidence intervals for the population mean
25. Be able to differentiate simple polynomials.
26. Be able to find the gradient function from first principles for polynomial functions.
27. Be able to determine maximum points, minimum points , points of inflection and be able to apply to optimisation problems
28. Be able to find the equation of tangents and normals for all functions.
29. Be able to use the trapezium rule to calculate areas under curves
30. Be able to use the gdc efficiently to determine gradient , area and volume values in a practical context.
31. Be able to apply calculus methods to kinematics problems using the GDC
32. Be able to apply calculus methods to problems involving rates of change and related rates of change using the GDC
33. Be able to apply integration to areas under a curve and to volumes of revolution about the x axis
34. Be able to set up first order differential equations using numerical and analytical methods
35. Understand and be able to use slope field diagrams
36. Be able to solve coupled and second order differential equations in an applied context
37. Understand the LHS to RHS as a series of logical steps to demonstrate equivalence.
1. Be able to use scientific notation within a variety of applied contexts.
2. Understand when to round to a given number of significant figures.
3. Understand the significance of percentage error when approximating calculations.
4. Use the absolute values within, errors, calculus and logarithms
5. Be able to use logarithms as models using technology.
6. Understand that quadratic equations can have non-real roots and be able to relate to the function
1. Be able to determine the correct method of sampling for a given data set
2. Understand the effect adding constants to a data set has on the mean and the standard deviation.
3. Understand that a linear relationship between two variables can be quantified by the Pearson Correlation Coefficient.
4. Understand that the relationship between two variables can be modelled with the linear regression line and that the linear regression line function is found by minimising errors.
5. Understand that ranked data correlation can be quantified using the Spearmans Rank correlation coefficient.
6. Be able to manipulate set notation.
7. Understand that there are patterns and structure within random events.
8. Understand that theoretical probability under defined conditions can lead to probability models.
9. Understand when and how to use the Binomial Distribution and Normal Distribution models to calculate the probability of events.
10. Understand that expected outcomes can be determined efficiently using probability models.
11. Be able to use Goodness of Fit tests and the Test of Independence
1. Be able to use perpendicular bisectors to find the optimal distance in real life context
2. Be able to use Voronoi diagrams
1. Be able to identify arithmetic and geometric sequences. Be able to apply sequences within finance
2. Be able to apply sequences within finance
3. Be able to find the sum of arithmetic and geometric series
4. Be able to find the sum of an infinite series
5. Be able to apply arithmetic and geometric sequences within finance
6. Be able to apply index laws within unfamiliar contexts
7. Not on this syllabus
8. Understand that the domain set is a list of all the values that can be inputted into a function.
9. Understand that the range set is a list of all the values that are generated by a function.
10. Be able to create, fit and use models for a range of functions
11. Understand that a trigonometric model is used for periodic behaviour data
12. Be able to solve equations graphically for a variety of complex functions
13. Understand that domain and range sets can be transformed and be able to predict the effect on the graphical representation on the coordinate plane.
14. Understand that function formulae can be determined by considering the transformation of a parent function.
15. Be able to apply transformations to a trigonometric function.
16. Understand the relationship between transformation notation and the effect on the graphical representation on the coordinate grid.
17. Be able to apply transformations to trigonometric functions
18. Understand the concept of rates of change.
19. Understand the concept of a limit within the context of the gradient function.
20. Be able to differentiate simple polynomials.
21. Be able to find the gradient function from first principles for polynomial functions.
22. Be able to determine maximum points, minimum points , points of inflection and be apply to optimisation problems
23. Be able to find the equation of tangents and normals for all functions.
24. Be able to use the trapezium rule to calculate areas under curves
25. Be able to use the gdc efficiently to determine gradient , area and volume values in a practical context
26. Understand the LHS to RHS as a series of logical steps to demonstrate equivalence.
The development of ISB’s Mathematics Continuum involved a Committee of teachers representing different age groups and school sections. The First ISB Mathematics Continuum was implemented in August 2018. This version is the outcome of the review undertaken in 2021 by Mathematics Curriculum leaders from Junior, Middle and Senior School to meet the developments of mathematics in Junior School. The New Brunswick Curriculum was the key driver for this review in Junior School.
If you have questions about the Mathematics programme at ISB, please contact:
Junior School, EC1- Grade 5: Mathematics Coordinator, Gail Metcalf, gail.metcalf@isbasel.ch
Middle School, Grade 6-8: Head of Mathematics and Science, Christina Juurlink, christina.juurlink@isbasel.ch
Senior School, Grade 9- Grade 12: Head of Mathematics, Pierre Lacoste, pierre.lacoste@isbasel.ch