International Research Journal of Engineering and Technology (IRJET)
e-ISSN: 2395-0056
Volume: 09 Issue: 08 | Aug 2022
p-ISSN: 2395-0072
www.irjet.net
FRUIT DISEASE DETECTION AND CLASSIFICATION USING ARTIFICIAL INTELLIGENCE Shaik Naziya 1, Dr. C Sivaraj Ph.D.2 1Student, Department
of Computer Applications, Madanapalle institute of technology and science, India 2Asst. Professor, Department of Computer Applications, Madanapalle institute of technology and science, India -----------------------------------------------------------***-----------------------------------------------------------Abstract In the field of agriculture Fruits are affected by different climatic conditions. For the farmers it is very difficult to identify the fruits that are having disease or not. This will affect the global economy. By manual testing of fruits does not give the accurate output. In this method the fruit image is take to analyse the disease. The disease must be identified using colour, shape and size of the fruit. It will give the accurate result for farmers than the manual analysis of the fruits. Banana, apple and orange fruits are taken in this method. The system is already trained with different types of diseases that fruits are having. Input image given by the user undergoes with different kinds pre-processing steps. First the fruit image is resized in the required manner and the type of the fruit identified by the system. The fruits related to input image in the trained dataset must be analysed. And then features such as colour, shape and size are extracted from the image and image cluster is identified using k-means clustering algorithm. Next convolutional neural network(CNN) is used to find the fruit is infected or not infected. Experimental evaluation of the proposed approach is effective and 95% accurate to identify banana, apple and orange fruits disease.
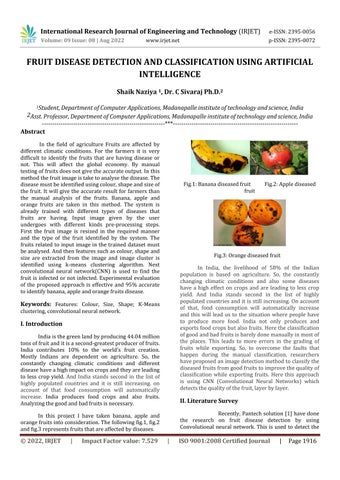
Fig.1: Banana diseased fruit fruit
Fig.3: Orange diseased fruit In India, the livelihood of 58% of the Indian population is based on agriculture. So, the constantly changing climatic conditions and also some diseases have a high effect on crops and are leading to less crop yield. And India stands second in the list of highly populated countries and it is still increasing. On account of that, food consumption will automatically increase and this will lead us to the situation where people have to produce more food. India not only produces and exports food crops but also fruits. Here the classification of good and bad fruits is barely done manually in most of the places. This leads to more errors in the grading of fruits while exporting. So, to overcome the faults that happen during the manual classification, researchers have proposed an image detection method to classify the diseased fruits from good fruits to improve the quality of classification while exporting fruits. Here this approach is using CNN (Convolutional Neural Networks) which detects the quality of the fruit, layer by layer.
Keywords: Features: Colour, Size, Shape; K-Means clustering, convolutional neural network.
I. Introduction India is the green land by producing 44.04 million tons of fruit and it is a second-greatest producer of fruits. India contributes 10% to the world’s fruit creation. Mostly Indians are dependent on agriculture. So, the constantly changing climatic conditions and different disease have a high impact on crops and they are leading to less crop yield. And India stands second in the list of highly populated countries and it is still increasing. on account of that food consumption will automatically increase. India produces food crops and also fruits. Analyzing the good and bad fruits is necessary.
II. Literature Survey Recently, Pantech solution [1] have done the research on fruit disease detection by using Convolutional neural network. This is used to detect the
In this project I have taken banana, apple and orange fruits into consideration. The following fig.1, fig.2 and fig.3 represents fruits that are affected by diseases.
© 2022, IRJET
|
Impact Factor value: 7.529
Fig.2: Apple diseased
|
ISO 9001:2008 Certified Journal
|
Page 1916