International Research Journal of Engineering and Technology (IRJET) e ISSN: 2395 0056
Volume: 09 Issue: 07 | July 2022 www.irjet.net p ISSN: 2395 0072

International Research Journal of Engineering and Technology (IRJET) e ISSN: 2395 0056
Volume: 09 Issue: 07 | July 2022 www.irjet.net p ISSN: 2395 0072
Abstract - This study presents the use of EPANET software in the design of water distribution network for Pohale Turf Borgaon. EPANET is a computer program that performs extended period simulation of hydraulic and water quality geste within pressurized pipe networks. The Components of network includes pipes, nodes, pumps, valves andreservoirs or a Tank., EPANET tracks the inflow of water in each pipe, the pressure at Nodes, the height of water in each tank, and the attention of a chemical species throughout the network, EPANET is designed to be a exploration tool for perfecting our understanding of the movement and fate of drinking water ingredients within distribution systems It can be used for numerous different kinds of operations in distributionsystems analysis. In this paper it's used for carrying out the hydraulic analysis of the distribution network in the study area. The results attained vindicated that the pressures at all junctions and the overflows with their rapidity at all pipes are doable enough to give acceptable water to the network of the study area
Key Words: EpanetSoftware,GoogleEarthPro,AutoCAD, WaterDemand,BaseFlow,PopulationForecasting.
Wateristhefundamentalhumanneed.Eachpersononearth requiresatleast20 50litersofclean,safewateradayfor drinking,cookingetc.Toobtainthebasicwaterrequirement agoodwaterDistributionsystemmustbecarryout.Water distribution systems consist of pipeline networks and associatedcomponents,mostofwhichisundergroundand mechanical stress from the surrounding soil, surface, and internalwaterpressure.Waterdistributionnetworkdesign is based on the proposed street plan and topography. Accordingtothereportthewateriswastedduetoleakage andthiefinspection,controlandplannedmaintenanceand rehabilitationprogramsarenecessarytoproperlyoperate existing water distribution system. In our project for resolving the major issues faced in Water Distribution SystemanewsystemofWaterDistributionwithvisualized PipeNetworkisintroducedforPohaleTurfBorgoanusing EpanetSoftwareasourkeySoftwareforbuildingthePipe
Network,GoogleEarthPro,GoogleEarthandAutoCADfor theotherworks.
Thepopulationforecastinganddesignofwaterdistribution systemhelpinmaintainingwaterquality,reducewastageof water,efficiencyofwater,byforecastingthepopulationof village/city we can pre calculate the water demand and deliver water to all customers of the system in sufficient quantityfordrinkingwaterattheappropriatepressurewith minimallossofsafeandacceptablequalityaseconomically aspossible.
Theobjectiveofthedistributionsystemistosupplywater toeachandeveryhouse,industrialplantsandpublicplaces. Eachhousemustbesuppliedwithsufficientquantityofwater atthedesiredpressure.Thereforethewaterhastobetaken to the roads and streets in the city and finally to the individualhouses.Thisfunctionofcarryingthewaterfrom thetreatmentplanttotheindividualhomesisaccomplished througha well planned distributionsystem.Adistribution system therefore consists of pipe lines of various sizes for carryingwatertothestreets;valvesforcontrollingtheflow, service connections to the individual homes, distribution reservoirsforstoringthewatertobefedintothedistribution pipes. The water may either be pumped directly into the distributionpipes,oritmaybefirststoredinadistribution reservoirandthenfedintothedistributionpipes.Themain purposeofthedistributionsystemsistodevelopadequate waterpressureatvariouspointsi.e.,attheconsumer'stap and the choice of the distribution and its elevation with respecttothelocationofthewatertreatmentplants.
Toanalyzeandforecastpopulationfor3decades.
Todeterminethewaterdemandforthevillage;current andfuturedemands.
To study and find out the problem exist in water distributionsystem.
2022, IRJET | Impact Factor value: 7.529 | ISO 9001:2008 Certified Journal

International Research Journal of Engineering and Technology (IRJET) e ISSN: 2395 0056
Volume: 09 Issue: 07 | July 2022 www.irjet.net p ISSN: 2395 0072
TopreparehydraulicnetworkusingE panetsoftware.
TodesignWaterDistributionsysteminlessamountof timeandeconomicallyusingEpanetSoftware.
Toestimatetheamountofwaterusedbythevillage
Thestudyofwatersupplydistributionnetworkhasalways beenofkeeninteresttoresearchers,scholars,andstudents. In a research presented as “Analysis and Design of Water DistributionNetworkUsingEPANETforChiralaMunicipality in Prakasam District of Andhra Pradesh”, [G. Anisha et al. 2016],anetworkislaidaccordingtooldday’srequirement andisnotsuitabletothefuture(2041)needsanddemands. The network was proposed according to the master plan keeping in view the ease and accessibility of the network withroadsideandstraightasitwillhelpthelayingouteasy andlesscomplicated.Inthesudy,themodellingandanalysis werecarriedoutandtoincorporatethefutureneedsofthe city new location, bearing minimum cost and effort, was proposed based on EPANET software simulation result. A Studyontheshortageofwaterinsomespecificregionsof waterinAl Diwaniyacity,[MohammadAlietal.2012],was basedonlookingintotherealityofsupplywaterinthecity through the distribution network. The methodology consisted of two primary steps. First was to obtain the discharge of water in the supply network along with the direction of flow in the pipe network. This analysis and simulation were performed in 1998 version of program ‘Pipe++’. This step also gave the head available in each network node. Next step included the practical on site measurementoftheflowandpressureheadatdifferentones of the network. A combined analysis showed the area sufferingfromshortagesof waterandthepossiblereason behindit.Anotherstudywhichisrelevantistheoneinwhich EPANETsoftwarewasusedtodesignandanalyzethemulti village supply system with reference to technical sustainability,[K.Shitaletal.2016].Thestudypresentsthe hydraulicanalysisofpipelinenetworkofPunagamareanear Surat city using EPANET 2.0. This study brings out the simulationofexistingnetworkinPunagamareanearSurat city.Thenetworkisdividedintotwozonesandspansinan area of 600.83 Ha and comprises 109 junctions and 144 pipes. The study aimed at analyzing the behavior of the distributionnetworkandthepatternofflowandpressure headatvariousjunctionsandwithdifferentpipeflow.Inthe mentionedstudyitwasreportedthatthewaterwastaken from the source and was stored in the Ground Service Reservoir.Dependingontheneeditwaspumpeduptothe Elevated Storage Reservoir and from there the water was suppliedtothehousesviagravitysystemwhichisinclose connectionwiththisstudy.Thementionedstudytookinto accountthefutureneedsofthecityandconcludedthatthe pressure at each junction and flow through each pipe are sufficientwiththedemandofthecity.Thesimulationwas
alsocheckedandverifiedthepressureon field.Themodel was checked for negative pressure generation. In all the literature reviewed above the objective of analysis by performingthesimulationofthewatersupplydistribution network using EPANET as a hydraulic simulation tool is carried out and the network is optimized and any improvementissuggested.Thisstudycoversalltheaspect andgoesfurtherbeyondtooptimizeandthencalculatethe efficiencytherebyverifyingtheneedandutilityofOptimized network
InitiallythemapofstudyareawasextractedbyusingGoogle Earthprosoftware.Theobtainedmapwasthenopenedin AutoCADsoftwareandthenetworklinesalongtheroadsare drawn. After the CAD file was imported into EPANET and convertedintoNETWORKfile.Thenetworkfileisopenedin EPANETsoftware.Elevation,pipediameterandlengthofthe pipe had to be given to each node and to the pipe for hydraulicanalysis.Asperdesigncriteria,afterrectifyingall theWarningsanderrors,itisrunsuccessfully.Finallyallthe Resultantreportsaretakeninatabularcolumn.Theerror reports are generated and if the pressure, demand and supplyarenotsufficienttotheconsumer,thenweincrease thepipediameters.
ThestudyregionisextractedfromtheGoogleearthand wantstoconvertitintothebmp.Fileanditcanbeusedas backdrop for the designing of water network. If the backdropisready,thenstartdesigningthenetwork.Initially locatethenodes.Then,connectthenodeswithpipes.Ifthe networkplanisreadyforwholecampus,then startgiving thelength,diameter,roughnesscoefficientofthepipes.Ifthe modelisready,thenextstepistoassignwaterdemandand elevationfornodesintheplan.Andalsogivetheproperties ofthemainoverheadtank.
Thefollowingdatashouldbecarriedoutforthesimulation:
1.Collectionofdatafromlocalauthorities;
2. Calculation of future population by Arithmetic and GeometricalIncreasemethod;
3.CalculationofwaterdemandbyVillage;
4. Study and survey on the existing water distribution systemandanalyzationofproblems;
5.CapturingtheareaofthevillagebyGoogleEarthPro;
6. Taking out all important data from Google Earth Pro Application;
7.InputallthebasicdataonEpanetanddrawahydraulic network;
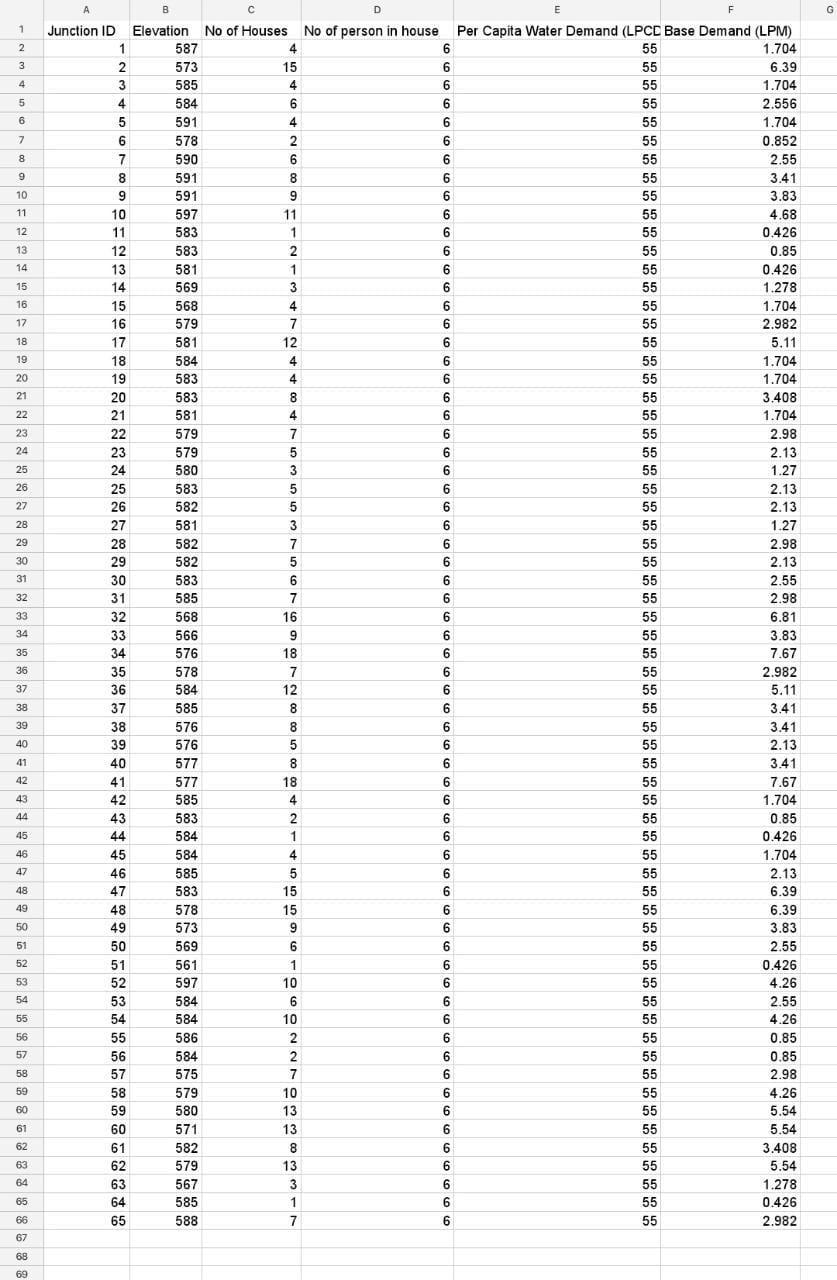
The factors such as elevation, base demand, diameter, roughnessisgivenateachnode.
International Research Journal of Engineering and Technology (IRJET) e ISSN: 2395 0056
Volume: 09 Issue: 07 | July 2022 www.irjet.net p ISSN: 2395 0072
A primary data are collected from Local and Municipal Authorities. The Secondary data are collected from Google Earth Pro, Google Map, previous literature, articles, v logs, research paperandbooks.
Populationforecastingisamethodtopredict/forecastthe futurepopulationofanarea.Usually,thepopulationsatthe design period of water supply system to find the water demand at that time, as the system are required to fulfill their purposes till the end of the design period. Methods which are used for the population projection are as given below
ForecastingMethods
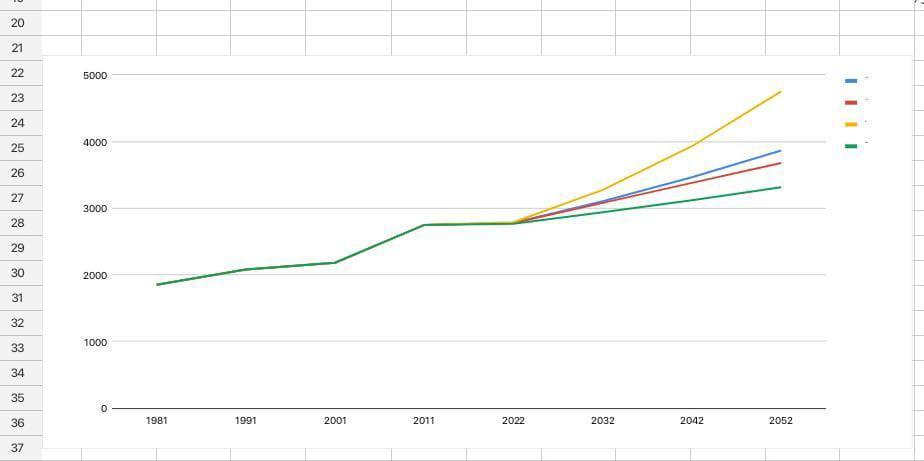
4 GRAPHICALMETHOD 3153 3591 4100 5 DECADALGROWTHMETHOD 60% 2939 3121 3314 AVG 3110 3497 3943 ADOPTED METHOD 3110 3497 3943 AVERAGE 191.6 575.1
TheaboveMethods areusedtoforecastingthepopulationof pohalevillagefortheyearsof2032,2042,2052.
Thebelowtablesareintroducedforcalculating/projecting thepopulationfortheyear2032,2042&2052. Sincetheyaretheassumedpopulationwetooktheaverage out of the three results and use them particularly for this project,inordertogetthemostaccurateresults Table 3: DetailedProjectReportforPopulation Projections
BluecolorindicateGeometricProgression,theYellowcolor indicate Incremental increase method, Red color indicate Arithmetic Progression and Green color indicate Decadal growthmethod.
Table 3: ProjectedWaterDemand
YEAR PROJECTED POPULATION LPCD DEMAND 2032 3110 x70 217700 2042 2042 x70 244790 2052 3943 x70 276010
The above table is the estimated population and water demands for the village of Pohale, the water required for eachpersonatthevillage/townareais70LPCD(Literper capitaperday).Inordertocalculatethewaterdemand,we multiplytheprojectedpopulationwith70LPCDandweget theprojectedwaterdemandfortheprojectedpopulationfor the years of 2032, 2042, 2052. Projected population x 70 (LPCD)=Projectedwaterdemand.
E.g3110x70=217700(thewaterdemandfortheyearof 2032).
International Research Journal of Engineering and Technology (IRJET) e ISSN: 2395 0056
Volume: 09 Issue: 07 | July 2022 www.irjet.net p ISSN: 2395 0072
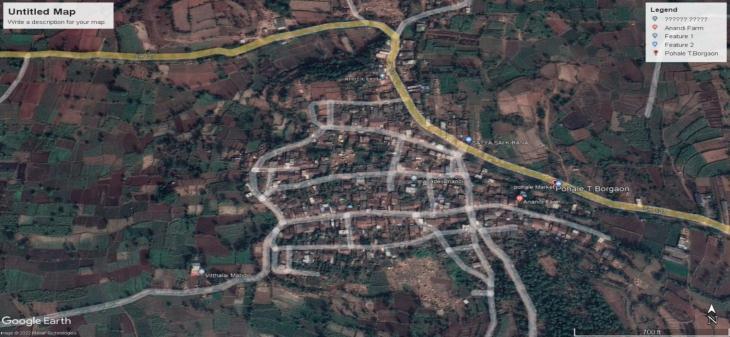
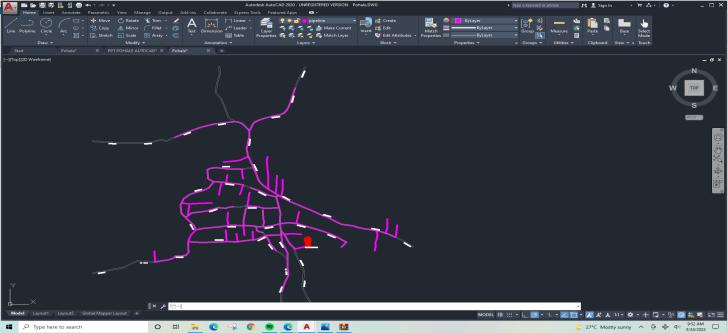
The study area (Pohale Turf Borgaon) was extracted by usingGoogleEarthprosoftware.Toobtainedthenetwork linealongtheroad.ByusingGoogleearthapplicationweget elevation at node as well as position of houses is visible. Whichhelpustocalculatenumberofhousesateachnode andalsohelpedustodrawthenetworkdiagrammoreeasy, TheobtainedmapwastransferredintoAutocadbyusing XREFcommand.XREFcommandisusedforimportingimage with a specific x, y, z coordinates and we align the XREF Googlecaptureimagewiththecorrectlinesandcoordinate then opened in Auto CAD software and the network lines alongtheroadsaredrawnusingPolyline.
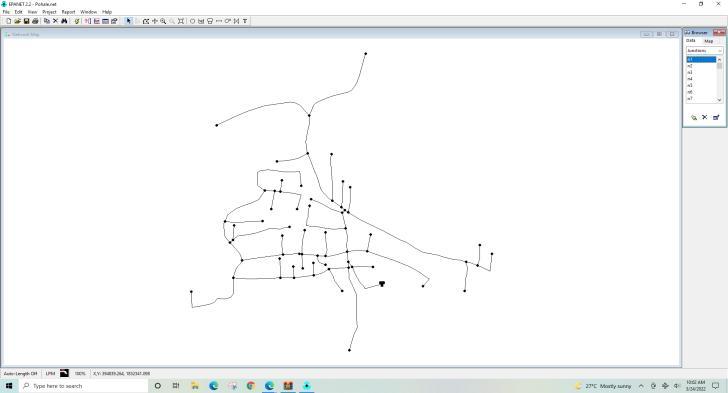
InitiallyaftertheCADfilewasconvertedintoNETWORKfile using Polylines. The network file is opened in EPANET software.Elevation,pipediameterandlengthofthepipehad to be given to each node and to the pipe for hydraulic analysis. As per design criteria, after rectifying all the Warningsanderrors,itisrunsuccessfully.
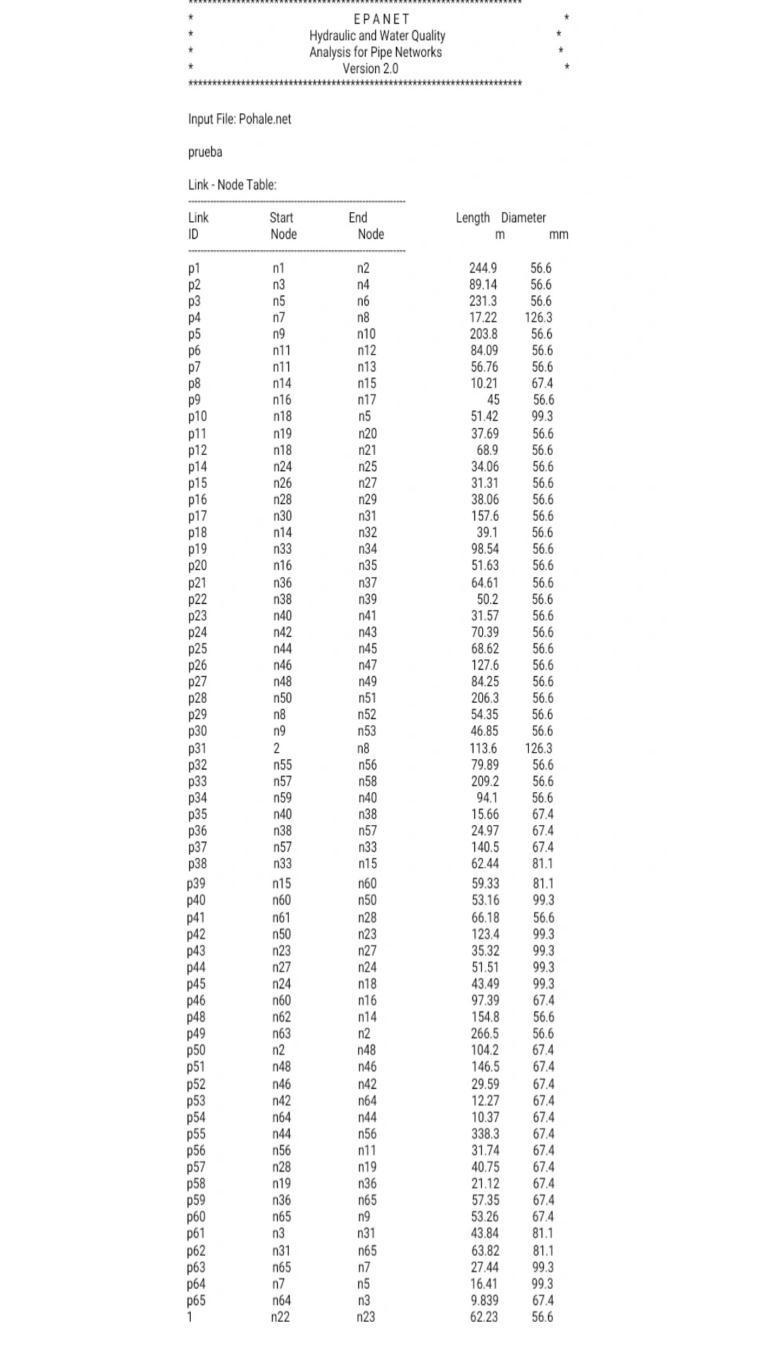
Fig 3: Network Image
Theabovefiguregiveusthatthenodetable,Itdeterminesthe differentnodesnamingandpipenumberswhichincludethe propertiesofthenetworkpipe,startnode,endnode,length anddiameter.
International Research Journal of Engineering and Technology (IRJET) e ISSN: 2395 0056
Volume: 09 Issue: 07 | July 2022 www.irjet.net p ISSN: 2395 0072
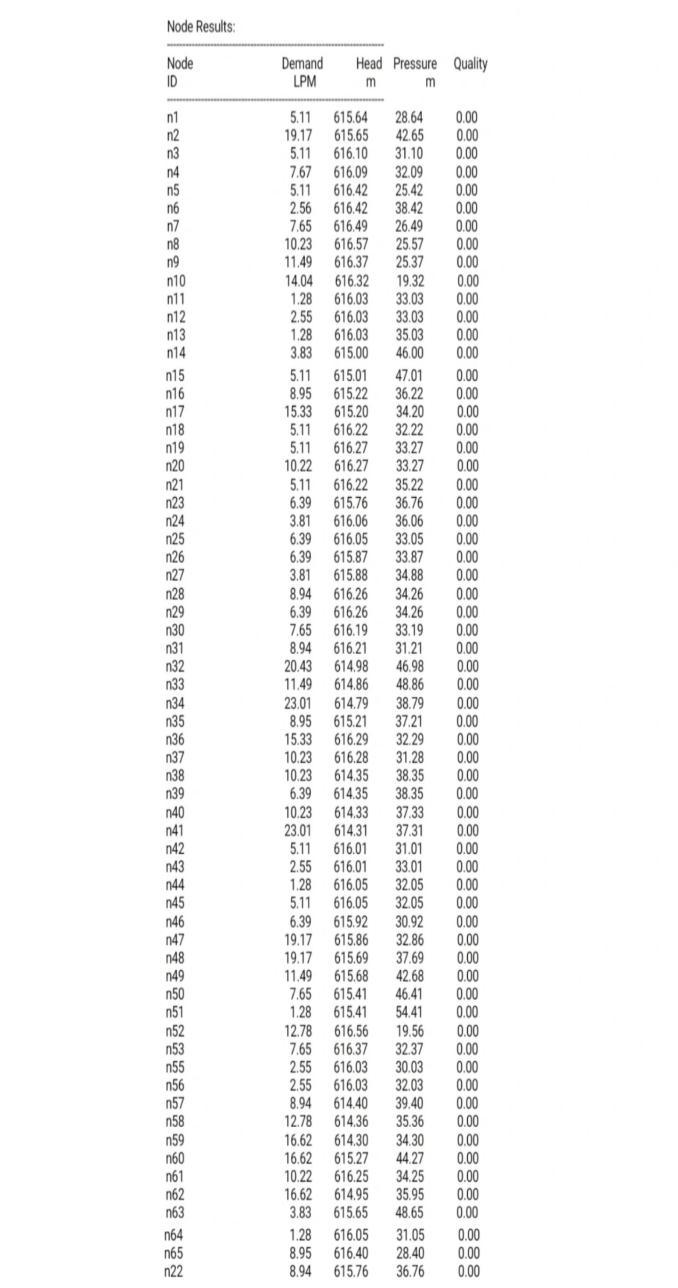
Theabovefigure showsthatthefinalresultofnode,which we obtained from inputting the data i.e. length, elevation, diameter&headloss
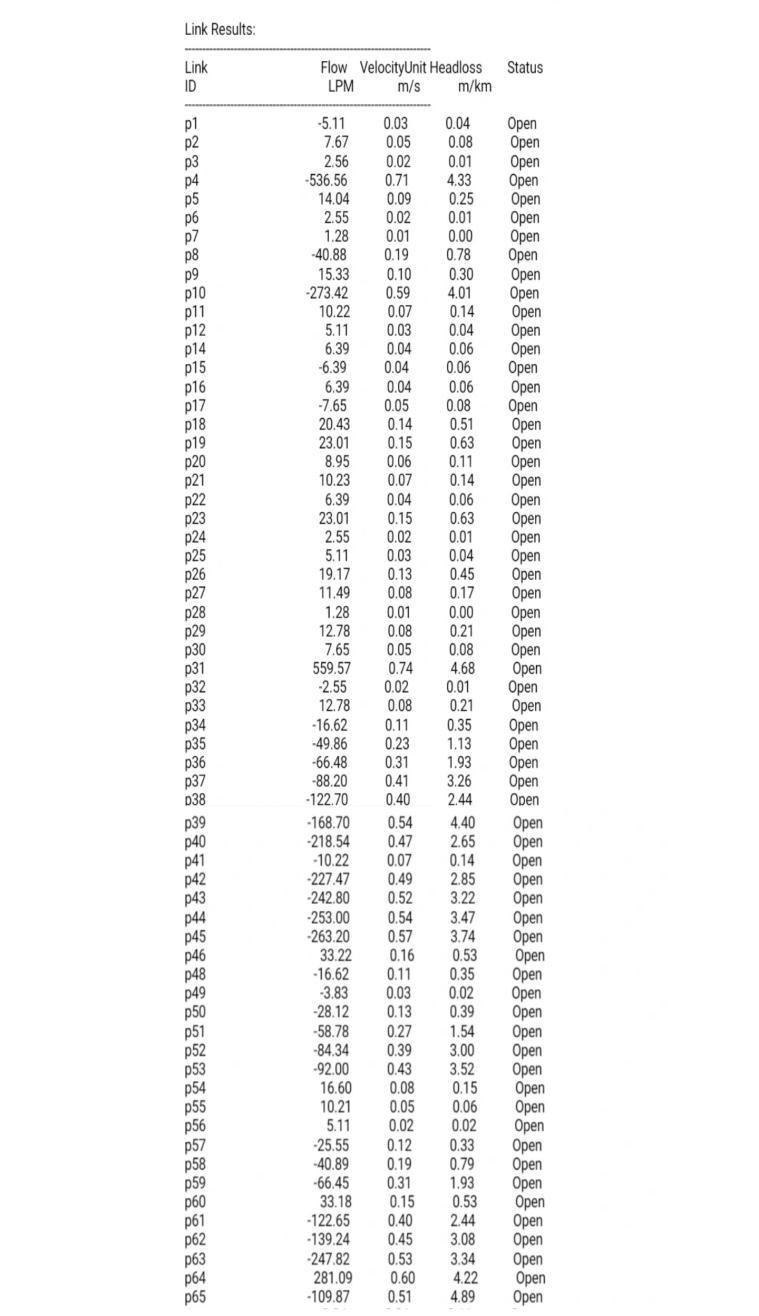
Figure5givesusthelinkresultofFlowinLPM,Velocityin m/s,headlossinm/kmandstatusofthepipe.
2022, IRJET | Impact Factor value: 7.529 | ISO 9001:2008 Certified
International Research Journal of Engineering and Technology (IRJET) e ISSN: 2395 0056
Volume: 09 Issue: 07 | July 2022 www.irjet.net p ISSN: 2395 0072
4. Pressure; The pressure is that occur inside liquid anditsexertedbyweightofliquiditself.TheS.Iunit ofpressureisPascal.Apascal canbedefinedasa forceofoneNewtonappliedoverasurfaceareaof onemetersquare.
5. Pipe velocity; Pipe velocity is an area averaged property which is dependent of the pipes cross sectional flow distribution and whether the flow. For example along the central axis fluid may be travelling at twice the calculated pipe velocity. V=1.274xq/d^2Visthepipevelocity(ms)qisthe volume flow (m3/s) d is the pipe inside diameter (m)
6. Headloss;Withinapipefrictionalcontactwiththe wallmeansthatfluidflowishighestonthepipeaxis and effectively zero at the pipe wall. In head loss resultsofthefrictionbetweenwallsofapipeand thefluid,thefrictionbetweenfluidparticlesasthey moverelativelytooneanotherandtheturbulence thatiscauseswheneverthefluidflowisredirected or obstructed in any way by components such as pipingentranceandexist,pump,valvesandfitting.
1. Node;Anodeisapointofintersection/connection within a data communication network. In an environment where all devices are accessible through the network, these devices are all considered nodes. The purpose of the node is to transmitdatatocommunicatewithothernodesin thenetwork.
2. Demand(LPM);LPM standsforlitersper minute (L/min) demand planning water is supply chain management process of forecasting or predicting the demand for water to ensure they can be deliveredandsatisfyconsumer.
3. Head;Assumethatyouhaveapumpthatyoucan disconnectthedischargepipeortubeandareable toextenditvertically.Headistheheightofwhicha pumpcanrisewaterup.
In this work, the water distribution system has been analysiswiththehelpofEPANETinwhichuse number of nodes,elevation,numberofpipesanddemandsofdifferent area.Firstwesurveyedtheareaandtakeinformationabout the population and per capita demand of the people. And accordingtothatweanalyzedthedistributionsystemforthe same. Here during the day time hours that is peak hours during morning time the demand of water is more as comparedtotheothertimesothemaximumsupplyisgiven for8hoursaday.Andconcludedthegraphwhichisobtained from EPANET shows that the demand is more during the peakhours.Thedifferentnodesshowdifferentvariationof pressures and demand. The method of distribution used hereiscombinedgravityandpumpingsystemasfirstlythe waterispumpedwiththehelpofpumpsfromunderground watersourcei.e.fromaquifersandthentheyareliftedupto theoverheadwatertanksandthroughtherewiththehelpof gravity system is transferred to the main rising pipe. The distributionlayoutusedhereistreesystem,loopsystemor dead end system which is according to the layout of the differentplaces.Selectedsourceiscapableofmeetingwater requirement of the system for the design period with due considerationtoclimatechange&anticipatedactivitiesin& around.Yieldofopenwellis164000L/dandrequiredwater is95900L/dhenceavailablesourceare sufficient to fulfill thedailydemandofvillagefornext30years
In steady state analysis, network run for next 15 and 30 yearstocheckwhetherdesignednetworkwillsustainornot. pressurevaluedecreaseaspopulationincreasefortheyear
International Research Journal of Engineering and Technology (IRJET) e ISSN: 2395 0056
Volume: 09 Issue: 07 | July 2022 www.irjet.net p ISSN: 2395 0072
of 15 and 30 years. And pressure head increase with decreaseinpressurevalue.
Rehabilitationhasdonetoeliminatepressuredropinpipe. In Pohale village 90% houses is of single storey as per CPHEEOmanualsinglestoreybuildingrequiredminimum 7mpressure.ByreplacingexistingpipeP56fromdiameter 67.4 to 100mm,and pressure value changed from 6.94 to7.05mwhichisfallunderrequiredrange.
We obtain the different results by imputing basic data in EPanetSoftwareandgottherequiredresultsi.e.thewater demand, nodal flow, base demand, pressure, etc. The networkisdesignedfortheyear2052.
We would like to thank our project guide “Professor Mr Millind Kumar Waghmare” for his guidance and support throughoutorjourneyincompletingthisproject.
Wewouldalsoliketoextendourgratitudetoourcollege“Dr JJMagdumCollegeofEngineering”forsupportingusinevery way; in particular our Civil Engineering Head of the Department,Dr.JagdishLambeforhischecksandguidance tillthefinalizationofthisproject.
[1].G.Anisha,A.Kumar,J.AshokKumarandP.SuvarnaRaju, “Analysis and Design of Water Distribution Network”, internationalJournalof,vol.03,no.ISSN:2394 3661,2016.
[2] Harsh Srivastava and Anupam Singhal, “Design and AnalysisofOptimizedWaterDistributionNetworkatBITS”, 2018.
[3]K.Shital,M.Krunali,D.MehtaandV.Yadav,“Simulation ofExistingWaterDistributionNetworkbyusingEPANET:,” GRDJournal,GlobalResearchandDevelopmentJournalfor Engineering,no.e ISSN:2455 5703,2016
Miss Biaknghinglovi is a resident from Mizoram stays at Jaysingpur for bachelor degree in Civil Engineeringcurrentlyworkingasa trainee Design Engineer at INDOVANCECOMPANY.(Student)


Miss Akanksha Sagar Kadam is residentfromKololi,sheispursuing her Bachelor Degree in Civil Engineering.(Student)
MissUjamaShamshuddinMullahis a resident from Kolhapur studying in last year B.Tech in Civil Engineering (Student)
Mr Lalramchhana,isaresidentfrom Mizoram,staysinJaysingpurforhis degreecourseinCivilEngineering.( Student)

2022, IRJET | Impact Factor value: 7.529 | ISO 9001:2008 Certified Journal