
INFRASTRUCTURE MAPPING FOR POST FLOOD DISASTER MITIGATION IN PALA MUNCIPALITY AND NEARBY PANCHAYATHS
1,2,3,4UG Scholar, Dept. of Civil Engineering, SJCET Palai, Kerala, India ⁵ Assistant Professor, Dept. of Civil Engineering, SJCET Palai, Kerala, India ***

Abstract This project is based on improving the existing disaster management system by reducing the post disaster effects of flood in Pala municipality and nearby panchayaths. Using this people could easily get access to the information regarding rescue camps operating nearby in case of disasters like floods. The purpose is to map the necessary amenities in the region which witnessed intense rainfall for rescue workers, who may be unaware of the terrain, to reach the spot without delay. The correctly mapped buildings in the area can generate enough data to help the concerned authorities/ rescue team to navigate to the affected areas even in the worst situations. Our topic highlights the formidable impact of humanitarian mapping efforts such as post disaster mapping campaigns to improve the spatial coverage of existing open geographic data and maps. The updated local maps in OSM can be accessed by the local people or the disaster management authorities of that area beforehand and can be used in an offline mode to navigate to the disaster affected area in case of a sudden pandemic or natural calamity. Google map may prove to be good when it comes to urban areas, but when it comes to rural areas OSM can prove to be a lot more accurate. This is achieved due to its simplicity and ease of use is the main reason why OSM can opt as the primary map for post disaster rescue works.
Key Words: Disaster management, flood, post disaster mapping, Open Street Map, Infrastructure mapping
1.INTRODUCTION
Aflood,beinganaturaldisaster,hasahugeimpactonboth individualsandcommunitiesandhassocial,economic,and environmental consequences. The impacts of a flash flood include loss of human life, damage to property, people being trapped, loss of documents, etc. The flood victims findnoquicksolution.It’simportantthatthesheltersthat protect beings from calamities be equipped with appropriate measures for dealing with such extremities. Depending on the rate of precipitation and the duration, floods are generally caused by heavy rainfall and thunderstorms. Extreme climatic shifts have been increasing in frequency in recent years as a result of inevitable global warming, which impairs the environment’snaturalabilitytorestoreitself.
Afloodcanbedefinedastheconditioninwhichthatland issubmergedinwaterthatisusuallyusedtobedry.Itcan
beattributedtoanunusuallyhighstageofariverorother waterbodieslikelakes,oceans,etcduringwhichthewater spillsover the bank andspreadto theadjoiningland. The low lying area adjacent to a river bank is called a flood plain,whichisformedmainlyofthesedimentsoftheriver and consists of very fertile soil. In the case of a flood, the water spills into the flood plains, which are heavily populated due to the benefits of abundant water and fertilegroundforirrigation.
Duetodifferentnaturalphenomenalikerainfalllastingfor alongerperiodoftime,monsoonseason,tropicalcyclones or a large amount of rapid snowmelt flood situations can occurinriversorotherdrainage. Whenthe waterlevel in coastal areas rises owing to a storm and mixes with the naturalhightide,thewaterflowsoverintoadjacentareas, generating a flood. In urban areas due to improper drainage systems sometimes due to high precipitation water can accumulate on the streets and maybe sometimes comes back into the building through sewers pipes when rainfall is higher than the drainage capacity. Theconditionoffloodcangetworseninthecaseofmajor infrastructure failure like dam failure etc. The consequence of floodscan bedevastating which including loss of life and financial losses. The flood can damage buildings, roads, bridges, etc. affecting normal life. Disruption of traffic movement leads to further delay in theaidprovidedtotheaffectedpeople.
Damage and destruction of communication links and infrastructure such as power plants, roads, and bridges cause people to leave their homes and disrupt their normal lives. Thousands of homes were destroyed and residents were forced to move to the nearest relief camp. Evacuating families and shifting them to relief camps are donetosurviveanykindoflifeloss.Flashfloodscantrapa person at home. Rescue requests need to be sent to the rescue team to save them and transport them to a safer place. But the rescue team didn't know how to find the right place. They would not be aware of what exact obstacles are there on the chosen route such as a lake, road, or any other features, that is, teams in a position don’thavepropergroundinformation.Beforedispatching rescue teams, you need to know where they are dispatched. Large areas of floods can obscure landmarks, divert unprepared rescuers, and prevent survivors from locating.
International Research Journal of Engineering and Technology (IRJET) e ISSN: 2395 0056
Volume: 09 Issue: 06 | June 2022 www.irjet.net p ISSN: 2395 0072
Our aim is to map all the infrastructures and public amenities which can be utilized in case of a flood or any other disaster which arise the need for rehabilitation, hospitalization, food storage, and food distribution. The areaswhichwould be mappedunderthisprojectarePala Municipality, Thalapalam Panchayath, and Bharananganam Panchayath which are prone to flood disasters. The Tools used for the same are Open Street Map (OSM) and uMap since the same can be used offline (OSM) to navigate to the affected places of rehabilitation centresincaseofnetworkissuesduringtheflood.Someof theamenitiesmarkedarePublicWarehouses,Apartments, andRationshops,Schools,Hospitals,andauditoriums.
After this project is finished, any citizen or authorities would be able to view the mapped amenities. The citizen candownloadandusethismapinofflinemodetonavigate to safer areas and the authorities could use the same for rescue and rehabilitation processes. The citizen and authoritieswouldbeabletoaccessthemostaccuratedata without depending on any other outside factors such as network connection. This would aid in a much faster rescueandrehabilitationprocess.
2. RELEVANCE OF INFRASTRUCTURE MAPPING
InAugust2018, Keralaexperiencedtheworstfloodssince 1924. The devastating food and associated landslides affected 5.4 million people and claimed over 400 lives. A post disaster assessment commissioned by the Kerala stategovernmentestimated economiclosstoexceedUS$ 3.8 million. More than 483 people have died and 140 are missing, but Economic Times reports that 33,000 have been rescued. Over 483 people died, and 140 are missing, while The Economic Times reported that 33,000 people were rescued. The Kerala Department of Disaster Management is alerting the state to severe floods. Many water treatment plants had to stop pumping water, resultingininadequateaccesstocleanwater,especiallyin thenortherncountiesofthestate.Over3,274reliefcamps have been set up in various locations to accommodate flood victims. The flooding has affected hundreds of villages, destroyed an estimated 10,000 km (6,200 mi) of roads and thousands of homes have been damaged or destroyed.
Withthecatastrophicfloodin2018,Keralaunderstoodthe significance of open records for the primary time. The existing map could not be used either because it was inaccessible or because it was not scientifically prepared foruseinaflooddisaster.Duetothelackofclearmapping of administrative boundaries, buildings and roads, local government ledrescueoperations couldnotbecarriedout properly. For the first time, because everything was underwater, Citizen Mapper realized the need to use landmarkcoordinates.
Through Mapathon Kerala, the Kerala Government will create a comprehensive local map of Kerala, including physical infrastructure, natural resources, and other information useful for planning and other developments. Thefreeonlinemappingplatform,OpenStreetMap(OSM), is used for this mapping event as part of Kerala government policy to strengthen activities focused onfree knowledge and Free and Open Source Software. This project is led by the Kerala Spatial Data Infrastructure (KSDI) under the Kerala IT Mission and is supported by other agencies. Project is supported by the Rebuild Kerala Initiative.AllworkisdonethroughOpenStreetMap.Open Street Map is a community driven, free to editable world map supported by the non profit Open Street Map Foundation.
3. OBJECTIVES
• To map public amenities and buildings this can be used forrehabilitation.
Itaimstocreatemicro levelmapsofthePalaMunicipality foridentifyingallthenaturalandphysicalassetsincluding physical infrastructure, natural resources, and other information that are useful for planning and other developments and implementing flood control and rehabilitationactivities.Someoftheamenitiesmarkedare Public Warehouses, Apartments, ration shops, Schools, Hospitals,andAuditoriums.
• To map ward boundaries for ease of recognition and road ways for ease of navigation in case of flood and landslides.
Flash floods can trap a person at home. Rescue requests need to be sent to the rescue team in order to save them andtransportthemtoasaferlocation.Buttherescueteam didn’tknowhowtofindtherightplace.Theywouldnotbe aware of what exact obstacles are there on the chosen route such as lake, road or any other features, that is, teams in position don’t have proper ground information. Before sending a rescue team, you need to know where youaresendingtherescueteam.Largeareasoffloodscan obscure landmarks, divert unprepared rescuers, and preventsurvivorsfromlocating.UsingOSMmappinghelps tomapswardboundariesandroadsforeaseofnavigation.
4. LITERATURE REVIEW
4.1 “Delineation of flood-prone areas in cliffed coastal regions through a procedure based on the geomorphic flood index” (Cinzia Albertini et al. 2021).
Flood prone locations are well represented by the Geomorphic Flood Index (GFI) approach. However, floodwatertransfersinundefinedinterbasin(UIBs),which
International Research Journal of Engineering and Technology (IRJET) e ISSN: 2395 0056
Volume: 09 Issue: 06 | June 2022 www.irjet.net p ISSN: 2395 0072
are intercluded tiny basins along the shoreline that are likely to be flooded by adjacent big rivers, are not taken into consideration by the technique. The current study solvesthisweaknessbyaddinganiterativetechniquethat takes into account UIBs and water transfers between basins to the GFI approach. A coastal basin in southern Italy was used to test the methodology, and the results were compared to a flood map generated by a two dimensionalhydraulicsimulation.
With the addition of the iterative technique, GFI performanceasamorphologicaldescriptorimprovedfrom 74% (standard method) to 94%. The proposed methodology,withthesameparameterization,wasapplied onasecondadjacentcoastalbasinobtainingimprovements both in terms of true positive (from 56 to 79%) and false negative rates (from 44 to 21%). Finally, a sensitivity analysis of the flood return periods highlighted a strong influence on model parameterization for return periods below 20 years. This achievement represents a new development in the application of the GFI method, which can help stakeholders in a more time and cost effective floodriskman agreementinhazardproneareas.
4.2 “Mapping urban public spaces based on the Nolli map method” (Huimin Ji and Wowo Ding 2021)
In 1748, Jean Battista Nolli published a large map that accuratelyportrayedtheformandsystemofRomanpublic space. This graphical presentation has become a powerful toolforurbanspaceresearch.However,giventhemultiple functions of modern urban spaces and public buildings of the increasinglycommon type, it isstill uncertain toapply the drawing principles of the Nolli map to modern cities. UsingtheexampleoftheLaochengnanareaofNanjing,this study examines the mapping of urban public spaces based on the Nolli mapping method. The field walk identifies publicandprivatespaceswithintheblock.
By comparing the graphic information of Nolli Map and Nolli TypeMapwithpublic,private,andgreenspaces,this work also revealsthesimilaritiesand differences between traditional and modern urban spaces. Urban spatial mapping methods such as black and white maps, street maps, and Nolli type maps are investigated and compared using complementary mapping techniques. It also describesthepracticalityandeffectivenessofeachmethod. Resultsdisplay thatthe Nolli mapapproach ispowerful in mapping modern day city public areas and affords a powerful device for city designers and designers to depict andexaminecitypublicareas.
4.3 “Geographic Information System in managing flood protection” (Chugiat Wichiencharoen 2020)
A geographic Information System (GIS) is a very powerful tool in data preparation, management, manipulation, analysis, and presentation. GIS is used in almost all applications. Quantum Geographic Information System or QGIS is free and open source software. In this study, positions obtained from a mobile mapping system (MMS) were input to the QGIS program to demonstrate how to manage flood protection. King Kaew Road, south of Kings Dyke in eastern Bangkok, was used as an example to display the results of the mobile mapping system (MMS) and Insufficient processing and analysis of the cause of satellite signals to calculate the exact (± 5 cm) position. Google map, Google satellite, and Open Street Map were plug instotheQGISprogram.
From the displayed map, points outside the King’s dyke were eliminated and the gaps (of inaccurate positions) could be seen. Missing locations can be interpolated or estimated to fill the small gaps caused by pedestrian elevated roads. . Repeated acquisition of MMS data with differentsatellitegeometriescancorrectmissinglocations in some areas. The final recommendation to complete all required locations along the embankment was to use differential andprofilelevelingsoilsurveys.UsingMMSto collectthedataandQGIStohelpanalyzetheresultwasthe mosteffectiveandrapidmethodtocreatethedatabasefor managingfloodprotection.
4.4 “Evaluation of Land Surveying and Mapping using Total Station, GPS and GIS, CONFCALL” (Amirthavarshini. K et al. 2019)
MostsurveyingworksformappingorGISapplicationsare performed with a total station. Because many of the sites surveyed are remote, surveys are often conducted in an exposed assumed local coordinate system. . However, without survey data projected in real coordinates, the scope of possible analysis is limited and the value of existing images, elevation models, and hydrological layers cannot be leveraged. This requires a conversion from the locallyassumedcoordinatesystemtotheactualcoordinate system. There are various built in and additional tools for converting tons via GIS programs. This white paper examines the impact of using georeference tools, spatial adjustmenttools(similartoaffine),andchamptoolsonthe accuracyandrelativeaccuracyoftotalstationsurveys.
This transformation requires the actual coordinates of at leasttwocontrolpointsthatcanbecollectedfromdifferent sources. The study also explores the implications of using geodetic GPS, handheld GPS, Google Earth (GE), and Bing Base maps as sources of control points for total station survey accuracy and relative accuracy. These effects were
International Research Journal of Engineering and Technology (IRJET) e ISSN: 2395 0056
Volume: 09 Issue: 06 | June 2022 www.irjet.net p ISSN: 2395 0072
tested using 128 points in an area of 60,000 m2, and the results showed that the Champ tool was optimal for maintaining the relative accuracy of the converted points. The Geo referencing and spatial adjustment (similarity) tools give the same results and their accuracy is between 1/1000 and 1/300 depending on the source of control points. Leveling using a total station An indirect leveling method is being studied, and the application of indirect levelingtopublicworkssuchasroads,airports,andurban construction is gradually expanding. The results are expectedtobeusedinmanypublicworksprojectssuchas regular surveys, broader settlement development, and settlementmeasurementtools.
District governments can use flood mitigation models to reducetheriskoffloodinginagriculture.
4.7 “Application of GIS and GPS for facilitating the management in construction industry” (Muhammad Saiful Islam, 2013)
4.5
“Filling open street map data gaps in rural Nepal: A digital youth internship and leadership
programme”(KshitizKhanalet al. -2019)
Crowdsourced, open geospatial data such as the data compiled through Open Street Map have proven useful in addressing humanitarian, disaster, and development needs. However, the existing ways in which volunteers engage in Open Street Map have inherent limitations that lead to critical data gaps in economically underdeveloped countries and regions. Various initiatives that target specific geospatial data gaps and engage volunteers for longer periods have emerged to overcome these limitations, yet there has been a limited in depth study of such targeted mapping initiatives. This article reports on the findings of Digital Internship and Leadership (DIAL). This is a program aimed at bridging the data gap in rural Nepal by involving young people in rural Nepal mapping through target mapping, virtual internship strategies, and youth leadership development. The findings suggest the potential benefits of targeted mapping initiatives embedded in youth leadership internship programs to addressthosecriticaldatagaps.
4.6 “Analysis of flood identification and mitigation for disaster preparedness: A system thinking approach”(AnisaDzulkarnainet al. -2019)
Floods are a major threat to agricultural production. Reducing the impact on agricultural production is a challenging task in mitigating floods. Understanding the causes of floods allows you to use that information to createcomprehensivefloodmitigationmodels.Youcanuse asystemdynamicsapproachtoinvestigatethefactorsthat influencefloodtreatmentandavoidanceinagriculture.The purpose of this study is to explain flood protection in agricultureusingasystemdynamicapproach..Wewilluse the information we collect from interviews with key government officials. . We also use the information from existing research reports or other publications related to floodsanddisastermanagement.Bothinformationsources areusedasabasefordevelopingafloodmitigationmodel.
Construction work involves many uncertainties from its starting to its ending. There is a lot of investment in this industry all over the world. The general economy of a country has a strong correlation with the rate of construction. However, the success of this sector fully depends on the proper management throughout the project life cycle. GIS facilitates management system decisions by providing the spatial and attributes characteristics of a project together.The purpose of this study was to investigate the scope of GIS application in construction project management and identify potential areas of GIS application in this area.In this regard, a good number of published articles are reviewed and found that construction progress monitoring; material procurement, construction vehicle, equipment, labor tracking, underground construction risk assessment, etc. are efficiently managed by GIS. Finally, this study explores several potential areas of research that can facilitate construction management such as construction, equipment, labor productivity analysis, risk quantification, andmanagementusingGIS/GPSdiscovered.
4.8 “Remote
sensing and GIS applications in flood management”(S.P.Aggarwaletal.
2009)
India is one of the most natural disaster prone regions of the world and which causes losses of property, infrastructure, and human life every year. Space and Air based observations of the earth provide a unique vantage point for monitoring and assessing floods and other disasters.Flood surveys have been significantly improved by geospatial technology, primarily in three flood phases. i.e,a)beforefloods(preparednessphase),b)duringfloods (monitoringphase)andc)afterfloods(damageassessment and mitigation phase). The preparatory GIS database containsagricultural,socio economic,telecommunications, population,andinfrastructuredata.
It can be used in combination with flood data to adopt evacuation strategies, remediation plans, and damage assessments in the event of a critical flood situation. . In this phase, you can perform integrated hydrological modeling to reconstruct flood events and generate flood scenarios due to extreme precipitation, storm surges, cyclones, dam failures, or glacial lake outburst floods (GLOF). This paper shows how to combine geospatial technologywithintegratedhydrologicalmodelingtocreate flood risk maps, and flood forecasts and identifies flood evacuation routes. The gap areas in the case of remote sensing, high resolution elevation data, and urban floods
International Research Journal of Engineering and Technology (IRJET) e ISSN: 2395 0056
Volume: 09 Issue: 06 | June 2022 www.irjet.net p ISSN: 2395 0072
arealsodiscussedandfuturestrategiestoreducethesegap areas are also given. Finally integrated approaches for FloodManagementInformationSystem.
5. SOFTWARES USED
5.1 Open Street Map (OSM)
Open Street Map is a tool for creating and sharing map information and data. Anyone can contribute to OSM, and thousands of people contribute to the project every day. Usersdrawmapsoncomputers,ratherthanonpaper,but aswewill seeinthisguide,drawinga maponacomputer is not all that different from drawing on paper. We still drawlinestorepresentroads,fields,etc.,andusesymbols to represent schoolsand hospitals.Most importantly, OSM maps are stored on the internet and anyone can access themcompletelyfreeofchargeatanytime.
Created by Steve Coast in the UK in 2004, inspired by the success of Wikipedia and the superiority of its own map dataintheUKandelsewhere. Userscancollectdatausing manualsurveys,GPSdevices,aerialphotographs,andother free sources, or use their own local knowledge of the region.Thiscrowdsourceddatawillbeavailableunderthe OpenDatabaseLicense.ThissiteissupportedbytheOpen Street Map Foundation, a non profit organization registeredinEnglandandWales.
OSM data can be used in a variety of ways, including creating paper and electronic maps, geocoding addresses and place names, and planning routes. Prominent users include Facebook, Apple, Microsoft, Logistics, Uber, Craigslist, Snapchat, OsmAnd, Maps.me, MapQuest Open, JMP statistical software, Amazon Wikimedia Maps, and Foursquare. Many GPS device users use OSM data to replacethemapdataembeddedinthedevice..OpenStreet Map data has been favorably compared with proprietary data sources, although as of 2009 data quality varied acrosstheworld.
5.2 uMap
uMapletsyoucreateamapwithOpenStreetMaplayersand embeditinyoursite.Withinafewminutes,youcancreate custom maps. It is powered by open source, WTFPL licensedsoftware. uMapismadeoutofDjangoandLeaflet and of course open source. It provides different free baselayerscreatedwithOpenStreetMap Data.
Themapliststhemainadvantagesofthesystemsontheir frontpage:
•Importowndatalayer
•Addmarkers,lines,polygons…
•Managefeaturecolorsandicons
• Manage map options: display a minimap, locate the user onload…
•Batchimportgeostructuresdata(GEOJson)
•Definethelicenseofyourdata
•Embedandshareyourmap
CreatingamapwithuMap
1.Visithttps://umap.openstreetmap.fr/en/
2.Clickon“createmap”
3.Ifyouwanttoaddexternaldatagotothelayermenuon theleftsideandaddremotedata
4. If you want to add external data from a file, click the arrowbuttonintherightmenu
5.Ifyouwanttogeneratespatialfeaturesbydrawingthem, taketheline,polygon,orpoint thetoolisalsoontherightmenu
6.Changethebaselayeranddefineyourdatapermissions
7.Saveandthenyourfirstmapisreadytoembed
6. METHODOLOGY
Theaimofthisprojectistomapalltheinfrastructuresand publicamenitieswhichcanbeutilizedincaseofafloodor anyotherdisasterwhicharisestheneedforrehabilitation, hospitalization, food storage, and food distribution. The areaswhichwould be mappedunderthisprojectarePala Municipality, Thalappalam Panchayath, and Bharananganam Panchayath are prone to flood disasters. The Tools used for the same are Open Street Map (OSM) and uMap, since the same can be used offline (OSM) to navigate to the affected places of rehabilitation centres in case of network issues during the flood. Some of the amenities marked are Public Warehouses, Apartments, andRationshops,Schools,HospitalsandAuditorium.After discussing with the local self government department the areasofconsideration,thefirststepwetookinthisproject was to collect the office data and collect all possible materials from the respective offices, which would aid us inthisproject.Next,wewenttocollectdatafromthefield inordertomapthesameintoOSM.Therewasalsoaneed to map ward boundaries of Pala Municipality for ease of recognitionofthesame.
Visitingthewardcouncillorofeachwardofourconcerned area enabled us to collect accurate data on all the infrastructures and public amenities. Since the data we collect for mapping is obtained directly from the local community,incaseofanemergencysituationlikeaflood,
International Research Journal of Engineering and Technology (IRJET) e ISSN: 2395 0056
Volume: 09 Issue: 06 | June 2022 www.irjet.net p ISSN: 2395 0072

thedataprovidedinOSMismuchmorereliableandupto date than Google Maps. The accurate data collected is updated and uploaded to the OSM platform as the final step. After this project is finished, any citizen or authorities would be able to view the mapped amenities. Thecitizencandownloadandusethismapinofflinemode tonavigatetosaferareasandtheauthoritiescouldusethe same for rescue and rehabilitation processes. The citizen andauthoritieswouldbeabletoaccessthemostaccurate data withoutdependingon anyotheroutsidefactorssuch as network connection. This would aid in a much faster rescueandrehabilitationprocess.

Maps. In rural areas like the panchayats, most of the data we collected is accurate since we went to the site for collecting the same. But when we search for the same amenities on Google Maps, most amenities were not mapped and the search result was invalid. Therefore, this datacollectionisofhighimportance.
8.1 Pala Municipality Data Collection
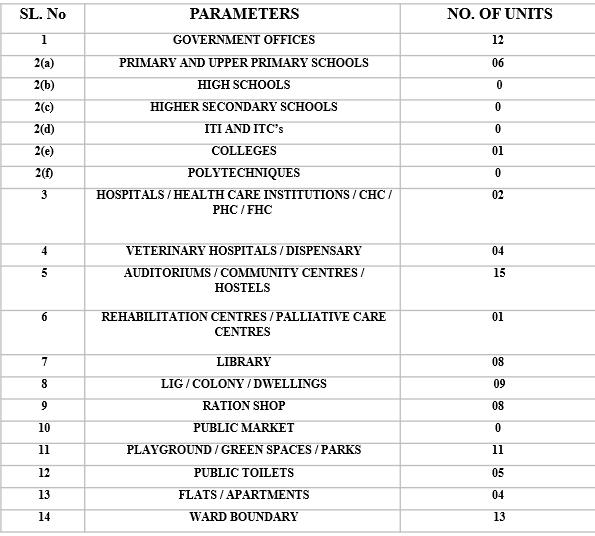
With a total area of 16 sq.Km, Pala municipality has an annual rainwater precipitation of 2977mm. It's also residing in the bank of Meenachil river. Which means the chances of getting flooded are high, especially in rainy season. The total number of wards are 26 and we have identified and added a total of 199 amenities in pala municipality itself. These details can be used in the post flood rescue and rehabilitation process. These amenities include ware houses, health centres, auditoriums etc. The 26 ward boundaries were also marked digitally using uMap
Fig 1:TheprocessofaddingamenitiesinOSMmap.
7. DATA COLLECTION
In order to collect the data with the most accuracy, we wenttotherespectivemembersofeachward.Therewasa total of 52 wards and we collected the details of the amenities which were of utmost importance to post flood mitigation and rescue processes. The wards we visited were Pala municipality having 26 wards, Bharananganam panchayat, and Thalappalam panchayath having 13 wards each. Some of the amenities were already mapped while mostofthemweremarkedbyus.Thenumberofamenities mapped on each local body is given below in detail. Mapping the amenities with the help of respective ward councilors enabled us to map them with 95 to 100% accuracy. A total number of 362 amenities were identified and mapped in this process. At the same time, details of wardboundarieswerealsocollectedandwardboundaries weremarkedusinguMapandupdatedonline.
When it comes to urban areas the amenities, we have collectedaremostlysimilartothedataavailableonGoogle
Fig 2:Totalno.ofamenitiescollectedfromPala municipality
International Research Journal of Engineering and Technology (IRJET) e ISSN: 2395 0056
Volume: 09 Issue: 06 | June 2022 www.irjet.net p ISSN: 2395 0072

Fig 3:PalaMunicipalitywardBoundaries
8.2 Thalapalam Panchayath Data Collection


With a total area of 22.73 sq.Km Thalapalam panchayath have an annual precipitation of 2977mm. It’s evident that the area of this panchayat is less compared to the area of pala municipality. But the total number of wards are 13 only. We have identified and mapped a total of 77 amenities from this panchayath in OSM map. We also marked the boundaries of the 13 ward using uMap. This panchayathissituatedina ratherruralarea,whichmeans everyamenitywehaveherecounts.
Fig -5:ThalappalamPanchayathWardBoundaries
8.3 Bharananganam panchayath data collection
With a total area of 27.04. sq.Km, Bharananganam panchayath also have an annual precipitation of 2977mm. The number of wards in this panchayath is also 13. We haveidentifiedatotalof86amenitiesfromthispanchayath andmappedthesameintoOSMmap.Wealsomappedthe 13 ward boundaries using uMap. Bharananganam panchayath is also in a rural area. Therefore, we have collected the most accurate details from the ward councillorsand mapped itaccordingly. In such rural areas the details we can access through Google map is also not fullyaccurate.
Fig 4 Totalno.ofamenitiescollectedfromThalappalam Panchayath
Fig 6 Totalno.ofamenitiescollectedfromBharanaganam Panchayath
International Research Journal of Engineering and Technology (IRJET) e ISSN: 2395 0056
Volume: 09 Issue: 06 | June 2022 www.irjet.net p ISSN: 2395 0072
be used as rehabilitation centers, places of importance suchasprimaryhealthcenters,greenspaces/groundsetc. Also, if the rescue team don't speak the mother tongue of theplacewheretherescueoperationisdoneitcouldslow downtheirprocess.Therefore,havingamapwithallofthe necessary amenities mapped would speed up the process of rescue and rehabilitation. It would be a total game changer and rescue teams would be able to operate on a much faster level at the same time without any technical orlinguisticbarriers.
Fig -7:BharanaganamPanchayathWardBoundaries
9. DATA INTERPRITATION, RESULT AND ANALYSIS

The area of focus for this project was Pala municipality, Thalappalam panchayath and Bharananganam panchayath. Each local body having 26, 13 and 13 wards each respectively. The aim of the project was to identify and map all the necessary amenities which could aid in floodrescueandrehabilitationprocesses.Throughoutthis project, a total number of 362 amenities from 52 wards altogether were identified and mapped the on the OSM map.Wealsomarkedthewardboundaryforall52wards in uMap. Even though our aim was to map the maximum possible amenities and infrastructures of each ward, we came across some other benefits of this project too. They don’tdirectlyimpartanyhelptorescueandrehabilitation process but on the other hand they point out why Google map cannot be used in the face of a natural disaster. In order to collect the data with most accuracy, we went to respectivemembersofeachward.wecollectedthedetails oftheamenitieswhichwereofutmostimportancetopost flood mitigation and rescue processes. Some of the amenities were already mapped while most of them were marked by us on OSM. The number of amenities mapped ineachlocalbodyseparatelyisgiveninthefigures2,4,6.
Out of the many problems faced by the rescue and rehabilitation system one of the main problems is 'not having enough data on necessary amenities in the rural areas which are prone to flood'. The urban areas also experience flood but it’s the rural area which have to go through much worse scenario since not many people knowsuchplacesenoughtonavigatetherescueteamand help in rehabilitation process. Since no one have enough data about the necessary amenities it could leave a great impact on the post floor disaster management system becausewithoutthehelpofalocalguideitwouldbecome nearlyimpossibletotrackandlocatetheplaceswhichcan
But why don’t we use the already available google maps? Even though we can use google maps for navigation purposesit’snotsoaccuratewhenitcomestorescueand rehabilitation. Google map may have every important placemappedinit,butwhenitcomestorural areasmost of the details mapped in google map are either wrong or theredoesn’texistsuchaplace.Ifweweretoupdatesuch detailsingooglemapitself,itwouldtakemanydaystoget those details approved and the one who update the map won’t have any copyright authority over that work. It’s alsoahassletoupdatethedetailsinGmap,theywouldgo throughnumerousverificationprocess.Butwhenitcomes toOSM,onecanmapwithease.
OneofthemajorbenefitsofOSMisthatonecandownload the maps offline and would be able to use it anytime and any situation. That means even if the communication systemhascrashedduetoflood,oriftherescueteamcan’t accessinternet,theycanusethismaptolocateandrescue the people in danger at the same time they would also be able to locate where the places of importance are. Places like primary health centers, warehouse, auditoriums, green spaces etc., can play great roles in helping the peopleindanger.Unfortunately,inmostofthecasessuch places of rural areas are missing in Gmap. It may also be missinginOSMbutwehaveaddedeveryamenitywiththe help of respective ward councilors of the 52 wards. Mapping the amenities with the help of respective ward councilors enabled us to map them with 95 to 100% accuracy.
Thewardcouncilorsarethepeoplewhoknowstheirward best, they would know each and every amenity and they can even get details of important amenities or infrastructure which are under construction stage. When in most cases Google map is enough for urban areas, in rural areas most of the amenities were not even mapped in Gmap. The ease of updating the right information of infrastructuresoranamenityisofhighimportance,when the data collected is not readily available prior on the internet. In the 362 amenities we have mapped, most of the details were already mapped in google map. Sometimes such details are right in Gmap, sometimes wrongly mapped, sometimes they don’t even exist in Gmap. Also, one won’t know for sure if Gmap is wrong untilweverifyitwithalocalinformantoraguide.Butthe data weupdatedon OSMis 95%accuratesince itdirectly
International Research Journal of Engineering and Technology (IRJET) e ISSN: 2395 0056
Volume: 09 Issue: 06 | June 2022 www.irjet.net p ISSN: 2395 0072
comes from the ward councilor of that place. At the same time every data we acquire is from another person, also mistakes are inevitable therefore there will always be enoughroomforimprovement.
Fig 8 No.ofeditsmadetillnowin3localbodiescombined


Fig 11 No.ofeditmadeinonesuchrectangleinPala Municipality
10. CASE STUDY: PHC SUB CENTER EDAPPADY

Fig 9 No.ofeditmadeinonesucheditinThalapalam panchayath

WhileupdatingtheOSMMapofEdappady ward,wecross checked the details of amenities on Google map. While doingsowerealizedsuchahealthcenterwasnotmapped on google map. While this isn’t the first where google didn’t showed the right result. When we compared the results from Google map and OSM, it was evident that many amenities of great importance in post flood rescue and rehabilitation process were not mapped in google till date. There were many cases apart from this PHC sub center of Edappady. Such mismatch in search results and placesnotfoundwereevidentincaseofruralareas.Since we had the help of the ward councillor we were able to mapsuchamenitieswithoutanyerrors.Thedatacollected from the ward members are the only document available to us which we can cross check against Google map results. This example shows the PHC Sub center of Edappady ward which we mapped with the help of ward councillor of that area. But there is no mention of such a Public Health Care facility in Edappady ward when searched on Google map. It only showed nearby PHC centers but not this one. The screenshot of the Google result and OSM result are attached here. Where SJCET Palai is taken as a point of observation. From the images it’s evident that the data we collected can be used well in such rescue and rehabilitation process and its accuracy is muchbetterthanthatofGooglemap.

Fig-10 Detailsoftotaleditsmadeinonesuchedit(one rectangle)
Fig-12 GoogleresultofPHCsubcentreEdappady (ShowingincorrectresultsandnotthePHCofEdappady).
International Research Journal of Engineering and Technology (IRJET) e ISSN: 2395 0056
Volume: 09 Issue: 06 | June 2022 www.irjet.net p ISSN: 2395 0072
up the process. It would be a total game changer and rescue teams would be able to operate on a much faster level at the same time without any technical or linguistic barriers.

We also found that there are mistakes in Google map regardingamenitiesofimportanceinpostfloodmitigation process and some amenities were not mapped. Whereas wewereabletomapthesameaccuratelywiththehelpof wardcouncillorsofthoseareas.We mappedalmostevery amenity that could assist in post flood mitigation and rehabilitation process in Pala municipality Thalappalam panchayath and Bharananganam panchayath. These details can be downloaded by anyone and can be used to assist in flood rescue and rehabilitation process. Even if thereoccursanyinterruptionincommunicationsignalsor network connectivity it won’t affect the rescue and rehabilitation process. Necessary food and medical supplies can also be made available for the people since warehouse and health centres are mapped. Therefore, anyone who can read the map can help in the efficient working of rehabilitation centres. This project would be able to help in the efficient working of post flood disaster mitigationprocess.
REFERENCES
11. CONCLUSIONS
In 2018 and 2019 floods in Kerala, Pala municipality and nearby panchayaths faced many difficulties. The communication networks were damaged and rescue and rehabilitation process were a mess. The process could have been faster and more people could have been saved earlier if there were enough data on the important amenities, the location of colonies and residential areas, most importantly if they had a clear map of those area under flood. The communication and network failure, inability to use Google map and unavailability of an accurate offline map altogether caused difficulty in the rescueandrehabilitationprocess.Wecollectedthedetails of these 52 wards in Pala municipality (26), Thalappalam panchayath (13) and Bharananganam panchayath (13) withthehelpofwardcouncillorsoftherespectiveareas.A total of 362 amenities were identified and mapped onto OSM. Also, the boundaries of the 52 wards were also marked using uMap. Since no one had enough data about the necessary amenities this project might leave a great impact on the post flood disaster management system. Tracking and locating the places which can be used as rehabilitation centres, places of importance such as primary health centres, green spaces/ grounds would be possible without the help of a local guide. Having a map with all of the necessary amenities mapped would speed
1) Cinzia Albertini, Domenico Miglino, vito lacobellis, Francesco De Paola, Salvatore Manfreda (2021) “Delineation of Flood prone areas in cliffed coastral regionsthroughaprocedurebasedonthegeomorphic flood index”. Journal of Flood Risk Management, e12766.
2) HuiminJi,WowoDing (2021) “Mappingurbanpublic spaces based on the Nolli map method”. Volume 10, Issue3,September2021,Pages540 554.
3) Chugiat Wichiencharoen (2020) “Geographic Information System in Managing Flood Protection”. Vol.34No.3(2020):SeptemberDecember.
4) Amirthavarshini. K, Vasanthakumar. V, Dr. Kannan. M (2019) “Evaluation of Land Surveying and Mapping using Total Station, GPS and GIS”. CONFCALL 2019 (Volume7 Issue11).

5) Kshitiz Khanal, Nama Raj Budhathoki & Nancy Erbstein (2019) “Filling Open StreetMap data gaps in rural Nepal: A digital youth internship and leadershipProgramme“.Articlenumber:12(2019).
6) AnisaDzulkarnain,ErmaSuryani,MalaRosaAprillya (2019) “Analysis of Flood Identification and Mitigation for Disaster Preparedness: A System Thinking Approach”. Volume 161,2019, Pages 927 934.
International Research Journal of Engineering and Technology (IRJET) e ISSN: 2395 0056
7) Muhammad Saiful Islam (2013) “Application of GIS and GPS for Facilitating the Management in ConstructionIndustry”. Departmentofcity& regional planningvolume114term122section 01,2013.
8) Shiv P. Aggarwal, Praveen K. Thakur, Vinay Kumar Dadhwal (2009) “Remote sensing and GIS Applications in Flood Management”. publication/230660751.
Volume: 09 Issue: 06 | June 2022 www.irjet.net p ISSN: 2395 0072 © 2022, IRJET | Impact Factor value: 7.529 | ISO 9001:2008 Certified Journal |