International Research Journal of Engineering and Technology (IRJET) e ISSN:2395 0056

International Research Journal of Engineering and Technology (IRJET) e ISSN:2395 0056
Mr.P.Ramu1, Ms.A.Vani Priya2, Ms.D.Roopa Sree 3, Ms.S.Sankeerthana4
1Assistant Professor, Dept of Computer Science and Engineering from Sreenidhi Engineering College, JNTUH., (T.S.), INDIA.
234 UG Scholar, Dept of Computer Science and Engineering from Sreenidhi Engineering College, JNTUH.,(T.S.), INDIA. ***
Abstract - Analysts have found it challenging to estimate a company's stock price because of its volatility and shifting nature. Because stock values are time dependent, this research aims to forecast stock values using the technique called Time series, which requires trackingmanychangesinasinglevariableovertimeandis particularly suited for financial forecasting. UsingTime Series on a dataset will allow you to examine how a defined economic, currency, or meteorological variable changes over time, as well as how it changes in comparison to other similar variables over the same period. In this project, we will use time series models to forecast stock values usingARIMAand other forecasting approaches. Time Series is a basic statistical tool for analyzing continually changing variables such as stock prices, weather, currencies, and so on. A popular forecasting model called theARIMA model that works with historical data to provide near term projections and may be used as a foundation for more complex and complicated models. We'll gather stock market data and analyze it withARIMA time series modeling and other forecasting techniques like Naive Estimate and ExponentialSmoothing,toforecastfuturestockprices.
Key Words: Stock price, time changing, Data,ARIMA, Exponential smoothing, Naive, Seasonal Naive, statistics, Analysis
This work is about the prediction of the stock price using time series. Every investor, whether an individual or a company, wants a good or reasonable return on their investment. Stocks are one of the best ways to get a good return on investment. This requires investors to fully understand many stocks and their current prices. To maximize profits and avoid losses, you need to make accurate price forecasts when buying and selling stocks. BoththeEfficientMarketHypothesisandtheElliott Wave Theory test several predictive principles. The behavior of institutional investors, often known as large buyers and sellers, is generally a major contributor to equity value. If one day there are more buyers than sellers, the auction willbehigherforthatprice.Finally,thepriceisdisplayed at the control point. This is the average price or the most
constantprice.Pricingisusuallydistributedinmostcases. Therefore, you need to select entry and exit points based on the auction price to maximize profits and accurately predict stop loss points for complete risk analysis. Extensivestatisticaltechniquessuchasautoregressiveand movingaveragesareoftenusedtoachievethesamegoal.
With the latest computing technologies such as machine learning, ARIMA (autoregressive integrated moving average), exponential smoothing, autoregressive integrated moving, ARIMA (autoregressive integrated moving average), naive prediction, seasonal naive prediction, and neural networks several techniques such as are possible. The currently proposed model uses all new techniques to predict current stock prices and maximize profits. Each model is ranked to help users decide whether to buy or sell a particular stock, whether thetransactionisshort termorlong term. Unlikethe old approach, this model uses all the latest methods and is morelikelytomakeaccuratepredictions.
Volume: 09 Issue: 06 | June 2022 www.irjet.net p ISSN:2395 0072 © 2022, IRJET | Impact Factor value: 7.529 | ISO 9001:2008 Certified Journal | Page1194
From the literature survey, it had been observed that the appliance of machine learning techniques to securities market prediction is being undertaken thoroughly throughout the globe. Machine Learning techniques are proving to be rather more accurate and faster as compared to contemporary prediction techniques. Significant work has been done throughout the planet in thisfield.
Authors Naresh Kumar, and Seba Susan the objective of this think is to supply an assessment of forecast models basedonCOVID 19cases,aswellastoestimatethevirus's effect in influenced nations and around the world [5]. On COVID 19 occurrences, demonstrate execution was assessed utilizing measurements such as cruel supreme mistake (MAE), root cruel square blunder (RMSE), root relative squared mistake (RRSE), and cruel supreme rate mistake (MAPE). For COVID 19 affirmed, dynamic, recuperated, and passing cases, we produce estimating discoveries. ARIMA outflanked the Prophet's show, concurringwiththefindings.COVID 19occasionday level informationhasbeenassembledfromaGitHubstore.The ESRI living chart book group, the Connected Material
International Research Journal of Engineering and Technology (IRJET) e ISSN:2395 0056
Volume: 09 Issue: 06 | June 2022 www.irjet.net p ISSN:2395 0072
scienceLab(APL),andtheCenterforFrameworksScience and Building (CSSE) at Johns Hopkins College, both of whicharebasedwithinthe JoinedtogetherStates, bolster and keep up the asset [5]. Starting January 22, 2020, the store will contain worldwide COVID 19 detailed occurrencesonaneverydaypremise.
Stockpricepredictionisabigproblembecauseitinvolves many factors that have yet to be addressed and it doesn’t seem statisticalinitially. But by using accurate machine learning techniques, one can relate previous data tothis data and train the machineto find outfrom it and make appropriateassumptions.
In the existing system stock showcase is one of a country's most imperative financial divisions. It gives financialspecialiststhechancetocontributeandbenefit from their cash. Analysts from an assortment of spaces, countingmeasurements,fakeinsights,financial matters, and funds, are all fascinated by anticipating the stock advertisement. Stock showcase determining precision bringsdownshowcaserisk[12].
When it comes to the stock market's consistency, there are numerous diverseperspectives. Concurring to the effective showcase theory (EMH), all open data is immediately completely coordinated into the current showcase cost, causing stock cost volatility. Many machine learning strategies have been utilized within the writing to assess stock cost heading. A few of these works are altogether inspected. Ampomah et al. (2020) exploredtheexecutionoftree basedAdaBoostgathering ML models in determining stock costs (specifically, AdaBoost DecisionTree (Ada DT), AdaBoost RandomForest (Ada RF), AdaBoost Bagging (Ada BAG), and Bagging (Ada BAG), and Bagging ExtraTrees (Bag ET) [12]. The AdaBoost ExtraTree (Ada ET) model outperformed the other tree based AdaBoost ensemble models,accordingtothefindings.
Machine learning strategies such as direct discriminant examination, arbitrary woodland, manufactured neural arrange, SVM, and logit were utilized by the analysts Ernest Kwame Ampomah, Gabriel Nyame, and Zhiquang qin. The exploratory discoveries appeared that SVM beat all of the other classificationtechniques.
Historicalrawdata collection Datacleaning
Importing libraries
Featureextraction &scaling
Model Prediction and evaluation
Flow chart 1:Existingmethod
Train data
Test data
Intheproposedsysteminthistime seriesstudy,theentire cost of a face drilling rig utilized in the Swedish mining sector is estimated using an Autoregressive Integrated MovingAverage(ARIMA)model[15].
Timeseries forecasting forecastsfuturedata pointsbased on data gathered over a specific period. Forecasted data points will serve as a foundation for production management and planning, as well as to optimize industrial processes and economic planning. The primary aimistoobtainthebestpredictionpossible,whichentails reducing the mean square difference between actual and anticipatedvaluesforeachlead time.
Time series forecasting approaches such as Box Jenkins and the Autoregressive Integrated Moving Average (ARIMA) are based on the assumption that time series data is generated by linear processes. Some of the techniques were used. The authors Al Douri, and Jan Lundberg used Multiple regression and neural network techniquestomodelandanticipatethefuture.
The data in a stable stochastic model have the same varianceandautocorrelation.Thedifficultyindetermining the parameters is the model's flaw. To address this issue
International Research Journal of Engineering and Technology (IRJET) e ISSN:2395 0056
Volume: 09 Issue: 06 | June 2022 www.irjet.net p ISSN:2395 0072
and provide accurate forecasting, automated model selection processes are required. Zhang proposes combining ARIMA and Artificial Neural Network (ANN) models in a hybrid technique. The combination increases predicting precision. The results from three real world data sets show that the hybrid model outperforms each component model. The ARIMA and ANN models share somecommonalities.Bothhaveadiverserangeofmodels withvaryingmodelordering.Tocreateaneffectivemodel, bothrequireabigsamplesize.
ARIMA,ontheotherhand,candeliverresultsbasedonthe problem and data. The main portion of the ARIMA model is a complex polynomial that combines AR and MA polynomials.AlloftheTCdatapointsaresubjectedtothe ARIMA (p, d, q) model.[15]The mean of the time series data; p: the number of autoregressive delays; q: the number of moving average delays AR (autoregressive coefficients):
MAstandsformovingaveragecoefficients.
d: the number of differences produced by the white noise inthetime seriesdata.
For TC (Z TC), the ARIMA model is stochastically implemented using default values for p, d, and q. (0,0,0), (0,0,1), (0,1,1), (1,0,0), (1,0,1), (1,1,1), (2,1,1) (2,0,3). For each scenario, all of the TC data from the previous 37 monthsisincluded[15].
ARIMAmaybea blendoftwocalculations:autorelapse and moving averages, as the title suggests. Autoregression could be a time arrangement demonstrate that employments past time step data as input to a relapse condition to anticipate values in the following time step[3]. It could be a clear strategy that can make solid forecasts for a wide extent of time arrangement issues. A moving normal could be time arrangementinformationnormal thatadvancesthrough allthearrangementsbysubtractingthebestthingsfrom the already found the middle value of gather and embeddingstheanotherineachaverage.
The Arima model, in some cases known as the Box Jenkins model, was presented by George Box and Gwilym Jenkins[22]. The ARIMA model, which contains the condition underneath, combines the autoregression andmovingaveragemodels(3).
Ontheonehand,wehaveindicatorswithlaggedy(t) values and lagged errors, while y′t could be a subordinatevariablethatcanbeshiftedafewtimes.The ARIMA(p,d,andq)demonstrateisthetitlegiventothis show. The Auto regression and Moving Average component orders are p and q, individually, and the degreeofdifferentiationisd.
2.2
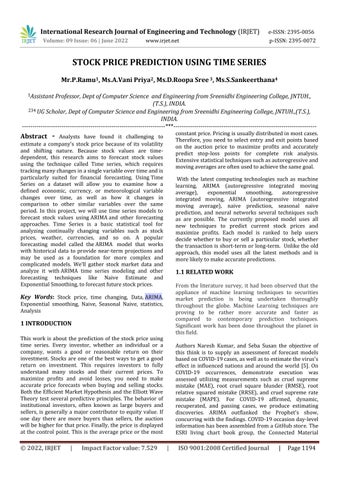
Exponential smoothing is a time series forecasting method for univariate data and can be extended to support data with systematic trends or seasonal components. This is a powerful predictive method that can be used as an alternative to Box Jenkins' popular ARIMAmethodfamily.
This determining method includes allotting weights to earlier information in such a way that they rot exponentially over time. The foremost later weights are on best, and as the time figure increments, theystart to debase[3].
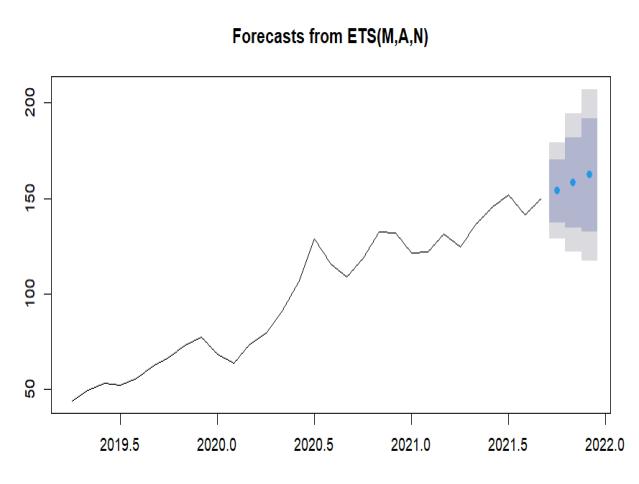
Arima is the autoregressive integrated moving average usedforcalculatingmovingaverages.
Graph 2:Resultsofexponentialsmoothing
International Research Journal of Engineering and Technology (IRJET) e ISSN:2395 0056
Volume: 09 Issue: 06 | June 2022 www.irjet.net p ISSN:2395 0072
Theestimateismadebyapplyingthetakingafterequation (1)topastinformationwithoutmakinganyexpectations.
y(T)=y′(T+h)|T (1)
The prior data prediction is (T + h), while the current dataforecastis(T).
stock cost can be built up due to the least RMSE esteem; these calculations ought to be utilized to estimate stock costs,andsuccessfulstockcostdeterminationcanresultin impressivebenefits.
The ARIMA demonstration and the EXPONENTIAL SMOOTHING show for stock cost expectations were given in this research. Each calculation distinguishes the stock information set of all five educates, concurring with the assessments of these two models. The ARIMA show test comes about and appeared that it can dependably anticipatestockcostswithinthebriefterm.
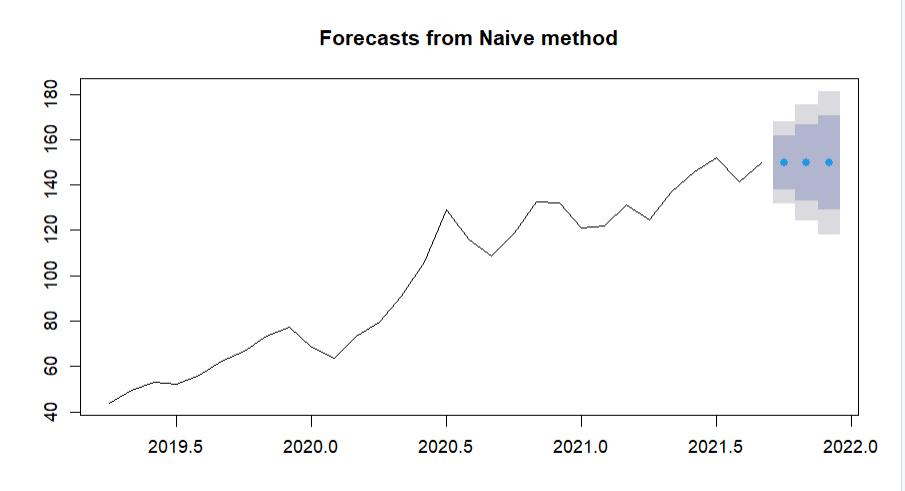
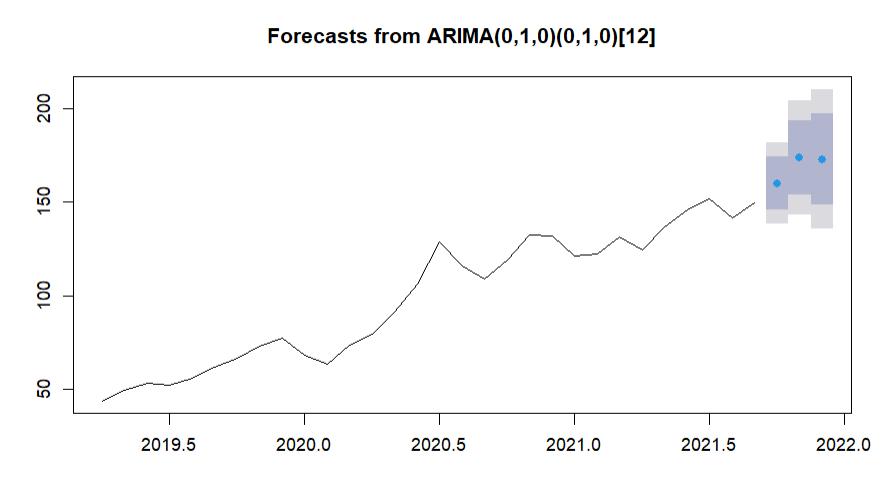
Graph 3:ResultsfromNaive
This estimating strategy is comparative to naive forecasting but the estimate is based on the previous information of the same season. The equation is as follows
y’(T+h)|T=y(T+h) m(k+1) (2)
NNAR (p, x) is a nonlinear and advanced forecasting scenarioinwhichpistheno.oflaggedinputsandxis the no.of hidden layers. It illustrates the architecture ofneuralnetworks.
The no. of stock cost expectation calculations will be extendedinfutureinvestigations.Thetakingafterisafew cases of how the comes about of this think could be utilized to figure stock costs: To determine whether there's any drift or regularity within the information, the figure of each bank's stock cost must be tried on greater preparingdatasets.
A set of conventional statistics and neural organized calculations based on slant or regularity must be built to decide the finest strategy for stock cost prediction. Any procedure'sexecutionmustbeassessedutilizingtheback testingapproach
For a trade user's comfort, the assessed blunder terms canbespokentoasRMSE.Thefinestcalculationsforeach
This may lead to advantageous speculation choices for stockadvertisingexaminers.TheARIMAdemonstratemay be prepared to compete with other short term forecast models based on the discoveries obtained. A wide extent of recurrence values can be utilized utilizing exponential smoothing. The Exponential smoothing approach was chosenforasingle timearrangementthatwastakenafter a design in terms of order choice. There are numerous well known time arrangement strategies within the ARIMA. The plan area of ARIMA was basic, conveying an aboutstraightline.
The data fed into the system is extracted every month fromYahoo!Finance,andthedataiscleansedbyremoving outliers. The time series object is then deconstructed becauseproperfindingsaredependentonseveralfactors. Following that, the time series objects are supplied to algorithms like ARIMA, Exponential Smoothing, Nave Forecasting, Seasonal Nave Forecasting, and Neural Networks,amongothers.
While the exactnesses of the other calculations like naïve, regular naïve, and neural systems are on a normal of 94.7%, ARIMA and Exponential smoothing have given 2.9%moreexactnessthantherestthat's,97.6%precision which straightforwardly shows that the mistakes in ARIMA and Exponential Smoothing are way less comparatively.
When the information had a solid regular slant, ARIMA and Exponential smoothing created a reliable demonstration. In this circumstance, ARIMA and Exponential smoothing beat other models, be that as it may,the execution and precision of these two modelsare subordinate to the information. We ought to nourish the information to all of the models, compare the outcomes, andselecttheforemostexactthatcomesaboutdepending ontherankings.
When the RMSE for each bank's models was compared, it was found that factual strategies beat the Repetitive Neural Arrange (RNN) strategy, since the RNN strategy is way better suited for foreseeing stock advertise returns
© 2022, IRJET | Impact Factor value: 7.529 | ISO 9001:2008 Certified Journal | Page1197
thanmeasurablemodels,whichmustbeadjustedinacase forstockcostprediction.
[1]T.Huamin,D.Qiuqun,andX.Shanzhu,"Reconstruction oftimeserieswithmissingvalueusing2Drepresentation based denoising autoencoder," in Journal of Systems EngineeringandElectronics, vol.31,no.6, pp. 1087 1096, Dec.2020,DOI:10.23919/JSEE.2020.000081.
[2] Ariyo, A. O. Adewumi, and C. K. Ayo, "Stock Price Prediction Using the ARIMA Model," 2014 UKSim AMSS 16thInternationalConferenceonComputerModellingand Simulation, 2014, pp. 106 112, DOI: 10.1109/UKSim.2014.67.
[3]GuptaandA.Kumar,"MidTermDailyLoadForecasting using ARIMA, Wavelet ARIMA, and Machine Learning," 2020 IEEE International Conference on Environment and Electrical Engineering and 2020 IEEE Industrial and Commercial Power Systems Europe (EEEIC/I&CPS Europe), 2020, pp. 1 5, DOI: 10.1109/EEEIC/ICPSEurope49358.2020.9160563.
[4] International Journal of Innovative Technology and ExploringEngineering(IJITEE)ISSN:2278 3075,Volume 9 Issue 5, March 2020. Retrieval Number: D1869029420/2020©BEIESPDOI: 10.35940/ijitee.D1869.039520
International Research Journal of Engineering and Technology (IRJET) e ISSN:2395 0056 Volume: 09 Issue: 06 | June 2022 www.irjet.net p ISSN:2395 0072 © 2022, IRJET | Impact Factor value: 7.529 | ISO 9001:2008 Certified Journal | Page1198