International Research Journal of Engineering and Technology (IRJET) e ISSN: 2395 0056

Volume: 09 Issue: 05 | May 2022 www.irjet.net p ISSN: 2395 0072
International Research Journal of Engineering and Technology (IRJET) e ISSN: 2395 0056
Volume: 09 Issue: 05 | May 2022 www.irjet.net p ISSN: 2395 0072
2
Sudeep K Mohaney1Department of Electrical Engineering, Jabalpur Engineering College, Madhya Pradesh, India
2Assistant Professor, Department of Electrical Engineering, Jabalpur Engineering College, Madhya Pradesh, India ***
Abstract - In this literature an artificial neural network is used in tuning the PID controller, which is being trained over a wide range of inputs and the outcome is a function fitting neural network block. Here a PID controller is used which is tuned by designing an ANN which is trained by LM(Levenberg marquardt) algorithm in attaining the desired inputs of PID which are KP (proportional gain), KI (integral gain) KD (derivative gain) ; so by substituting these inputs the response of output gets improved and the system becomes stable.
Key Words: power system stability, artificial neural network, proportional integral derivative controller, feedbackcontrol.
In the present era controllers plays a huge role in maintaining the power system output within the stable limits, the growing scale and complexity of linked electric power networks, along with the industry commitment to optimize security at the lowest possible cost, has resulted in the creation of specialized control devices. These control mechanisms guarantee that the electric power system can function in a wide range of situations without becoming unstable. By lowering the steady state error, controllers increase steady state accuracy. The stability improves as the steady state accuracy improves. Controllers also aid in the reduction of the system's undesired offsets. The maximum overrun of the system can be controlled using controllers which are tuned with thehelpofanANN.
PIDstandsforproportionalintegralderivative,anditis a type of device used in industrial applications to manage various process variables such as pressure, flow, temperature, and speed. All process variables in this controlleraregovernedbyacontrolloopfeedbackdevice.
This form of control is used to steer a system toward a goal point when it is otherwise level. It's utilized practicallyeverywherefortemperaturecontrol,aswellas in scientific procedures, automation, and a wide range of chemicalapplications.Closed loopfeedbackisusedinthis controller to keep the true output from a technique like near to the objective if feasible, else output at the fixed point. The PID controller design, as well as the control modes employed in them, such as P, I, and D, are addressedinthisarticle.
Aclosed loopsystem,suchasaPIDcontroller,includes a feedback control mechanism. To create an error signal E(s), this system uses a fixed point to assess the feedback variable.Basedonthis,itchangesthesystemoutput.This operation will be repeated until the error hits zero, at whichtimethefeedbackvariable'svaluewillbeequaltoa fixed point. As shown in fig.2 the error signal is the difference between the input and the output signal [ ( ) ( ) ( )]
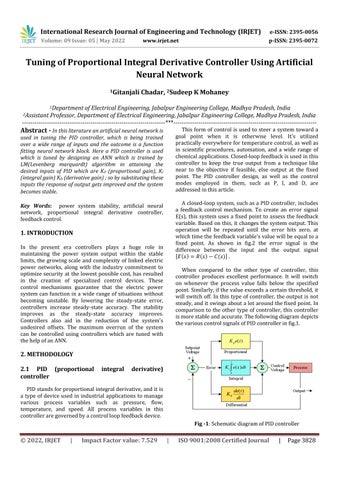
When compared to the other type of controller, this controller produces excellent performance. It will switch on whenever the process value falls below the specified point.Similarly,ifthevalueexceedsacertainthreshold,it will switch off. In this type of controller, the output is not steady,anditswingsaboutalotaroundthefixedpoint.In comparison to the other type of controller, this controller ismorestableandaccurate.Thefollowingdiagramdepicts thevariouscontrolsignalsofPIDcontrollerinfig.1.
Fig 1:SchematicdiagramofPIDcontroller
International Research Journal of Engineering and Technology (IRJET) e ISSN: 2395 0056
Volume: 09 Issue: 05 | May 2022 www.irjet.net p ISSN: 2395 0072
ThePIDcanbeexpressedmathematicallyas:
( ) ( ) ∫ ( ) ( ) ( )
Whereu(t)=Inputsignal. e(t)=Outputsignal. Onbothsides,applytheLaplacetransform ( ) ( ) ( ) ( ) ( ) ( ) ( )
Where, =proportionalgain =integralgain =derivativegain
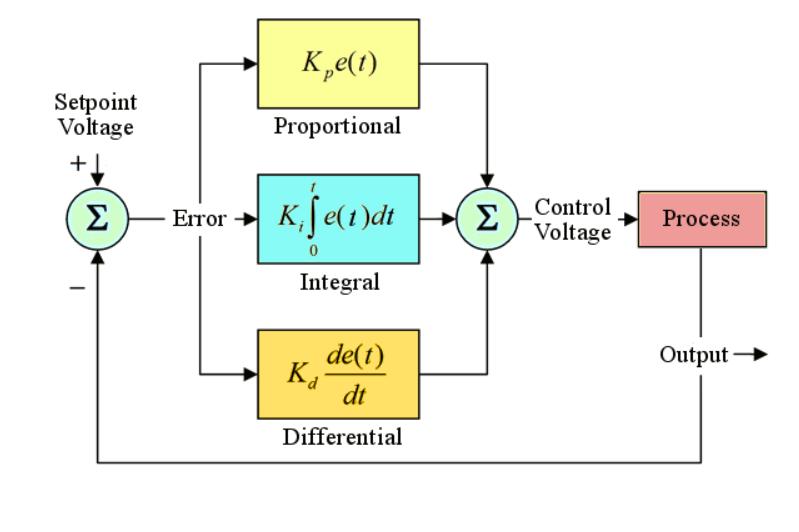
As a result, the proportional integral derivative controller's transfer function is . The following graphic depicts the block diagram of a unity negative feedback closed loop control system using a proportional integral derivative controller. The following diagram depicts the block diagram of PID controller in which R(s) isthe reference signal, E(s) isthe error signal, U(s) is the actuating signal, G(s) is the open loop gain of theplantandC(s)istheoutputsignal.
The human brain is made up of neuronal cells. There were 86 billion nerve cells in all. Axons also link tens of thousands of cells. However, sensory organs provide a varietyofinputs.
Electric impulses are produced as a result. This is how you get around the Artificial Neural Network. As a result, each neuron sends a message to another neuron to deal with the various challenges. ANNs are made up of numerousnodes,asthenamesuggests.Thatisdesignedto look like biological neurons in the human brain. We do, however, use connections to connect these neurons. They alsoengagewithoneanother.
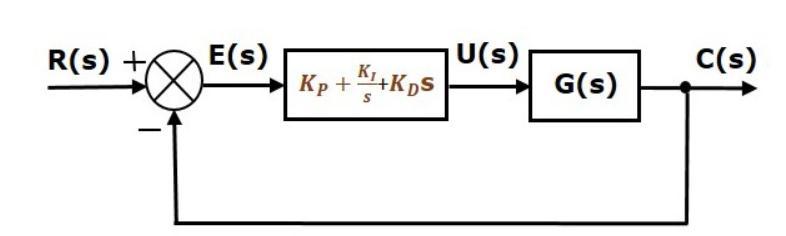
Nodes, on the other hand, are utilized to collect data. Performsimpleoperationsonthedataaswell.Asaresult, these tasks are delegated to other neurons. In addition, each node's output is referred to as its activation or node value. Each connection has a weight connected with it. Theyhavetheabilitytolearnaswell.Thisisaccomplished by adjusting weight values. As a result, the following diagramdepictsabasicANN:
Fig 2:BlockdiagramofPIDcontroller
A neural network (artificial neuron network) is a computer model that simulates the way nerve cells in the brainoperate.Artificialneuralnetworks(ANNs)makeuse of learning algorithms that can make modifications or learn ontheirownwhenfreshinformationisreceived.As a result, they're a great tool for non linear statistical data modeling. Learning at a deeper level Machine learning (ML) and the larger area of artificial intelligence (AI) technologiesrelyheavilyonANNs.
The concept behind ANNs is to simulate the functioning ofahumanbrainbycreatingtheappropriateconnections. It was forbidden to utilize silicon and wires as living neuronsanddendrites.
HeretheANNistrainedfor10hiddenlayersinwhichthe validationstopsat15epoch.
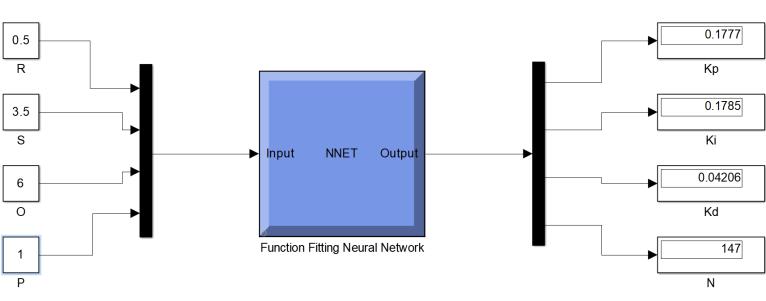
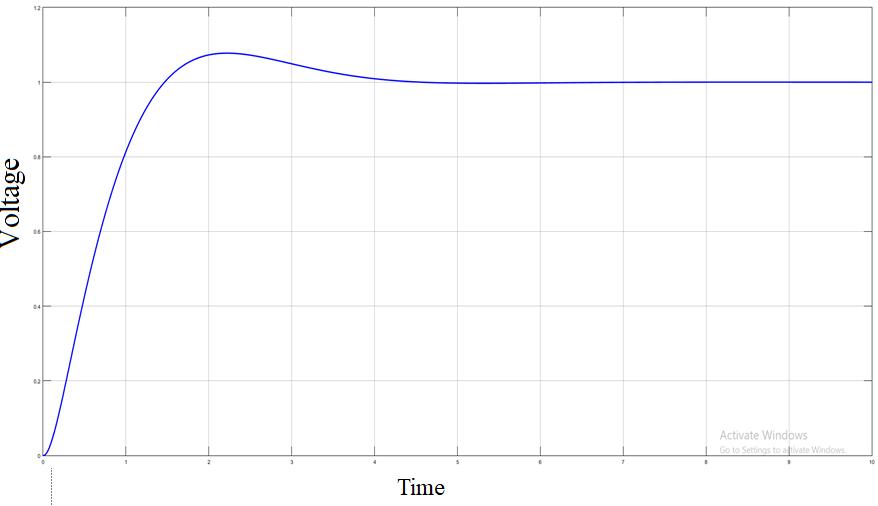
A neural network block is trained to tune the PID so to reduce the transient, below are the step responses of the AVR with tuning the PID through ANN and desirable values are obtained , there is decrease in the overshoot and peak value and settling time. The overshoot is decreasedfrom27.1%to7.75%andthepeakisdecreased from 1.27 to 1.08 and so does the settling time is decreasedfrom4.37secondto3.69seconds.HeretheANN istrainedbyTrainlmwhichisanetworktrainingfunction that uses Levenberg Marquardt optimization to update weight and bias variables. Table 1 depicts the input and output of the ANN block shown in fig.4.and the previous valuesofPIDisgivenintable2whenitisnottuned.
International Research Journal of Engineering and Technology (IRJET) e ISSN: 2395 0056
Volume: 09 Issue: 05 | May 2022 www.irjet.net p ISSN: 2395 0072
The graphic depicts the network's mean squared error asitdecreasesfromabignumbertoalowervalue.Toput it another way, it demonstrates that the network is growing.
Fig 4:ANNblockwiththePIDgains
Fig 5:SysteminwhichPIDistunedwithanANN
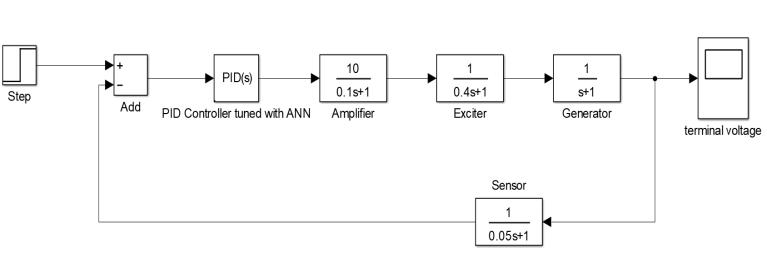
Fig.5. Depicts a system block diagram in which PID controller is tuned by an ANN in which the inputs of the PID are given according to the required output of response.
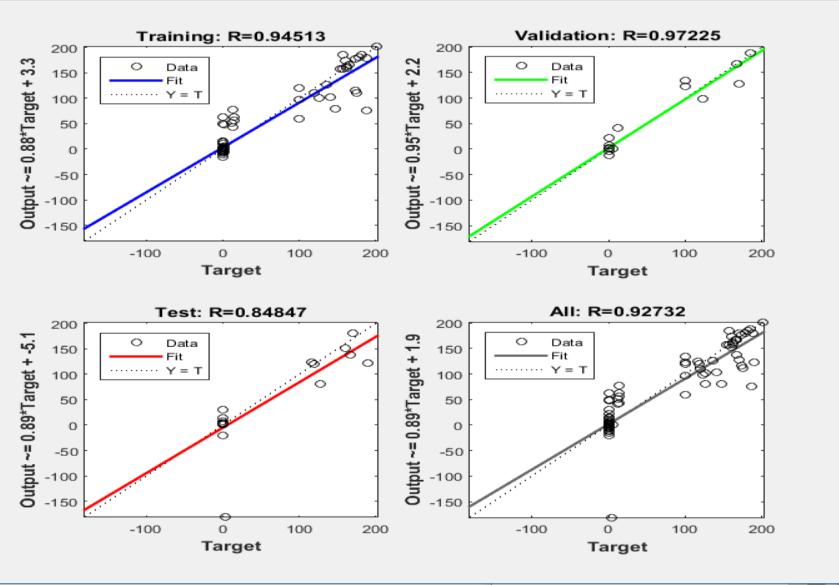
3.1 The following are the different plots of ANN after training
The correlation between outputs and objectives is measured using regression R values. An R value of 1 indicates a close link, whereas a value of 0 indicates a randomrelationship.
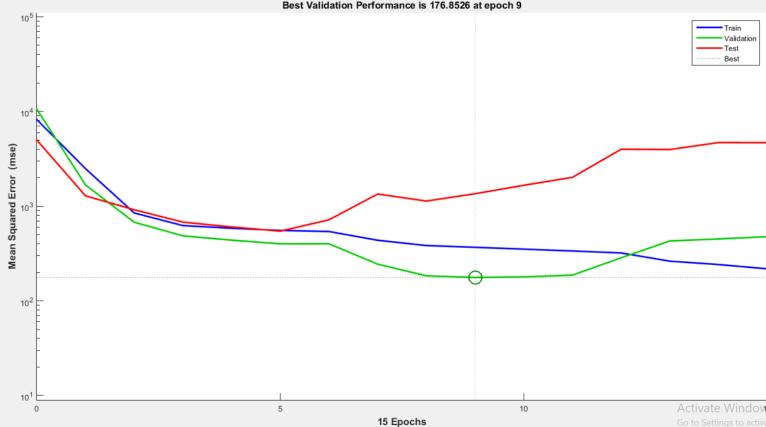
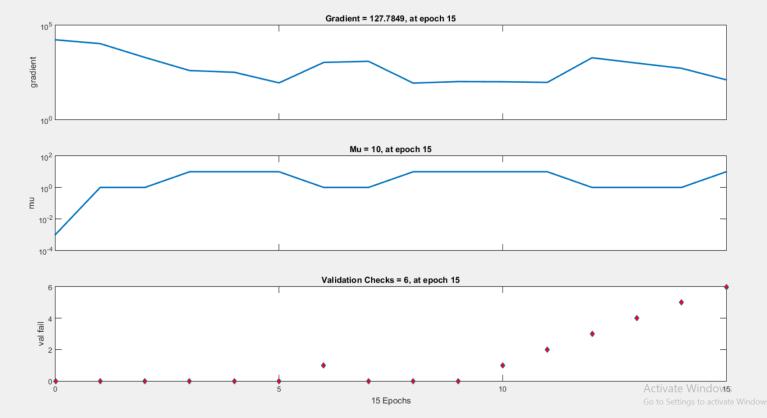
This graph depicts the neural network's best validation performance as well as the training, validation, and test curvesduringthe training process.At the15th epoch, the training has accomplished its purpose. The training state throughputs of a neural network are displayed for 15 epochs. During the 15 epochs of neural network training, the gradient and mu (weight changes of neural network) fluctuate, as well as the number of validation check is 6.Thegradientis127.7849andmuis10atepoch15.
Chart 1:RegressionplotoftrainedANN
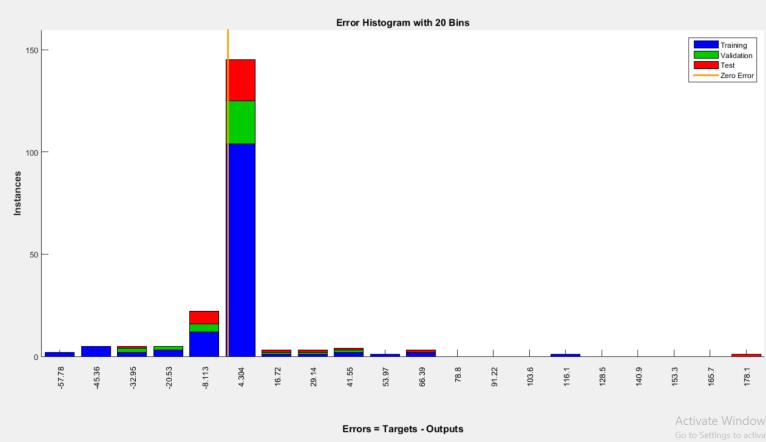
The histogram of errors between target and predicted values after training a feed forward neural network is knownastheerrorhistogram.Theseerrornumbersmight be negative since they represent how anticipated values depart from goal values. The number of vertical bars you
International Research Journal of Engineering and Technology (IRJET) e ISSN: 2395 0056
Volume: 09 Issue: 05 | May 2022 www.irjet.net p ISSN: 2395 0072
seeonthegraphismeasuredinbins.Here,thetotalerror rangeisbrokendowninto20smallerbins.Thenumberof samplesinthedatasetisrepresentedontheY axis.
Table 1: PreviouslyinputsandoutputsofPIDwhennot tuned
Inputs of PID Outputs of PID
KP 1 Risetime 0.205sec. KI 0.28 Settlingtime 4.37sec. KD 0.25 Overshoot 27.1% N 100 peak 1.27
Table 2: InputsandoutputsofPIDwhentuned WithANN
Inputs of PID Outputs of PID when tuned
Chart 4:ErrorhistogramoftrainedANN
KP 0.1777 Risetime 1 KI 0.1785 Settlingtime 3.69 KD 0.04206 Overshoot 7.75% N 147 peak 1.08
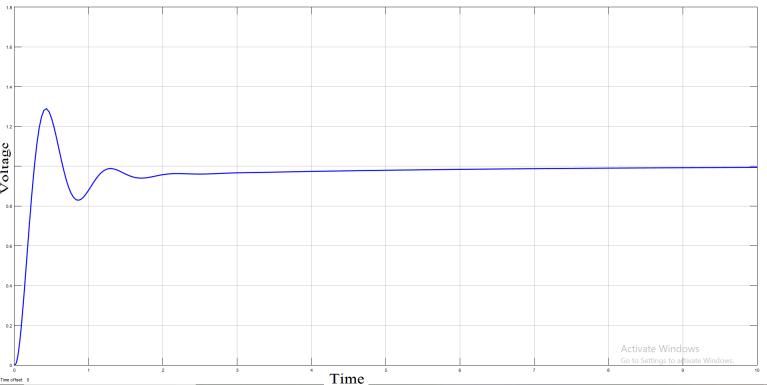
Fig 6:ResponseofthesysteminwhichPIDisnottuned
In this article the ANN which is trained by Levenberg marquart whichusestrainlm network trainingfunctionis employed to tune PID controller to improve the response of output as well as the stability of the power system, the values of the PID constant obtained from the ANN are: KP=0.1777, KI=0.1785, KD=0.04206, all these values are shown in fig.4 in simulations and the outcome of the systemarementionedintable.1andtable.2.
[1] Salah G. Foda, “ANN Based Power System Stabilizers for Large Synchronous Generators” J. King Saud Univ.,Vol. 14, Eng. Sci. (2), pp. 199 209, Riyadh (A.H. 1422/2002).
[2] Modu M. Ibrahim, Jibril D. Jiya and Idakwo O. Harrison, “Modelling and Simulation of Automatic Voltage Regulator System”, International Journal of Computer Applications (0975 8887) Volume 178 No.1,November2017.
Fig 7:ResponseofthesysteminwhichPIDistunedwith ANN
[3] Dr. Abdulrahim Thiab Humod and Abdullah sahib abdulsada, “Neural Network based Robust Automatic Voltage Regulator (AVR) Of Synchronous Generator” publishedbyresearchgateon7july2017.
International Research Journal of Engineering and Technology (IRJET) e ISSN: 2395 0056 Volume: 09 Issue: 05 | May 2022 www.irjet.net p ISSN: 2395 0072
[4] Lodh B (2014) “Simulink Based Model for Analyzing the Ziegler Nichols Tuning Algorithm as Applied on Speed Control of DC Motor” International Journal of Advanced Research in Electrical, Electronics and InstrumentationEngineering.Vol3,issue1,PP6641 6645.
[5] PatondingH.E,LoboE.TandSauM(2015)“Modeling Control of Automatic Voltage Regulator with ProportionalIntegralDerivative”Internationaljournal of research in Engineering and Technology. Vol.4, issue9,PP241 244.