09 Issue:
and Technology (IRJET)
www.irjet.net

e ISSN: 2395 0056
ISSN: 2395 0072
09 Issue:
and Technology (IRJET)
www.irjet.net
e ISSN: 2395 0056
ISSN: 2395 0072
Kedar Basutkar1 , Tanishka Bhatia2 , Harshad Avhad3 , Srushti Yadav4 , Rohit Virkar5 , Chhavi
Kalra6 , Piyush Kolhatkar7 , Dattatray Hulwan8
1234567Student, Vishwakarma Institute of Technology, Pune 8Professor, Dept. of Mechanical Engineering, Vishwakarma Institute of Technology, Maharashtra, INDIA
***
Abstract Electric Vehicles are a growing segment in Indian Auto Market. With the disastrous effects caused climate change and rising costs of conventional fuels such as petrol and diesel, an auto buyer in the market is poised to incline towards buying an EV as compared to an IC engine vehicle. This paper takes into account various aspects that a buyer considers while purchasing an EV. These choices reflect upon the what features are highly prioritized by the buyer and what features a buyer might consider as add on. Hence, the main objective of this survey based study is to find the overall outlook of an Indian consumer to EVs, to find out what are the order qualifiers and order winners while buying an EV, etc. This study aims to serve designers to align the preliminary design decisions related to EV based on consumer choices.
Key Words: Electric Vehicles, Order Qualifiers, Order Winners, Indian Market, Internet Survey.
This decade is going to be a transformational one as conventionalinternalcombustionenginesvehiclesarebeing replacedbyelectricvehicles(EV).EVsbringalongwiththem asetofpromisesforagreenerandacleanerenvironment, but also a set of drawbacks which hamper their adoption. Thesedrawbacksincludeashortbatterylife,highinitialcost andmanymore. Thesurvey performedintheAssignment work aims to findout anIndianconsumer'sperception of EVsanditscurrentoverallmarket.
Ricardo Strategic Consulting (“Ricardo”) conducted a literature review to better understand how and where consumersdriveandrechargetheirelectricvehicles(EVs) andwhattheywouldliketoexperiencewhilerechargingin terms of site design, amenities, capabilities, and services. Ricardo has also analyzed existing literature to both understandcurrentconsumerbehaviorandanticipatehowit could evolve over the next 10 years as more consumers purchaseEVs.Thisexercisehasbeenfocusedonanswering five questions: Who is the customer? 2. When and where doesthecustomerrecharge?3.Whydoesacustomerchoose a particular recharging facility? 4. How do customers interactwithchargingequipment?5.Whatdocustomersdo atfacilitieswhilecharging?Thisliteraturereviewincluded variouspubliclyavailablesourcessuchasexistingRicardo research on consumer preferences; published surveys;
federal, state, and local government publications; cross functional organization publications; scholarly articles; university/institutepublications;nationallabpublications; publicpolicies;andpressreports.Thiswassupplemented withpersonainterviewstoexemplifyfindings.[1]TheMain objectiveofthispaperistoknowthewillingnessofpeopleto buy an electric vehicle. Also, the awareness among the peopleregardingtheelectricvehicle.Questionnairesurveyis done to satisfy the objective. The study area contains 14 wards of panchavati zone (NMC) Nashik Municipal Corporation.Stratifiedrandomsamplingisusetofindout thesamplesizeineachwardandtotal500samplesaretaken andtheanalysisiscarriedout.[2]
1. To find out the overall outlook of an Indian consumer towards the current state of the Electric Vehicles mainly pertaining to market maturity and charginginfrastructure.
2. To find out the patterns in order qualifiers and orderwinnerswhilebuyinganEV.
3. To find out the factors which attract as well as offsetaconsumerfrombuyinganEV.
4.Tofindouthowanaveragepersonperceivesthe likelygrowthoftheEVmarketintermsofyears.

9001:2008
ISSN: 2395 0056
ISSN: 2395 0072
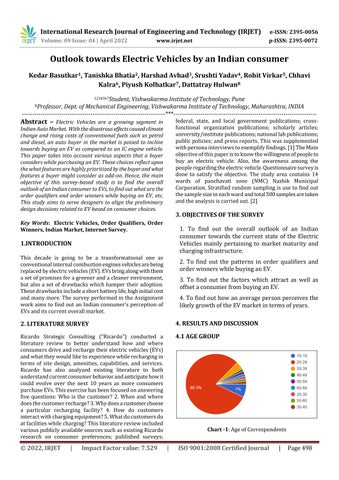
Fromthepatternfoundfromtherespondents’data,itcanbe seenthatover80%oftherespondentsareintheagegroup of 20 29 years old. These respondents are the prime generationoftodaywhicharegoingtobethecustomersin the EV market tomorrow. Hence, the conclusions and insightsdrawnfromthissurveyregardingcustomerschoices andpreferencesholdstrueandaccuratelyfortheupcoming years.
The respondents of this survey come from a wide stratum of the society having different occupations. Hence, the views and insights of the respondents belong to different opinions and backgrounds of different occupational groups. For e.g., 17% of the respondents work in the IT industry. Hence, their opinionsexpressedinthequestionnairearearesultof theirworklifeandincomepattern.Thesamepattern holdstrueforeveryotheroccupationindustryaswell.


4.3 On a scale of 1 - 10, (1 being the worst and 10 being the best). How would you rate the current state of overall EV infrastructure in India?
4.4 On a scale of 1 - 10, (1 being the worst and 10 being the best). How would you rate maturity of EV market in India?
The histogram of this question shows an almost normal distributionhavingamodeat6.Despiteofthispattern,there isasharpmodeat1aswell.Thisindicatesthefactthatmost peopleconsiderthecurrentstateofEVinfrastructuretobe adequatelymature,whilespecificstrataofpeopleconsiderit tobeearlyintheinfantstage.

Likethepreviousquestion,theresponsestothesequestions also show a normal distribution, but unlike the normal distributionfoundinthepreviousquestion,thedistribution inthiscaseischoppy,havingpeaksarealternateintervals. Fore.g.,morepeopleratethatthematurityofEVmarketin Indiaisatlevel5and7thanatlevel6.Thispatternatteststo thefactsthatpeoplehavestrongeropinionforthisquestion. Themodeofthedistributionat7alsoindicatesthatpeople perceivetheofferingsandpricerangeofvehiclesofferedby autocompaniestobequitemature.
4.5 On a scale of 1 10, (1 being the worst and 10 being the best). How would you rate the current state of charging infrastructure in India?
The patternthat emergesfrom the responses to this questionisrightskewed.Hence,respondentsclearlydo notthinkthecharginginfrastructureismatureandfeel that there is room and immense potential for improvement.
4.6 On a scale of 1 10, (1 being the worst and 10 being the best). How would you rate the environmental impacts caused by the current EV technology in India?
Volume: 09 Issue: 04 |
Engineering and Technology (IRJET)
2022 www.irjet.net
Forthisquestion,65%oftheanswerslieintherange of5 8.Thisindicatesthatpeopleareawareofthefact that EVs are more likely to cause less pollution compared to the current generation of ICE vehicles. However,8.5%oftherespondentshaveanswered1to this question, this attests to the fact that these respondentsareawareofthefactthatduringitswhole lifecycle,anEVleavesbehindasignificantamountof carbonfootprintstoo.
4.7 On a scale of 1 - 10, (1 being the worst and 10 being the best). How would you rate the perceived safety of an EV?
e ISSN: 2395 0056
ISSN: 2395 0072
4.9 On a scale of 1 - 10, (1 being the worst and 10 being the best). How would you rate the perceived reliability and longevity of an EV compared to an ICE vehicle?
Theresponsestothisquestionarealsoleftskewed.Themode ofthedistributionisobservedat8.Despitethefactthatthe batteriesofEVsdecayovertimeandtheyhavetobereplaced ataroundevery5years,respondentsfeelthatrestoftheEV componentsarereliableoveralongdurationoftime.
4.10 On a scale of 1 10, (1 being the worst and 10 being the best). How would you rate the perceived reliability and longevity of an EV compared to an ICE vehicle?
Thehistogramoftheresponsesforthisquestionisleft skewed.ThisindicatesthatrespondentsfeelthatanEV is just as safe as a typical ICE vehicle despite having differentcomponentssituatedatdifferentplacesinthe chassis.Theyalsofeelthatdangersofthermalrunaway andthebatterypackcatchingfirearemitigatedbythe OEMsthroughrobustdesignpractices.
4.8 On a scale of 1 10, (1 negligible the worst and 10 being the significant). How would you rate the differences between driving an EV compared to an ICE vehicle?

Orderqualifiersarenecessaryattributesthataproductmust possessforittoenterintocompetition.Accordingto44%of thecrowd,rangeofthevehicleiswhatprovestobeanorder qualifierforthem.


4.11 Which among the following is an orderwinner for an EV for you? (Order winner being a characteristic which makes it the best among other shortlisted products):

Thisquestionwasoptionaltoonlythoserespondents whohavedrivenanEV.Theresponsestothisquestion wereleftskewed.Hence,therespondentsfeelthatan EV driving experience is vastly different than an ICE vehicle driving experience. This difference in experiencecanbeattributedtothefactthatEVshave instanttorqueavailableatanygivenspeed.Also,the overallNVH(noise,vibrationsandharshness)levelsof anEVarelowerascomparedtoanICEvehicle.
Factor value: 7.529
Orderwinnersarethecompetitiveadvantagesovertherest andisthemainreasonwhycustomerspurchaseaparticular product.Therangeofthevehicleprovestowinoverlooks, power,priceetc.
9001:2008
4.12 For which of the following are you willing to pay an add on amount:
Technology (IRJET)

ISSN: 2395 0056
ISSN: 2395 0072
4.15 How many years do you reckon it will likely take to build a mature and reliable infrastructure for EV charging?
39outof71people,whichisover50%oftherespondents, arewillingtopayanadd onamountfortherangeoftheEV. Around43.7%ofthepeoplewouldpayanaddonamountfor variousadvancedtechfeaturesinanEV.


4.13 What according to youroffsets buying an EV to a regular Indian customer.
Onanaverageabout46.5%ofthetotaldistribution,believe thatitwouldtakearound5 10yearstobuildamatureand reliableinfrastructureforEVcharging.
4.16 How many years do you reckon it will likely take for an EV to cost as much as an equivalent ICE vehicle?
For about 45.1% of the people, charging infrastructure offsetsbuyinganEVoverprice,looks,reliability,rangeetc. Nevertheless, the youth ought and hopes to completely eliminateanyoffsetparameters.
4.14 Which aspect about an EV excited you the most:
ElectriccarsareatparorarecostlierthanICEsthesedays. Onanaverageabout53.5%ofthetotaldistributionbelieve that it would take around 5 10 years for an EV to cost as muchasanequivalentICEvehicle.
4.17 On a scale of 1-10 (1 being the worst, 10 being the best), how willing are you to invest in EV companies in India (considering future growth prospects)?
As a budding technology we see a booming response for about31%ofthepeopleexcitedaboutthewholetechnology altogether. Its smoothness and quiet operation are voted secondwithabout23.9%.Comparativeeco friendlinessand runningcostsaretiedbetweenat16.9%votes.
of Engineering and Technology (IRJET)
Volume: 09 Issue: 04 | April 2022 www.irjet.net
Beinganewentrantinthemarketwithbuddingprospectsin yearstocome,investorshavebuckedupwhenitcomesto EVsharesandstocks.WiththecontinuingtrendinEVsabout 25%oftherespondentswouldsurelyinvestinEVs.
Majorityoftherespondentsareundertheagegroupof20 29 years old. Respondents come from a wide variety of occupational backgrounds which makes the results of the surveymoreinsightful.CurrentstateofEVinfrastructureis perceived to be adequately mature by the respondents. Current state of EV market is considered as somewhat maturein terms of product offerings and prices. Charging infrastructure is considered to be in its infancy with a potentialscopeforimprovement.EVsareconsideredgreen and ecofriendly by the respondents. EVs are perceived as safe and reliable. They are considered to have long life. RespondentsclaimthedrivinganEVfeelsfardifferentthan drivinganICEvehicle.Accordingto44%ofthecrowd,the rangeofthevehicleiswhatprovestobeanorderqualifier forthemandgoesaheadtobeanorderwinnerforthesame. 39outof71peoplearewillingtopayanadd onamountfor therangeoftheEV.Forabout45.1%ofthepeople charging infrastructure offsets buying an EV over price, looks, reliability, etc.Asa buddingtechnologyweseeabooming response for about 31 % of the people excited about the wholetechnologyaltogether.Onanaverageabout46.5%of thetotaldistributionbelievethatitwouldtakearound5 10 years to build a mature and reliable infrastructure for EV chargingand53.5%ofthetotaldistributionbelievethatit wouldtakearound5 10yearsforanEVtocostasmuchas anICEvehicle.Withthecontinuingandupcomingadvances and trends in EVs, about 25% of the respondents would surelyinvestinEVs.
[1] EV Consumer Behavior, (June, 2021). Fuel Institute (ElectricVehicleCouncil),RicardoInc.DetroitTechnical Center
[2] P. Dhikale, R. Jain, (June, 2020), Willingness of people to buy an electric vehicle Questionnaire Survey, Journal of Interdisciplinary Cycle Research, Volume XII, Issue VI, June/2020, Page No:601R. Nicole, “Title of paper with onlyfirstwordcapitalized,”J.NameStand.Abbrev.,in press.
e ISSN: 2395 0056
p ISSN: 2395 0072
9001:2008