1M.Tech in RS & GIS , RSAC UP, Lucknow, Uttar Pradesh,
2Junior Research Fellow, Department of Civil Engineering, IIT BHU, Varanasi, India

3Assistant Professor, Department of Civil Engieering, IIT BHU, Varanasi, India
4Scientist SD, RSAC UP, Lucknow, Uttar Pradesh, India
Abstract The present study monitors the interrelationshipofQuantativeanalysishasbeenperformedfor river temperature and Normalised Difference Turbidity Index (NDTI) respectively for river water quality assessment. Ghazipur, Varanasi, andMirzapurstretcheshavebeenselected for this study. The temporal variation in turbidity and temperature was analyzed for the years 2010, 2015, 2019 & 2021 using LANDSAT 5,8 archive. In this study, it has been found that the Varanasi stretch showcases the highest river temperature followed by Mirzapur and Ghazipur stretches respectively. The river turbidity derived through NDTI also follows the same pattern. This can be attributed to impact of highpopulationcontributingtodomesticandindustrialwaste flowing into river Ganga in vicinity to Varanasi city. Statistical analysis highlights the high correlation coefficient and regression coefficient values i.e., 0.834 & 0.696 respectively between turbidity and temperature along Varanasi stretch followed by correlation coefficient and regression coefficient values of 0.809 & 0.655 along Mirzapur stretch and values of 0.809 & 0.654 for river stretch along Ghazipur for the corresponding years. The study elicites the impact ofturbidity onriver temperature andalsoemphasizestheuseofGeospatial technique to make quantitative estimates, even in the absence of field observations.
Key Words: LANDSAT; Turbidity; NDTI; river temperature.
1. INTRODUCTION
Themappingoftheriverortheinlandwaterqualityusing remote sensing technology was not new for the scientific community, and this activity has been practiced since the 1970s with the launch of the Landsat series of satellites (Klemas et al. 1971; Ritchie et al.1976). The conventional procedures for testing the water quality parameters are expensive as well as time consuming, and it provides informationonlyforthepoint(s)undermeasurement.The remote sensing technology can be utilized as an advantageousalternativeoptioninthisregard(Novo et al. 2006; Lamaro et al. 2013). Every earth's surface features behave uniquely while interacting with electromagnetic radiation(EMR).Thisdistinctivenessgeneratesintheform
ofthespectralsignaturefromeach surfacefeature,andthis signature has been utilized to identify the surface feature through satellite images. When a slight change in the compositionofafeatureoccurs,itsimultaneouslychanges the spectral signature(Moore 1980). Several factors accompanythechangeofthespectralsignatureforafeature, andthesamecanbevalidforthewaterfeature.Someofthe factors responsible for generating the different spectral signaturesofwateraretheelevationangleofthe sun,the seasonoftheyear,watersurfaceroughness,turbidity,depth of the water, and vegetation growth on the water surface (Garg et al. 2020). By studying these different spectral signatures,andsometimesthequantitativeassessmentofa particularcomponentcanbeaccomplished(Chander et al. 2019; Luis et al. 2019) with the help of remote sensing technology.
Therivertemperatureisoneofthecrucialparametersasit influencestheriverecologyandmarinelife(Caissie,2006; Lingetal.,2017;Smith,2008;Wawrzyniaketal.,2012).The temperatureofthewaterisoneofthesignificantparameters because it is helpful in regulating the rate of chemical reactions in the river. The continuum concept of the river signifies that any change in the river temperature can intenselyimpactthelongitudinaldistributionoforganisms inthefluvial ecosystem(Vannote et al. 1980;Wawrzyniak etal.,2012).Biologicalprocessesoftheaquaticspecies,such as growth, reproduction, and survival rate, show a decreasingtrendwhenstreamtemperatureintheriverrises aboveaspecificthresholdvalue(Eatonetal.1995;Xinand Kinouchi, 2013).AccordingtoVant’sHofftheory,itcanbe stated that for every 10ºC rise in the temperature of the water, the biological activity nearly doubles within the temperature range of 0 40°C under normal situations (Gillooly et al. 2001;Caissie2006). Incomparisontothein situmeasurements, theremotesensingtechniquesprovide alluringpossibilitiesforestimatingandobservingtheriver temperatureaswellthespatialthermalpatternoftheriver (Ling et al. 2017). Several researchers are now using remote sensing technology for estimating the river temperature.Thethermal bandspresentintheLANDSAT satellitesystemhavebeenusedforthispurpose(Lamaro et al. 2013;Wawrzyniak et al. 2016).
Monitoring NDTI-River Temperature relationship along the river ganga in the segments around Ghazipur, Varanasi & Mirzapur district using Geo-spatial techniquesVandana
Turbidity is another essential water quality parameter where suspended sediments, instead of transmitting the lightalongthewatercolumnitscattersthelight(Sebastiá Frasquet et al. 2019). Whentheconcentrationofsuspended solidsorsedimentsinwaterincreases,theturbidityalsogets enhanced(Ritchie et al. 1976;Garg et al. 2017).Thehigher valueofturbidityescalatestheopacity ofthewater,which inturnhampersaquaticlife (Quang et al. 2017;Sebastiá Frasquet et al. 2019).Severalresearchershavementioned that temporal change in the concentration of the river turbidity canoccurbecauseofthevariationintheweather and climate pattern and also due to the human activities nearthebankoftheriver(Luis et al. 2019;Garg et al. 2020).
Inthispresentwork,anattempthasbeenmadeforanalysing the waterqualityparameters liketemperature&turbidity for the river Ganga at Ghazipur, Varanasi, and Mirzapur stretches.ThetemporalstudyoftheLandsat 8andLadsat 5 datahavebeenperformedfortheyear2010,2015,2019and 2021.
Cloud free satellite images have been considered for this study.For the processing of the image ArcGIS Desktop platform has been used. Satellite images freely available fromUSGSEarthExplorer, nofielddata wascollectedfor this time period, the results are calculated by existing algorithms for calculating the temperature of the river temperatureandNDTI usedinthisanalysis.
2.MATERIALS AND METHODS
2.1. Study area
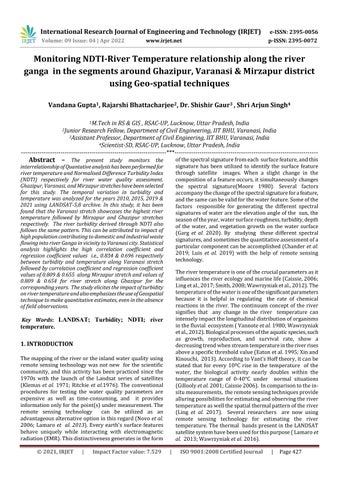
The selected stretch area lies between Ghazipur and MirzapurislocatedinthenorthernpartofIndia insouth eastern Uttar Pradesh between the coordinates 82.56°E, 25.13°N to 83.57°E, 25.58°N (Yadav et al. 2020). This segmentoftherivercomesunderthegeomorphologicalunit of CentralGangaPlains.Inthisregion,theGangariverplain isflatalluvialinnature,havinga shallowdepressionanda small eastward gradient. The width of the river varies between 700 750 meters in the study stretch, and the averageheightofthisregionis76.19metersabovethemean sealevel(Rai et al. 2010;PandeyandSingh,2017).Inthis part,thesummerseasonusuallyhasa longerdurationas comparedtothewinterseason.Thesummertemperature variesbetween32 47°C,whereasthewintertemperature hoversaroundtherangeof5 15°Cmostly.Varanasiisavery famouscity whichliesinthisregion,anditisalsocalledthe spiritual capital of India. This city is also famous for silk products,ivory,andsculptures(Garg et al. 2020).Thiswork hasbeenperformedonthe riverstretchsituatednearthe threecitiesthatliesinthestudyarea.Thethreestretches havebeenmarkedwithredcolourforwhichtheworkhas been performed. The location map has been drawn in Figure1.
2.2. Satellite imagery datasets
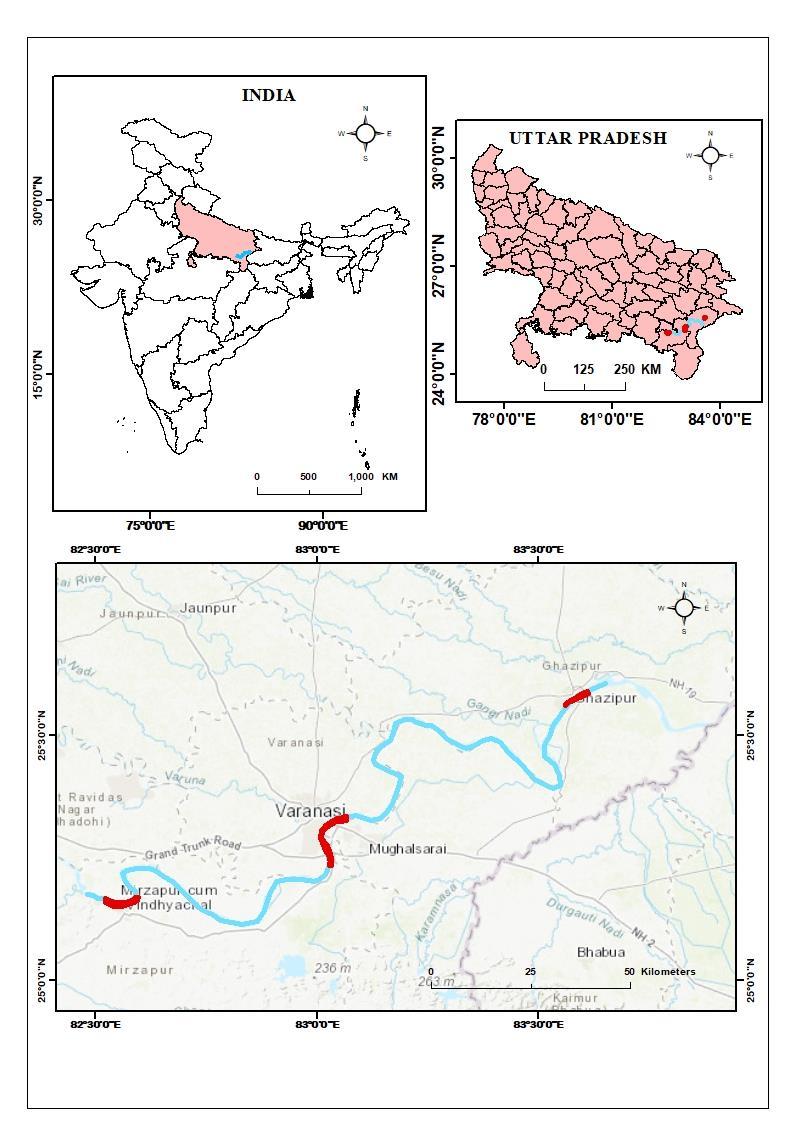
Theessentialinformationsourceforthisworkwasaseries of Landsat 8 and Landsat 5 satellite images. Landsat 8 satelliteconsistof11bandsofdifferentwavelengthsamong whichtherearetwothermalinfrared(TIR)bandsnamely, band10(10.60 11.9μm)andband11(11.50 12.51μm).And Landsat 5 satellite consist of 8 bands of different wavelengths among which there is one thermal infrared (TIR)bandsnamely,band6(10.40 12.50μm).TheLandsat sceneswereselectedforthisstudyhaving pathid“142”and rowid“42”and“43”. ThechosenLandsatsceneswerefor the years 2010,2015,2019 and 2021, having almost 0% cloud cover and were freely downloaded from the United StatesGeologicalSurveyEarthExplorersite.Alltheimages were Level 1T products, which have been precision and terrain corrected in Geo TIFF format and are in the UTM Zone 44N projection and WGS 84 as ellipsoidal datum (http://earthexplorer.usgs.gov)(Lingetal.,2017;Reuteret al.,2015).Thedetailsofstretchwisesatellitedatausedare giveninTable1
Fig. 1. Locationmapofstudyarea.Multispectral Sensing
NDTI = (RR RG) / (R ) (1)
Where RR and RG is the reflectance in the red and green band. Generally, the reflectance of pure water is more in greenthantheredwavelengthregion.However,ithasbeen reportedthat the red region reflectanceincreaseswith an increase in turbidity. Therefore, the red and green bands wereusedtoenhancetheimageforturbidity.Initially,the waterpixelswereidentifiedasmentionedabove,then Eq. wasappliedusingthesetwobandstomapNDTI.Thehigher valueofturbidityyieldsahighvalueofNDTIandviceversa.
2.3.b. Estimation of river temperature
Theatmosphericcorrectionoftheradianceofthermalband involves the elimination of atmospheric effects, which impartsnoiseinthesignalreceivedbythesensors.Forthe corrected water surface radiance, several atmospheric parameters like Lλup(upwelling radiance), τ(atmospheric transmissivity),Lλd(downwellingradiance)willberequired and in addition to these parameters ‘ε’ (water emissivity) valuewillalsobeneeded.Atmosphericparameters(Lλup,τ, Lλd)wereobtainedfrom‘AtmosphereCorrectionParameter Calculator’(http://www.atmcorr.gsfc.nasa.gov/)(Lamroet al.2013;Lingetal.,2017).Inthiswork,emissivityofwater wastakenas0.9885(Simonetal.,2014).
Forrivertemperatureestimation,wehavetocalculateTop ofAtmosphere(TOA)spectralradiancefirst,usingformula:
Lλ =ML*Qcal +AL (2)
where Lλ is the TOA spectral radiance (Watts/(m2*srad*μm)),MLisBand SpecificMultiplicativere scalingfactorfrommetadata,Qcalisquantizedandcalibrated standard product pixel value DN and AL is Band Specific additive re scaling factor from metadata. Afterwards, calculatedTOAvalueiscorrectedbyusingtheformula:
Lλcor= τ.ε. Lλ+ Lλup+ Lλd(1-ε). τ (3)
where, symbols have the usual meanings and these meanings have been already described above. Then, the spectral radiance can be converted to brightness temperatureindegreeCelsiususingthefollowingformula:
2.3.a. Estimation of turbidity through NDTI
Ithasalsobeenreportedintheliteraturethatrelyingona single band or algorithm sometimes results in overestimationorunderestimationofsuspendedsediment concentration (Kuhn et al. 2019; Pahlevan et al. 2019). It wassuggested,eitherusecombinationofsensitivebandsor differentalgorithmstoreachthefinalconclusion.Therefore, an attempt has been made to qualitatively estimate the temporal turbidityineachstretchusingtheNDTIdeveloped by Lacauxetal.(2007).
T= [K2 /(ln((K1 /Lλcor)+1))] 273.15 (4)
where,K1andK2arethermalconstantofthesatellite(Barsi etal.,2014;RajeshwariandMani,2014).ValueofML andAL ofthestudyareais0.000342and0.1respectively.Thevalue ofK1andK2ofthesatellite’sband10(Landsat 8)forstudy areais774.8853and1321.0789.ThevalueofK1andK2of thesatellite’sband6(Landsat 5)forstudyareais607.76and 1260.56.Thesevalueswecangetfrommetadatafileofthe satelliteimage(http://earthexplorer.usgs.gov)(Rajeshwari andMani,2014).
Thermal3. RESULTS AND DISCUSSION
Theresulthasbeenpresentedintheformofthelinegraph forrivertemperatureandNDTIduringthetimeperiodfor theyears2010,2015,2019,2021.Differentmonths(April, MayandJune)havebeenchosen forthisstudybecauseof the cloud cover issue associated with LANDSAT 8 AND LANDSAT 5imageries.
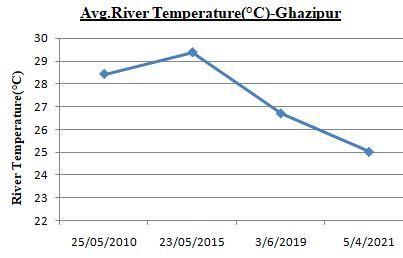
River temperature in the Ghazipur region during 2010liesbetween24.80°Cto28.40°Cwithaverage valueof28.44°C;during2015liesbetween27.80°C to 36.50°C with average value of 29.39°C; during 2019liesbetween25.10°Cto34.50°Cwithaverage value of 26.71°C and for the period of 2021, the temperaturesituatedbetween23.30°Cand36.60°C with average value of 25.02°C with most of the valuesfallswithin26.1°C.
FortheVaranasiregion,thetemperaturerangefor 2010liesbetween24.90°Cto29.70°Cwithaverage valueof29.67°C;during2015liesbetween28.10°C to 3940°C with average value of 29.68°C; during 2019liesbetween2460°Cto3230°Cwithaverage value of 26.1°C and for the period of 2021, the temperaturesituatedbetween23.70°Cand3530°C withaveragevalueof25.73°C
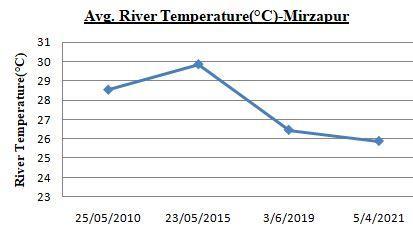
TheMirzapurregionalsoshows asimilartrendto that of Varanasi and Ghazipur. The significant temperaturerangeof2010liesbetween27.80°Cto 31.30°Cwithaveragevalueof28.54°C;during2015 liesbetween28.40°Cto36.20°Cwithaveragevalue of 29.86°C; during 2019 lies between 25.40°C to 27.85°Cwithaveragevalueof26.45°Candforthe periodof 2021,thetemperaturesituatedbetween 24.70°Cand32.40°Cwithaveragevalueof25.87°C
TheNDTIvalueshavebeencalculatedforthetimeperiodof 2010,2015,2019,and2021usingLANDSATdatasets.The NDTItrendforallthreestretchesshowsa similarpattern showsaslightdownwardtrend
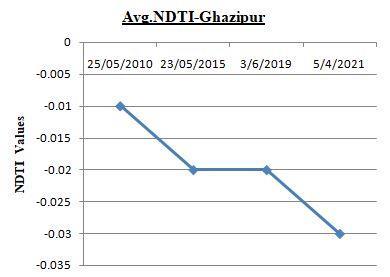
Fortheperiodof2010,theNDTIrangeofGhazipur, Varanasi, andMirzapurare 0.01to0.03, 0.03to 0.02, and 0.03 to 0.02, respectively with the averagevaluesof 0.01, 0.02, 0.02.
Fortheperiodof2015,theNDTIrangeofGhazipur, Varanasi, andMirzapurare 0.04to0.04, 0.05to 0.04, and 0.04 to 0.03, respectively with the averagevaluesof 0.02, 0.03, 0.03.
Fortheperiodof2019,theNDTIrangeofGhazipur, Varanasi, andMirzapurare 0.04to0.03, 0.04to 0.03, and 0.05 to 0.03, respectively with the averagevaluesof 0.02, 0.03, 0.03.
Fortheperiodof2021,theNDTIrangeofGhazipur, Varanasi, andMirzapurare 0.04to0.03, 0.05to 0.04, and 0.05 to 0.03, respectively with the averagevaluesof 0.03, 0.04, 0.04.
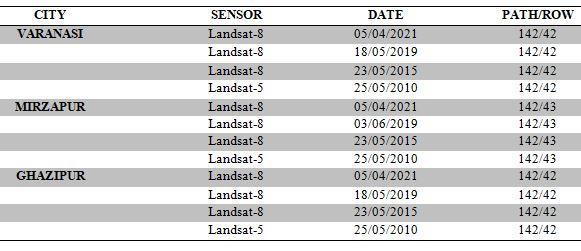
Figure 3,4,&5showsmapyayoutRepresentationforNDTI& River Temperature for the three stretches. And Figure 3(a),(b);4(a),(b)&5(a),(b)showslinegraphrepresentation for(a)Avg.NDTI(b)Avg.RiverTemperature(°C)forthethree stretches
Fig. 3. Map Layout Representation for NDTI & River TemperatureforGhazipurstretch.
Fig. 3: Line Graph Representation for (a)Avg.NDTI (b)Avg.RiverTemperature(°C)forGhazipurstretch.
3.1.Map Layout representation of river temperature and NDTI values
Fig. 4. Map Layout Representation for NDTI & River TemperatureforVaranasistretch.
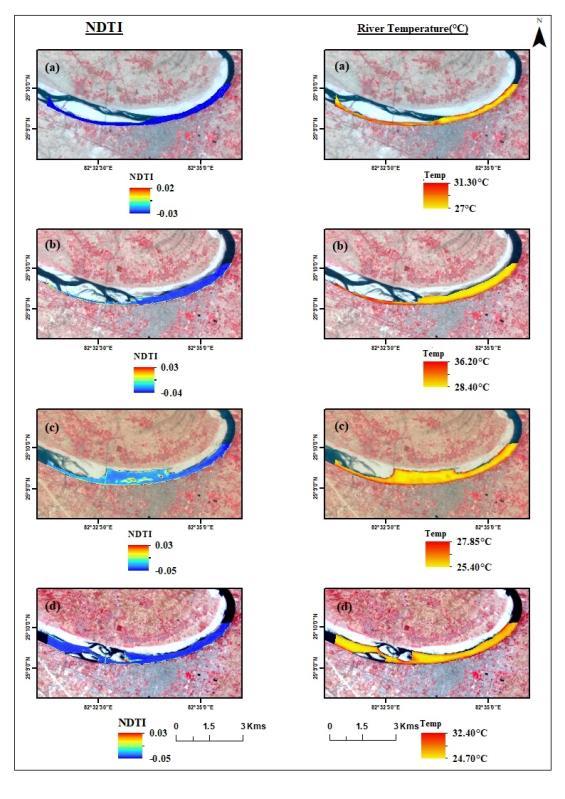
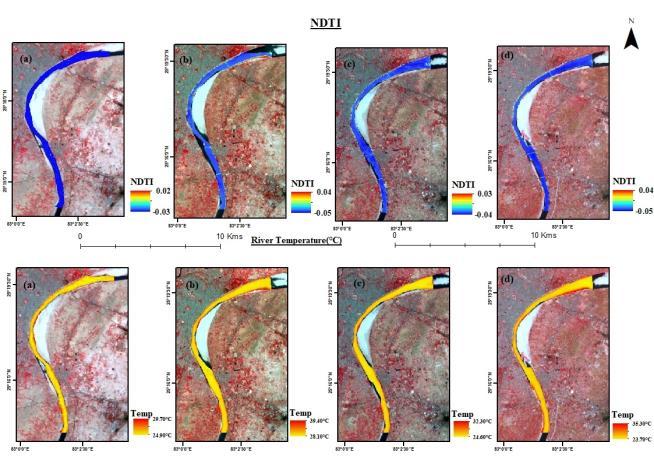
Fig. 4(a): Line Graph Representation for Avg.NDTI for Varanasistretch.
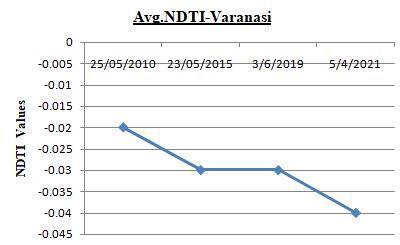
Fig. 5. Map Layout Representation for NDTI & River TemperatureforMirzapurstretch.
Fig. 4(b): Line Graph Representation for Avg.River Temperature(°C)forVaranasistretch.
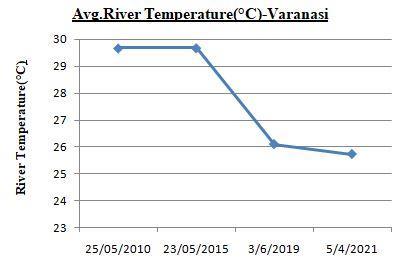
Fig. 5(a) Line Graph Representation for Avg.NDTI for Mirzapurstretch.
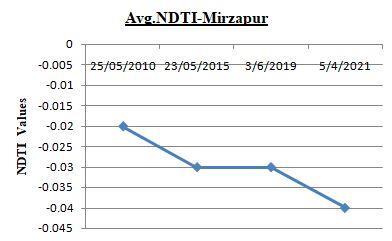
Fig. 5(b): Line Graph Representation for Avg.River Temperature(°C)forMirzapurstretch.
3.2 Relation between river temperature and NDTI
ThecorrelationgraphshavebeenplottedfortheGhazipur, VaranasiandMirzapurregion.NDTIvalueshasbeenplotted onX axisandrivertemperaturehasbeenplottedonY axis.
By calculating the correlation between River temperature andNDTI,itcanbeclearlynoticedthatboththeparameters aredirectlypropotionaltoeachother
When the temperature is greater, the NDTI value is also greater which points out the increase in the turbidity values.Theyshowahighpositivecorrelation
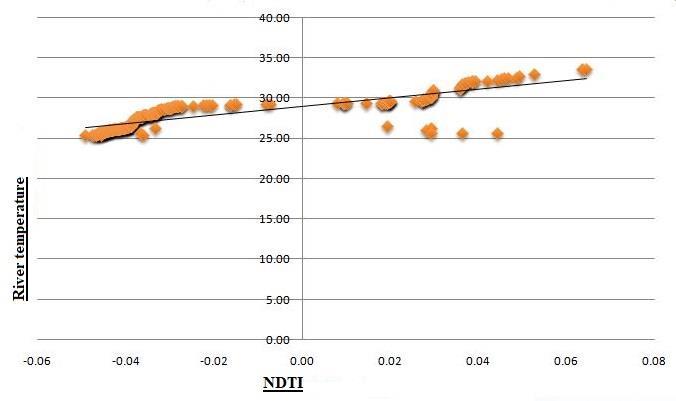
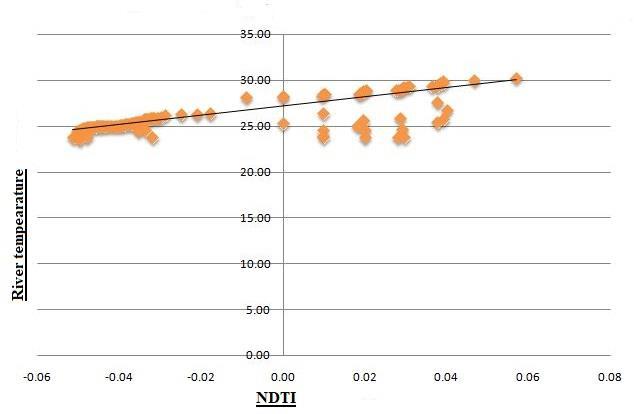
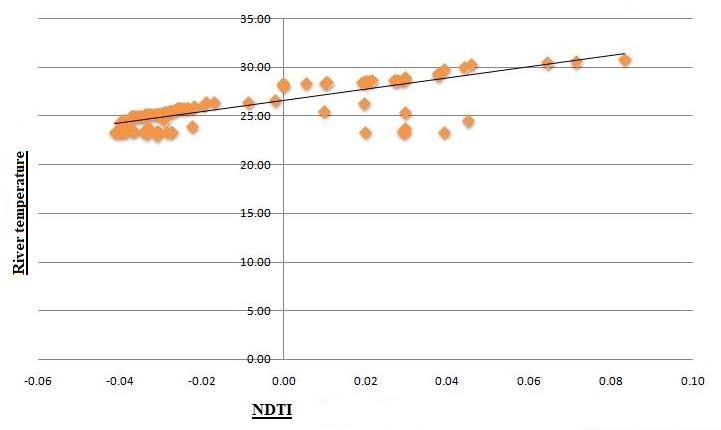
ThecorrelationbetweenrivertemperatureandNDTIis0.655 forVaranasistretch,0.696forMirzapurStretchand0.654for Ghazipur stretch. Fig.6(a), Fig.6(b). and Fig.6(c) shows the correlation graph b/w river temperature and NDTI for Ghazipur,VaranasiandMirzapurstretch.
Fig. 6(c): Correlationgraphb/wrivertemperatureandNDTI forMirzapurstretch.
3.3. Special emphasis for the Varanasi stretch
Varanasi city is one of the most populated cities in the country and also one of the very famous places of Vedic culture.It isthe most populatedand importantcityofthe consideredriverstretch.Thisistheregionworstaffectedby polluted water of the river as the huge number of the population in this region depends on the river water for theirnumerousworks.Theaquatic ecosysteminthisregion has been hampered heavily due to anthropogenic and industrial activities. Moreover, in this stretch, two rivers VarunaandAssi,havejoinedwiththeriverGangaandthese rivers bring immense waste along with them. If the river restorationworkcanbeadequatelyperformedinthisregion, thenfortheotherareasoftheconsideredstretch,itwould notbeaverychallengingtask.
Fig. 6(a): Correlationgraphb/wrivertemperatureandNDTI forGhazipurstretch
5. CONCLUSIONS
Satelliteimagerieshavebeenusedforthespatio temporal analysis of the river water quality parameter in the consideredstudystretchfortheyears2010,2015,2019and 2021.
In the Mirzapur stretch, the temperature of the riverGanga decreasesmostin2019by 3.41°C as compared to 2015 then in 2021 decreases by 0.58°Cascomparedto2019
Similarly,intheVaranasi stretch,thetemperature had been reduced most in 2019 by 3.58°C as compared to 2015 then in 2021 decreases by 0.37°Cascomparedto2019
Fig. 6(b): Correlationgraphb/wrivertemperatureandNDTI forVaranasistretch.
And in the Ghazipur stretch, this decline of the temperature of the river was noted as 2.68°C in 2019ascomparedto2015thenin2021decreases by 1.69°Cascomparedto2019.
International Research Journal of Engineering and Technology (IRJET)
e ISSN: 2395 0056
Volume: 09 Issue: 04 | Apr 2022 www.irjet.net
The decreaseintheNDTIvalueshowedadifferenttrend.
IntheMirzapurstretch,theNDTIoftheriverGanga decreasesby 0.01in2015ascomparedto2010, thenin2019showssimilartrendascomparedto 2015 then in 2021 also decreases by 0.01 as comparedto2019.
Similarly, in the Varanasi and Ghazipur stretch showssimilartrendasMirzapurstretch.
ACKNOWLEDGEMENT
Theauthordeeplythankstoco authorstocarryforwardthis study and for the technical and theoretical support and continuoussupportinwritingpartofthisresearchpaper.
REFERENCES
[1] Klemas V, Borchardt J F and Treasure W M; “Suspendedsedimentobservationsfrom ERTS 1”, Remote Sensing of Environment, 2, 205 221, (1971).
[2] Ritchie J, Schiebe F R and McHenry J R; “Remote sensingofsuspendedsedimentsinsurfacewaters” , Photogrammetric Engineering & Remote Sensing, 42(12),1539 1545,(1976)
[3] de Moraes Novo E M L, de Farias Barbosa C C, de Freitas R M, Shimabukuro Y E, Melack J M and PereiraFilhoW;“Seasonalchangesinchlorophyll distributions in Amazon floodplain lakes derived fromMODISimages”;Limnology7:153 161,(2006).
[4] LamaroAA,MariñelarenaA,TorrusioSEandSalaS E; “Water surface temperature estimation from Landsat 7 ETM+ thermal infrared data using the generalized single channel method: Case study of Embalse del Río Tercero (Córdoba, Argentina)” ; Advances in Space Research, 51(3), 492 500, (2013)
[5] Moore G K; “Satellite remote sensing of water turbidity” , Hydrological Science Journal, 25(4), 407 421,(1980).
[6] GargV,Aggarwal SPandChauhanP;“Changesin turbidity along Ganga River using Sentinel 2 satellite data during lockdown associated with COVID 19” , Geomatics,NaturalHazardsandRisk, 11(1),1175 1195,(2020)
[7] ChanderS,GujratiA,HakeemKA,GargV,IssacAM, Dhote P R; “Water quality assessment of River Ganga and Chilika lagoon using AVIRIS NG hyperspectraldata” ,CurrentScience,116(7),1172 1181,(2019).
[8] LuisKM,RheubanJE,KavanaughMT,GloverDM, WeiJ,LeeZandDoneySC;“Capturingcoastalwater clarityvariabilitywithLandsat8” ,MarinePollution Bulletin,145,96 104,(2019)
[9] CaissieD;“Thethermalregimeofrivers:areview”; Freshwaterbiology,51(8),1389 1406,(2006)
[10] LingF,FoodyGM,DuH,BanX,LiX,ZhangYandDu Y; “Monitoring thermal pollution in rivers downstreamofdamswithLandsatETM+thermal infrared images” ; Remote Sensing , 9(11), 1175, (2017).
[11] K. Smith, “River water temperatures: an environmental review”. Scottish Geographical Magazine.88, 211 220,(2008)
[12] WawrzyniakV,PiégayHandPoirelA;“Longitudinal andtemporalthermalpatternsoftheFrenchRhône River using Landsat ETM+ thermal infrared images”;Aquaticsciences,74,405 414,(2012).
[13] VannoteRL,MinshallGW,CumminsKW,SedellJR and Cushing C E, “The river continuum concept” ; CanadianJournalofFisheriesandAquaticSciences, 37(1),130 137, (1980)
[14] EatonJG,McCormickJH,GoodnoBE,O'brienDG, Stefany H G, Hondzo M and Scheller R M, “A field information based system for estimating fish temperaturetolerance” ;Fisheries20(4),Pages10 18,(1995)
[15] Xin Z and Kinouchi T; “Analysis of stream temperature and heat budget in an urban river understronganthropogenicinfluences” ; Journalof Hydrology,489,16 25,(2013).
[16] GilloolyJF,Brown J H, WestGB,SavageVM and Charnov E L; “Effects of size and temperature on metabolic rate” ; Science, 293(5538), 2248 2251, (2001).
[17] Wawrzyniak V, Piégay H, Allemand P, Vaudor L, GomaRandGrandjeanP;“Effectsofgeomorphology and groundwater level on the spatio temporal variabilityofriverinecoldwaterpatchesassessed using thermal infrared (TIR) remote sensing” ; Remote Sensing of Environment, 175, 337 348, (2016).
[18] Sebastiá Frasquet M T, Aguilar Maldonado J A, Santamaría Del ÁngelEandEstornellJ;“Sentinel2 analysisofturbiditypatternsin acoastallagoon” ; RemoteSensing,11(24),2926,(2019)
[19] GargV,KumarAS,AggarwalSP,KumarV,DhoteP R, Thakur P K, “Spectral similarity approach for
p ISSN: 2395 0072 2021, IRJET | Impact Factor value: 7.529 | ISO 9001:2008 Certified Journal | Page433
International Research Journal of Engineering and Technology (IRJET)
e ISSN: 2395 0056
Volume: 09 Issue: 04 | Apr 2022 www.irjet.net
mappingturbidityofaninlandwaterbody” ;Journal ofHydroogy, 550, 527 537,(2017).
[20] Quang N H, Sasaki J, Higa H and Huan N H, “Spatiotemporal variation of turbidity based on landsat8oliincamranhbayandthuytrieulagoon, Vietnam” ;Water, 9(8), 570,(2017)
[21] YadavNA,OhriAandDasN,“AnalysisofThermal Pattern Variation for River Ganges with Satellite Imagery” ;Journal of WaterResource Engineering and Management, 7(3), 21 30,(2020).
[22] RaiPK,MishraAandTripathiBD,“ Heavymetal andmicrobialpollutionoftheRiverGanga:Acase study of water quality at Varanasi” ; Aquatic Ecosystem Health&Management, 13(4), 352 361, (2010)
[23] PandeyJandSinghR, “Heavymetalsinsediments of Ganga River: up and downstream urban influences” ; Applied Water Science, 7(4), 1669 1678,(2017).
[24] ReuterDC,RichardsonCM,PelleranoFA,IronsJR, Allen R G, Anderson M, “The Thermal Infrared Sensor(TIRS)onLandsat8:Designoverviewand pre launchcharacterization”;RemoteSensing, 7(1), 1135 1153,(2015)
[25] Kuhn C, de Matos Valerio A, Ward N, Loken L, Sawakuchi H O, Kampel M, “Performance of Landsat 8 and Sentinel 2 surface reflectance products for river remote sensing retrievals of chlorophyll a and turbidity” ; Remote Sensing of Environmemt, 224, 104 118,(2019).
[26] Pahlevan N, Chittimalli S K, Balasubramanian S V and Vellucci V, “Sentinel 2/Landsat 8 product consistencyandimplicationsformonitoringaquatic systems” ;RemoteSensingofEnviroment, 220, 19 29,(2019)
[27] LacauxJP,TourreYM,VignollesC,NdioneJAand LafayeM, “Classificationofpondsfromhigh spatial resolutionremotesensing:ApplicationtoRiftValley Fever epidemics in Senegal” ; Remote Sensing of Environment, 106(1), 66 74,(2007).
[28] R.N.Simon,T.Tormos,P.A.Danis,“Retrievingwater surface temperature from archive LANDSAT thermal infrared data: Application of the mono channelatmosphericcorrectionalgorithmovertwo freshwater reservoirs” International Journal of AppliedEarthObservationandGeoinformation,30, 247 250,(2014)
[29] Barsi, J.A., Lee, K., Kvaran, G., Markham, B.L. and Pedelty,J.A.; ”TheSpectralResponseoftheLandsat
8 Operational Land Imager”, Remote Sensing, 6, 10232 10251,(2014).
[30] Rajeshwari,A.andMani,N.D., “EstimationofLand Surface Temperature of Dindigul District Using Landsat8Data” , InternationalJournalofResearch in Engineering and Technology, 3, 2319 1163, (2014)
p ISSN: 2395 0072 2021, IRJET | Impact Factor value: 7.529 | ISO 9001:2008