Issue:
Engineering and Technology (IRJET)

www.irjet.net
Issue:
Engineering and Technology (IRJET)
www.irjet.net
e ISSN: 2395 0056
ISSN: 2395 0072
Yash Maroo1, Sairaj Marshetty2, Aditi More3, Pawan Gond4, Hemalata Mote5
1,2,3,4B.E. Student, Dept. of Electronics and Telecommunication, Atharva College of Engineering, Mumbai, India
5 Professor, Dept. of Electronics and Telecommunication, Atharva College of Engineering, Mumbai, India
***
Abstract Tourismisoneofthemassiveandrapidgrowing economicsectorsintheworld.Sincetouriststaysaregenerally of short duration, it may be interesting to analyze daily behaviorsoftourists.Basedongeo locatedinformationleftby touristsoncommunitywebsitesofphoto sharing,wepropose anoriginalapproachtoanalyzedailybehaviorsoftouristsby analyzingsequencesofplacesvisitedbytouristsperday.Our workwouldbebeneficialforthetouristsaswellasthepeople involvedinthetourismindustrybyfacilitatingquickerservices tothetourists.Weexperimentedourapproachwithdatafrom TourpediawebsiteabouttourisminParis.
Key Words: Tourism, geo located information, daily tourism behaviour, Tourpedia.
ThetourismindustryinIndiageneratedabout16.91Lakh CroreorUS$240billionintheyear2018whichwas9.2%of India’sGDP.Itwasresponsibleforgenerating42.673million jobsor8.1%ofIndia'stotalemployment.Withsuchalarge contribution, it is important that the government and the local authorities focus on improving this sector of the economywiththerightresearchandtheinvestmentsinthe rightplaces.Theanalysisofthetouristbehaviouristhemost importantindicatororpredictoroffuturetouristbehaviour.
Takingunderconsiderationthesocialroleofthetourist,the behaviour of a tourist also can be an indicator of the behaviourofothers Withtheirconduct,sightseerssetthe socialstandardsofconductwithinbackgroundoftourism. These standards are being followed by other consumers, thosewhohavenotyetengagedinorareengagedintravel ortourismactivities.Atouroperatormustbeabletoassess whetherthedevelopment,marketingandimplementationof tourism activities are pertinent to their marketing and operational approaches, as it’s essential to perceive the varioustypesofbehaviourateverypoint
Onlybyknowingthefundamentalsoftouristbehaviour,as wellasknowinghowtoobserveandmeasurethem,wecan effectivelyplanoffersandothersalesactivitiesintourism. Thetheoreticalbasisisveryimportantinempiricalresearch ormeasurementoftourismbehaviour,asitalsoshowsthe conceptstobemeasuredand,inmanycases,howtomeasure them.
Thispaperisbasedonareallifeproblem,facedbyseveral touristsandbusinessesinvolvedintourism.Iftheproblemis solved and their actions are clubbed collectively, it can
producephenomenalresultsandleadtoenormousprofits. Also after studying a few papers, we realised that major researchhasbeendoneontouristrecommendationsystems ratherthantouristbehaviouranalysis.Also,researchdone on tourist behaviour analysis includes more information regarding the tourist attraction than the tourists themselves. So, weaim to provide a crystal clear analysis about the behaviour of the tourists. Due to the COVID 19 crisis, the tourism industry has been facing a lot of repercussions. The pandemic has a huge impact on the tourismindustryduetotheresultingtravelrestrictionsas wellasslumpindemandamongtravellers.
Weaimtoanalysetouristsbehaviourbasedonthelocations and places they have visited so far, to identify tourist interests,tourismdemographicsandtoplanfuturetourism demands.Itsupportsstrategicdecision makingintourism destinationmanagement.Wearegoingtomakeuseofgeo taggedlocatedinformationavailableoncommunitywebsites like Tourpedia for datasets. Also we would structure the touristdemographicdataforallthelocationsinthevicinity. Make geographical clusters to identify popular tourist locationsfromtouristinterests.Constructatimeseriesdata to show the number of tourists at a particular spot throughouttheyear.
Thepaperisstructuredas Section2presentstheLiterature Review,Section3presentstheData setDescription,Section 4 presents the Methodology and Section 5 presents the Conclusion
Inpaper[1],adesignscienceresearch(DSR)methodology wasadopted,wherethesevendesignguidingprinciplesof Hevner et al. [2] are used to design, evaluate and communicatethesolution.AsdefinedbyMarchandSmith [3], design artefact is specified as a method designed to processandanalysesocialmediabigdata,suchasgeo tagged photos and geo located information, together with their joined personal and workflow, to support destination management organisations (DMO’s) strategic analyzing withinthecontextofTouristdestinationmanagement.
Authors of the paper [4] propose P DBSCAN, a new density based clustering algorithm based on DBSCAN for analysisofplacesandeventsusingacollectionofgeo tagged photos. It is similar to DBSCAN for analysis of places and events using a collection of geo tagged photos. Representative historic images were found in the city and
Research Journal of Engineering and Technology (IRJET)
Volume: 09 Issue: 04 | Apr 2022 www.irjet.net
countryscalesincombiningcoordinatesofgeo taggedphotos with content based and textual analysis using Mean Shift algorithmbasedonkernel densityestimationforclustering.
The paper [5] presents a framework to identify the interestsoftouristsbyintegratinginformationcarriedbythe geo tagged photos shared on social media websites. Such strategyisexpectedtoprovidesustainabletrackingonpoint of interest (POIs) updated by tourists and pick the best representativephotostakenbythem.Theperformanceofthe model wasevaluatedbyconductingacasestudyusingthe geo taggedphotostakeninHongKong.
The authors of the paper [6] describe tourist behavior mining fromanalyzing photo content by usinga computer deep learning model. 35356 Flickr tourist’s photos are identifiedinto103scenesandanalyzedbyResNet 101Deep learning model. Tourist’s cognitive maps with diverse perceptualtopicsarevisualizedbythecreatorsagreeingto photographicgeologicaldata.Statisticalanalysisandspatial analysis(byusinghierarchicalclusteringanalysisandANOVA (analysis of variance)) are used for analyzing tourist behavior.
The authors of paper [7] presented a tourist behavior analysissystembasedonadigitalpatternoflifeconcept.The digitalpatternoflifeextractstouristbehaviorcomponentsin aconvenientformforanalysisandisbasedonanontological approach,whichallowstotaketourist,cityandPOIcontext informationintoconsideration.Digitalpatternoflifeprovides variousconvenientrepresentationofthetouristregardlessof sourceselection.Changesoftouristactionscanbeviewedina specific time window, since the digital pattern of life informationisstoredwiththetimereference.
The paper[8]proposea mobileapplication,whichwill take the user’s interest and recommend attractions, restaurants, and hotels. The system is trained using the dataset of Trip Advisor. The clustering of the prepared dataset is done utilizing K modes clustering which is an unsupervised learning calculation. Convolutional Neural Networksisusedtoreverseimagesearchwhichisdonefor thedatasetcreatedbyfragmentingimagesfromGoogle.After this, the application received the data in the JSON format fromtheMySQLDatabaseusingPythonFlaskServer.
The work described in paper [9] propose a framework containinganimprovedclustermethodandmultipleneural networkmodelstoextractrepresentativeimagesoftourist attractions. A novel time and user constrained density joinableclustermethod(TU DJ Cluster)wasproposedbythe authorwhichwasspecifictophotoswithsimilargeo tagsto detect place relevant tags. Then there was merging and extendingoftheclustersaccordingtothesimilaritybetween pairsoftagembedding’s,astrainedfromWord2Vec.
Basedontheclusteringresult,theyfilternoiseimageswith Multilayer Perceptron and a single shot multibox detector
2022,
e ISSN: 2395 0056
p ISSN: 2395 0072
model, and further select representative images with the deeprankingmodel.TheauthorsselectedBeijingasthestudy area.
The authors of paper [10] presented an approach for exploringtourist’sbehaviorbasedontheextracteddataset from geo tagged photographs. The creators changed the dataset to a reasonable format and connected k mean clusteringtoclusterthediversetourists’behavior.Afterthat, thetourist’sbehaviorofeachcluster,particularlybehavior regarding interesting attractions, was analyzed by factual test.
The paper [11] presents a framework based on distributedMap/Reducetocarryoutresearchandanalysis of the flow behavior of tourists, with better efficiency and scalability.ABigDataAnalyticsplatformwasusedfor this papertoanalyzethetrackeddataoftourists’mobilephone, find out the behavior patterns of tourists, and design an analysis of the tourist flows based on the traditional data warehouse, Hadoop cluster and the database of My SQL, whichincludesthreemodules.
Theworkdescribedinpaper[12]proposedanoriginal approach to characterize daily behaviors of tourists by analyzingsequencesofplacesvisitedduringadaybyeach touristbasedongeo taggedandtime relatedinformationleft by tourists by posting their photographs on photosharing websitesandtwitteralso.TheauthorsofthishadusedRwith TraMineR6packagethatisbasedontheNeedleman Wunsch algorithmasoptimalmatching.
The paper [13] uses sequential patterns of tourist activitiesandlocationsfromsocialmedia’sasmainsourceof behavior data. The Convolutional Long Short Term Deep Learning method is used for prediction of the expected location. The proposed method combines Convolutional Neural Network (CNN) with Long Short Term Memory (LSTM). Theauthors of this paper state that theirsolution outperformsotherneuralnetworkmodelswhenevaluating withtheaccuracyandlossmetrics.
For user’s profiles and places reviews database, the Tourpediadatasethasbeenused.
Therearemainly4categoriesofplaces:
A]Accommodation
B]Attraction
C]PointofInterest
Each tuple has the following entries address, id, latitude, longitude,location, name,original idand reviews.Forour model,weareusing26928datasetsofParis.
Impact Factor value: 7.529 | ISO 9001:2008 Certified
Volume: 09 Issue:
www.irjet.net
and Technology (IRJET)
e ISSN: 2395 0056
p ISSN: 2395 0072
Clusteringisthetaskofgroupingasetofobjectsinsucha waythatobservationsinthesamegrouparemoresimilarto eachotherthantothoseinothergroups.Itisoneofthemost popularapplicationsoftheUnsupervisedLearning(Machine Learning when there is no target variable). Geospatial analysisisthe fieldofDataSciencethatprocessessatellite images, GPS coordinates, and street addresses to apply to geographicmodels.

Firstofall,wewillbeimportinglibraries Fordata(pandas, numpy), For plotting (matplotlib and seaborn), For geospatial(foliumandgeopy),Formachinelearning(scipy), Fordeeplearning(minisom).Thenwewillreadthedatainto apandasDataframe.
Here,inordertodefinetherightk,weusetheElbowMethod [15]: plotting the variance as a function of the number of clusters and picking the k that flats the curve. Theelbow methodis aheuristicused indetermining the number of clusters in a data set. The method consists of plotting theexplained variationas a function of the number of clusters,andpickingtheelbowofthecurveasthenumberof clusterstouse.Thesamemethodcanbeusedtochoosethe numberofparametersinotherdata drivenmodels,suchas thenumberofprincipalcomponentstodescribeadataset.


K Meansalgorithm[14]aimstopartitiontheobservations intoapredefinednumberofclusters(k)inwhicheachpoint belongs to the cluster with the nearest mean. It starts by randomlyselectingkcentroidsandassigningthepointsto the closest cluster, then it updates each centroid with the meanofallpointsinthecluster.Thisalgorithmisconvenient whenyouneedthegetaprecisenumberofgroups,andit’s moreappropriateforasmallnumberofevenclusters.
Peopleoftentendtotravelfromonelocationtoanother locationandexplorenewthings,andintheirjourney,they need to know all the popular places around them so that theydon’tmissoutonany.Soforthosepeoplewhoneedto knowallthedenselypopulatedareasaroundthem.inputto this model is the current location and the radius of the search. We use FourSquare API, that gives all the popular placesaroundagivenlocationandpythontovisualizethis stuff.
Model Development: First of all, we will be importing libraries For data (pandas, numpy), For creating maps (folium),Forretrievinginformation(requests).Thenwewill be converting address to coordinates and also converting JSON to Dataframe. Then we will be reading the current location from the user and coverting it to the coordinates followedbyfetchingdatafromtheFourSquareApi,theresult isaJSONdata.
Then we will be cleaning the data and converting it to dataframe.Ourdatawillbevisualizedasfollows:
Fig 2:K meansalgorithm Fig 3:ElbowMethodof Engineering and Technology (IRJET)
Volume: 09 Issue: 04 | Apr 2022 www.irjet.net
Belowoutputdepicts a]Nameofthelocation;b]Whatisthe category, it is famous for; c] Address of the location; d] Distancefromcurrentlocation.Alsotheredmarkershows the current location, whereas blue markers show the popularlocationsnearby.


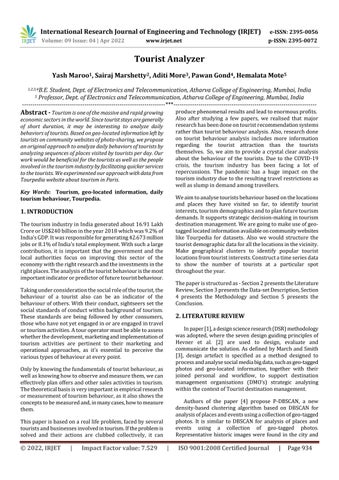
Timeseriesisdefinedasasetofrandomvariablesordered with respect to time. Time series are studied both to interpret a phenomenon, identifying the components of a trend,cyclicity,seasonalityandtopredictitsfuturevalues. For time series, we have trend analysis which determine whether it is linear or not as most models require this information as input, outliers detection and seasonality analysis.
Firstofall,wewillbeimportinglibraries Fordata(pandas, numpy), For plotting (matplotlib), For outliers detection (sklearn). Then we will read the data into a pandas Dataframe
Trend Analysis: The trend of the time series can be estimatedusingaparametricapproachbecauseitproduces smoothtrendcurvesrepresentingtheoveralltendency,and allowing for future trends to be computed for prediction purposes. Popular fitting functions include linear, exponential and quadratic types [16]. The trend is the componentofatimeseriesthatrepresentsvariationsoflow frequencyinatimeseries,thehighandmediumfrequency

value:
e ISSN: 2395 0056
p ISSN: 2395 0072
fluctuationshaving been filtered out. The objective of this analysisistounderstandifthereisatrendinthedataand whetherthispatternislinearornot.Thebesttoolforthis jobisvisualization.
Fig -6:Visitors
Nextwewanttoseewithintheplotsomerollingstatistics such as: Moving Average: the unweighted mean of the previous n data (also called “rolling mean”) and Bollinger Bands: an upper band at k times an n period standard deviationabovethemovingaverage,andalowerbandatk times an N period standard deviation below the moving average.
Thisisusefulinmodeldesignasmostofthemodelsrequire that you specify whether the trend component exists and whetheritislinear(alsosaid“additive”)ornon linear(also said“multiplicative”).
OutliersDetection:Anoutlier[17]isadatavaluethatliesin thetailofthestatisticaldistributionofasetofdatavalues.

The objective of thissection isto spot outliers and decide how to handle them. In practice, traditional deterministic methods are often used, like plotting the distribution and labelasanoutliereveryobservationshigherorlowerthana chosenthreshold.
|
9001:2008
Fig 8:OutliersdetectionResearch Journal of Engineering and Technology (IRJET)
Volume: 09 Issue: 04 | Apr 2022 www.irjet.net
Firstly,wewriteafunctiontoautomaticallydetectoutliersin a time series using a clustering algorithm from the scikit learnlibrary:one classsupportvectormachine,itlearnsthe boundaries of the distribution (called “support”) and is therefore able to classify any points that lie outside the boundaryasoutliers.Withthisfunctionwewillbeableto spotoutliers
We then remove them because time series forecasting is easierwithoutdatapointsthatdiffersignificantlyfromother observations, but by removing these points can deeply changethedistributionofthedata.Sotoexcludetheoutliers, themostconvenientwaytoremovethemisbyinterpolation. So we write a function to remove outliers after they are detected by interpolating the values before and after the outlier.
SeasonalityAnalysis:Theseasonalcomponentisthatpartof the variations in a time series representing intra year fluctuationsthataremoreorlessstableyearafteryearwith respecttotiming,directionandmagnitude.
The objective of this last is to understand what kind of seasonality is affecting the data (weekly seasonality if it presentsfluctuationsevery7days,monthlyseasonalityifit presentsfluctuationsevery30days,andsoon).
In particular, when working with seasonal autoregressive models we must specify the number of observations per season.Thereisasuperusefulfunctionintothestats model library that allows us to decompose the time series. This functionsplitsthedatainto3components:trend,seasonality andresiduals.

2022,
e ISSN: 2395 0056
p ISSN: 2395 0072
Next we did Time Series forecasting. Time Series Forecastingusespastdatatopredictthefuture.Meanwhile, causal variable forecasting tries to find the relationship betweenthedesiredvariableandotherexternalvariables
Time series forecasting is a flexible technique. Its implementation does not require much data, and it is capableofcatchingfluctuations.Themainlimitationofusing timeseriesforecastingisthelackofempiricaljustifications


However,timeseriesforecastingdoesminimizetheneedfor futureestimationsanddatacollection[18].
Inthispaperwehavedemonstratedoureffortstobuilda tourist analyzer model using Paris dataset. We propose to cluster the dataset intro clusters and then compute the popularlocationforeachgeo taggedclusters.
We have presented the three techniques for tourist analyzer geographical data clustering, popular location identification and time series modelling, and have gone throughtherelatedworksoftheauthors.Wehavepresented a method to extract, rank, locate and identify meaningful tourist information from unstructured big data sets for supportingtheDMOstrategicdecision making.Theresults showsthatsuchasystemishelpfulforuserstofindtourism destinationsofinterests.
Inourfutureworkwewillconcentrateontheevaluation approaches,runtimeoptimization,databaseintegrationand differentanalyticaltasks.
[1] Finsterwalder, Jörg & Laesser, Christian. (2013). Segmentingoutboundtouristsbasedontheiractivities: Toward experiential consumption spheres in tourism services?.TourismReview.68.21 43.10.1108/TR 05 2013 0023.
[2] Hevner,A.,March,S.,Park,J.,&Ram,S.(2004).Design ScienceinInformationSystemsResearch,MISQuarterly 28(1),75 105
[3] March,S.&Smith,G.(1995).DesignandNaturalScience ResearchonInformationTechnology.DecisionSupport Systems,15,251 266
Factor value: 7.529 | ISO 9001:2008 Certified
Fig -11:Time SeriesForecastingInternational Research Journal of Engineering and Technology (IRJET)
Volume: 09 Issue: 04 | Apr 2022 www.irjet.net
[4] Kisilevich, S., Mansmann, F., & Keim, D. (2010). P DBSCAN: a density based clustering algorithm for exploration and analysis of attractive areas using collectionsofgeo taggedphotosBT Proceedingsofthe 1st International Conference and Exhibition on ComputingforGeospatialResearch&Applicat.1 4.
[5] Zhong,L.,Yang,L.,Rong,J.,&Kong,H.(2020).ABigData Framework to Identify Tourist Interests Based on GeotaggedTravelPhotos. IEEEAccess, 8,85294 85308. https://doi.org/10.1109/ACCESS.2020.2990949
[6] Zhang, K., Chen, Y., & Li, C. (2019). Discovering the tourists’ behaviors and perceptions in a tourism destinationbyanalyzingphotos’visualcontentwitha computer deep learning model: The case of Beijing. Tourism Management, 75(November), 595 608. https://doi.org/10.1016/j.tourman.2019.07.002
[7] S. Mikhailov, A. Kashevnik and A. Smirnov, "Tourist Behaviour Analysis Based on Digital Pattern of Life," 20207thInternationalConferenceonControl,Decision andInformationTechnologies(CoDIT),2020,pp.622 627,doi:10.1109/CoDIT49905.2020.9263945.
[8] Parikh,V.,Keskar,M.,Dharia,D.,&Gotmare,P.(2018).A TouristPlaceRecommendationandRecognitionSystem. ProceedingsoftheInternationalConferenceonInventive CommunicationandComputationalTechnologies,ICICCT 2018, Icicct, 218 222. https://doi.org/10.1109/ICICCT.2018.8473077
[9] Han, S., Ren, F., Du, Q., & Gui, D. (2020). Extracting representativeimagesoftouristattractionsfromflickr bycombininganimprovedclustermethodandmultiple deep learning models. ISPRS International Journal of Geo Information, 9(2), 1 22. https://doi.org/10.3390/ijgi9020081
[10] Arthan, S., Jandum, K., & Tamee, K. (2021). Exploring Tourist Behavior from Social Media Using Geotagged Photographs. 2021 Joint 6th International Conference on Digital Arts, Media and Technology with 4th ECTI NorthernSectionConferenceonElectrical,Electronics, Computer and Telecommunication Engineering, ECTI DAMT and NCON 2021, 285 288. https://doi.org/10.1109/ECTIDAMTNCON51128.2021. 9425761
[11] Lu,D.D.,&Zhong,Y.De.(2016).Atouristflowsanalysis system based on phone big data. Proceedings of 2016 IEEE International Conference on Big Data Analysis, ICBDA 2016 https://doi.org/10.1109/ICBDA.2016.7509822
[12] Loiseau, T. J., Djebali, S., Raimbault, T., Branchet, B., & Chareyron,G.(2017).Characterizationofdailytourism behaviorsbasedonplacesequenceanalysisfromphoto sharingwebsites. Proceedings 2017IEEEInternational
2022, IRJET
e ISSN: 2395 0056
p ISSN: 2395 0072
Conference on Big Data, Big Data 2017, 2018 Janua, 2760 2765. https://doi.org/10.1109/BigData.2017.8258241
[13] Kanjanasupawan,J.,Chen,Y.C.,Thaipisutikul,T.,Shih,T. K.,&Srivihok,A.(2019).Predictionoftouristbehaviour: Tourist visiting places by adapting convolutional long short Term deep learning. Proceedings of 2019 International Conference on System Science and Engineering, ICSSE 2019, 12 17. https://doi.org/10.1109/ICSSE.2019.8823542
[14] K. P. Sinaga and M. Yang, "Unsupervised K Means ClusteringAlgorithm,"inIEEEAccess,vol.8,pp.80716 80727,2020,doi:10.1109/ACCESS.2020.2988796.
[15] D.Marutho,S.HendraHandaka,E.WijayaandMuljono, "TheDeterminationofClusterNumberatk MeanUsing Elbow Method and Purity Evaluation on Headline News,"2018InternationalSeminaronApplicationfor TechnologyofInformationandCommunication,2018, pp.533 538,doi:10.1109/ISEMANTIC.2018.8549751.
[16] Cooray,T.M.J.A.(2008).AppliedTimeSeries:Analysis andForecasting.AlphaScienceIntlLtd.Oxford,UK.
[17] H.C.MandhareandS.R.Idate,"Acomparativestudyof cluster based outlier detection, distance based outlier detection and density based outlier detection techniques," 2017 International Conference on Intelligent Computing and Control Systems (ICICCS), 2017,pp.931 935,doi:10.1109/ICCONS.2017.8250601.
[18] El Shafie A, Jaafer O, Seyed A. Adaptive neuro fuzzy inferencesystembasedmodelforrainfallforecastingin KlangRiver,Malaysia.IntJPhysSci2011;6:2875 2888.
Impact Factor value: 7.529 | ISO 9001:2008 Certified