Performance Analysis of Coal Operated Thermal Power Generation Companies

***
Abstract; Withever increasingdemandforelectricityduetoeconomicanddemographicexpansion,thepowerindustryhas becomehighlyvital.Itis thesectorresponsibleforconvertingdiverseenergyresourcessuchasfossil fuels,coal,natural gas, and other unconventional resources into cleaner electric energy. Thermal power plants run on coal account for a significant portionofIndia'senergygeneration,witharemarkablecumulativeyearlygrowthrate.
Thepurposeofthisworkistoexaminetheefficiencyofcoal firedthermalpowerplants,bothpublicandcommercial, using a nonparametric Data Envelopment Analysis technique. It outlines the important criteria to consider while evaluating these firms' success. The investigation will aid in understanding of industry best practices for achieving peak performance. The study emphasizes aspects influencing the efficiencies of various units in order to assist in enhancing the efficiency of inefficient units. It also recommends regulatory measures to increase the efficiency of public sector power producing businesses.
Keywords: CRS, VRS, Efficiency, Data Envelopment Analysis, Slack
Introduction:
After India got free from British rule, the national and state governments have operated and regulated the generation, distribution, and transmission of electric energy. There were several state and national players with vertical integration to deliver countrywide electricity. In 1991, India implemented liberalised laws and implemented several changes in the power industry in order to attract investment, revitalise the sector via restructuring, and foster market competition in order to increaseproductivity.”
Sincethen,theelectricenergyindustryhasexpandedataremarkablepace.TheIndiangovernment'spolicy adjustmentsand restructuringmeasureshaveaidedindustryinitsrevitalization.Foreigndirectinvestment ruleshaveaidedinbringingmoney andskillstothepowerindustry.Asofthe end ofFebruary2015,India's powerindustryhasa ratedcapacityof261.007GW andproducedaround961.778BUfromMay”2020toFebruary”2021.In2013,IndiasurpassedJapanandRussiatobecomethe world's third biggest generator of power, with a 4.8 percent worldwide share in electricity output. In spite of its expanding importance, experimental studiesontheefficiencyofIndia'spowerindustrystand sparse,owingtoa paucityofnumberson factorinputsutilizedinthepowersector.
This study demonstrates the use of DEA (a non parametric rectilinear programming technique for assessing relative efficiency) to Indian Radiant Power Generation Companies over the years 2020 2021. Based on their performance and appropriatecomparisons,theDEA providesdifferentefficiency ratingstoorganizations.Thegoalofthisresearchistolookat theefficienciesofvariouspowergenerationcompanies,aswellasthefactorsthatleadtoinefficiencyinthosecompanies.
Indian Power Sector:
AfterIndia'sindependence,theelectricalsupplyactof1948broughtpowergeneration,delivery,anddistributionintheurban and rural sectors under government control. At the national and state levels, the Central Power Authority (CEA) and State Electricity Boards (SEBs) stood formed to plan along with implementation of electricityplanning.Thisalsoservedasa basis for establishing and running central power plant benefits of public segment companies. Along with this it started providing certificatestoproducealongwithdispensepowercertainspecificareasestablishedStateElectricityBoards.
Energyproductionwhichisanimportantaspectineverynation'sfinancialsuccessandIndiaisnoexception. Theemergence
Pranav Shivagaje1 , Biplab Datta , Aqib Yousuf 3 , Tushar Bhakte4 Vinod Gupta School of Management, Indian Institute of Technology Kharagpur, India.Volume: 09 Issue: 04 | Apr 2022 www.irjet.net
e ISSN:2395 0056
ISSN:2395 0072
ofnewindustrieshasresultedinwidespreadusageofelectricityinallsectors,withdevelopmentandimprovementevidentin consecutive five year plans. Power utility rose 50 times in 48 years, from 1813 MW in 1951 to 89190 MW in 1999, while generationvolumeexpanded80times,from5.2billion units to421 billionunits. Withadvancements intechnical equipment thatusespower,percapitauseofelectricityclimbedfrom15kWhto338kWh.Sinceindependencethroughthebeginningof thetwenty firstcentury,approximately80%oftheruralsectorhasbeenelectrified.IthasalsoreachedtheNorthernEastern sector.
1. Literature Review:
Inthepast,researchersuseda rangeofproductivityevaluationmethodologies toanalysetheefficiencyof energy generating firms.”Charnes (1978) and Banker et al. (1984) were the first to use empirical methodologies such as data envelopment analysistomeasuretheefficiencyofproductionschemeswiththehelpofvarious divisional statistics. Fareet al. (1985) were the first to compare the efficiency of private and public electric utilities using DEA method, discovering that public services weremoreproductive.From2005to2010,AlirezaFallahi,RezaEbrahimi,andS.F.Ghaderi(September2011)usedDEAstudy to assess the enactment of thirty two power electric production company models for assessment of productivities of those companies. The many representations have contributed towards a better understanding of both pure technical and scale efficiency.Thestudy'sconclusionscontributedintheimprovementofmanyorganizations’production,managementpractices, and policies. It also proved that technological advancements are not the major driver of increasing output; rather, low efficiencyisthekeyreasonoflowoutput.AlexanderVaninsky employed DEA in May 2007 to evaluate the productivity of electric power generating enterprises in the United States. From 1991 to 2004, he evaluated the relative productivity of severalbusinessesandestimatedthegoalinputandproductionfiguresforthoseyears.In2010,heutilizedauto regressionto estimatetheoutputandinputvaluesrequiredaimedattheoptimaloperationofvariousenterprisesinordertoachieve 100% efficiency.
The various models have aided in gaining a better understanding of both clean practical and scale productivity. The study's findings aided a variety of organizations in improving their production, management methods, and policies. It also emphasizedthattechnologydevelopmentsarenottheprimarysourceofrisingoutput;rather,lowproductivityistheresultof inefficiency.InMay2007,AlexanderVaninskymadeuseofDEAtoassesstheproductivityofelectricpowerproducingfirmsin theUnitedStates.Heexaminedtherelativeefficiencyofmanyfirmsoverafive yearperiod,from1991to2004,andcalculated the objective input and output numbers for each year. He used auto regression in 2010 to anticipate the input and output valuesneededfortheoptimalrunningofseveralbusinesses.Thetotalenactmentofprivatesegmentcompaniesissuperiorto theirpublicequivalents.
Tripta Thakura, S.G. Deshmukhb, and S.C. Kaushika (June 2005) made use of the non parametric method DEA with an intentiontocomparetheenactmentfornumerouspublicservicecorporationsinthecountry.Accordingtothefindings,many
Indian Figure1PercentageofdifferentsectorsinPowerGenerationEngineering and Technology (IRJET)
Volume: 09 Issue: 04 | Apr 2022 www.irjet.net
e ISSN:2395 0056
p ISSN:2395 0072
publicenterprisesemployahugequantityofworkerstoreducetheirworkforceinordertoboostefficiency.Anotherdifficulty thatthesefirmshadwasalackofcompetition,aswellasencouragementandincentivestoenhanceperformance.Manylarge utility companies were determined to be inefficient rather than improving efficiency with greater scale. They have also suggestedotherwaystoimprovethecountry'stariffandlabourpolicies.
Theinputandoutputvariablesconsideredforcalculatingrelativeunitefficiencyplayanimportantroleintheentirestudy.Itis critical todeterminethemajorvariablesrelatingtothe industrythat will beusedto evaluateperformance.Accordingtokey investigations in the power business, yearly power production is one among the most significant yield parameters, but fuel costsalongwithlabourexpensesforgeneratingareessentialinputcomponents.
2. Methodology:
2.1 Data Envelopment Analysis
Data Envelopment Analysis is utilized for calculating the efficiency of coal fired thermal power plants. The estimated productivitymetriciscomparativeinnature,indicatinghowallofthepowerplantsperformedin comparisontoallothersin India over the same time frame. The DEA doesn’t need a previous weighting of the significance of the Input and Output engaged into account. DEA method agrees us to compare the comparative efficiency of Decision Making Units used for multipleinput outputscenarios.TheDEAsimplycomparesbusinessestogreatestgeneratorsinthebusiness.Itisanextreme techniquethatbelievesifonebusinesswillachieveagivenstageofoutputusingspecifiedinputlevels,otherorganization’sof equivalentscaleshouldbeabletodotheidentically.
2.1.1
Constant returns to scale:
Every Decision Making Units is considered to be utilized at optimal measure, with no limitations on inputs or outputs. The scaleofoperationisseenhere.Thismodel (CCR)suggestsanisoquantreductionin inputsused toobtainthedesiredoutput (Farrell).WhendistinctDMUsfunctionatdifferentscales,thisapproachisinapplicable.
2.1.2
Variable returns to scale:
Thisrepresentationcanbeutilizedtogetaroundacontinuousreturntoscalemodel'sconstraint.Thevariablereturns to scale model (BCC), which can compute efficiency for rising, decreasing, or constant scales, as well as Farell and Fieldhouse's non diminishing returns model (1962). The notion of continuous returns to scale combines technological and scale efficiency. VariableReturntoScalerepresentationsdividestheproductivityin2parts1.Puretechnicalefficiency2.Scaleefficiency
“Therelationshipcanbeexplainedas”
“Technicalefficiency(CRS)=Scaleefficiency*Technicalefficiency(VRS)”
DEA Approach:
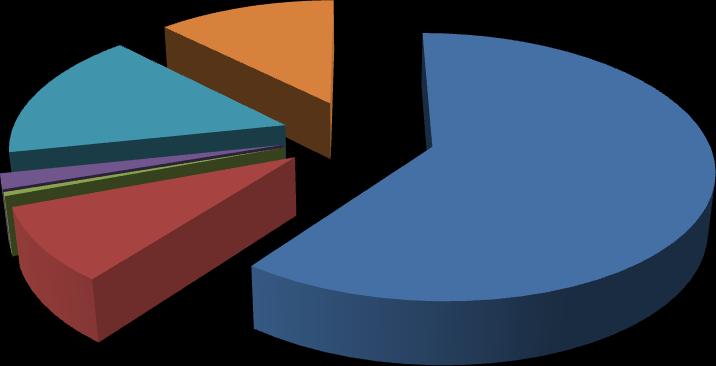
The technical productivities of various Decision Making Units are determined with the help of the Constant returns to scale (CRS)DataEnvelopmentApproachrepresentation.ThecomputationofDEAefficiencyscoresusingmathematical formulaeis detailedhere.Therectilinearprogrammingrepresentationwithspecificrestrictionsforcalculatingtheefficiencyofassociated DMUsforacertainoutputvariablesandaspecificinputvariablesareasfollows.
DMU’s: j = 1, 2 ….to n
Output variables: yrj, r = 1,2 ….to sInput variables: xij, i = 1,2 . . to
Here the weightage for the outputs and inputs, are ���� and ��i respectively, where the input and output values, and all weightages,areconsidered tobepositive. The weightages ����and ��iforall Decision MakingUnitsstay totallydecidedbythe outputandinputdataofallDecisionMakingUnitsintheclusterofdata.Asaresult,the weightagesassignedtoeveryDecision MakingUnitisthosethatoptimizetheproductivitymarkofthefocalDMU.
© 2022, IRJET | Impact Factor value: 7.529 | ISO 9001:2008 Certified Journal | Page846
Volume: 09 Issue: 04 | Apr 2022 www.irjet.net
e ISSN:2395 0056
p ISSN:2395 0072
3.1 Benchmarks:
The Decision Making Units that are on the proficient boundary serve as models of further Decision MakingUnits as well as aimed at the selves. Best practices remain claimed chosen to be followed by benchmark DMUs. Each inefficient DMU can be benchmarkedbyoneormoreDMUs.Inthiscase,DMUmustuseacombinationofalltargetDecisionMakingUnitsandshadow administration practices trailed by standard Decision Making Units. It must decrease input or grow the output in fraction to thestandardDecisionMakingUnitsinordertobecomeproductiveandtouchtheproductivityboundary.
3.1.1 Input Variables:
Installed Power Generation Capacity:
Total installed capacity must be included in the input variable since it involves a considerable capitalexpenditurein equipmentandapparatus.
Fuel/ Raw material Expenses:
Becausefuelisthemajorsupplyusedtogenerateelectricityinthermalpowerplants,itisacriticalinputvariablefor productivityanalysis.
Employees Expenses:
Anotherkeycomponentinpowergeneratingistheamountoflaborusedperunitproduced.
3.1.2 Output Variables:
Power Generated:
PLF(%)= EnergygeneratedDuringPeriod *100 Totalcapacity
* Totalhoursunderreview
PLF is used to calculate a plant's volume operation. It is a amount for a plant's production in relation towards the highest outputitwillbeattain.ThePLFisconstantlylessercomparedto theonesinceitcancertainlynotgeneratemorethanitsfull capacity.Alowloadfactorpowerplantisregardedtobelessefficientthanahighloadfactorpowerplant.Asaresult,ahigher loadfactorproducesmoreunitsofenergyatalesserexpenseforeachunitofpower.
Producedpowerwillaidtogaugetheproductivityofpowerproducingorganizations.Itwillbehelpustogauge
Sales revenues:”
Becauseelectricityproductionhassuchhighprices,it'svitaltofigureouthowmuchmoneymaybemadebyrecoupingthose coststhroughsales.
Factor value:
9001:2008
09 Issue: 04
Apr 2022
Data:
(CRS)
APGENCO 7671.1 5189.6 82987.2 34883.36 138625
APL 1571.8 8600.1 61557.8 43782.39 107145
CGPL 3667.25 500.2 4556.38 1562.62 7716
DVC 10443.1 6291 75392 27849.79 116062
GSECL 5146.5 5658.61 37397.5 14590.74 61534
HPGCL 2093.4 3160.1 61630.1 13052.13 70372
JPL 610.2 1001 4831.3 8208.18 24569
JSWEL 890.1 2061 36779 14606.69 86888
KPCL 7358.2 2847.91 46361 15856.49 65487
MAHAGENCO 9100.37 9071 108221.1 40289.85 164238
MPL 319.8 1051 13307.6 6303.68 23381
MPPGCL 3981.07 3846 4328.26 16213.77 53047
NLC 22351 2991 923.2 19987.98 59674
NTPCLtd 47675.5 37042.24 465104 233266.54 726441
RRVUNL 1858 4293.9 71792 24239.03 84015
TATAPCL 6210.2 2021.2 41442.9 9411.88 86905
UPRVUNL 5534.88 4924 54891.6 25874.49 79196
WBPDC 3984.87 4421 59549.7 20769.07 80213
2395 0056
ISSN:2395 0072
Efficiencies:
2
APL
1.00000
CGPL 0.49615
DVC 0.57321
GSECL 0.40211
HPGCL 0.56758
JPL
1.00000
09 Issue: 04
Apr 2022 www.irjet.net
1.00000
KPCL 0.71945
MAHAGENCO 0.57233
MPL 0.98832
NLC
01.000000
NTPCLtd. 0.77216
RRVUNL 0.79728
TATAPCL
01.000000
UPRVUNL 0.64264
WBPDC 0.59898
ISSN:2395 0056
ISSN:2395 0072
Desk shows that productivity marks for several Decision Making Units determined with the help of CRS DataEnvelopment Approach method. The emphasized rows represent productive Decision Making Units that make the best with the help of specific inputs for chosen outputs. Decision Making Units with productivities not more than one are wasteful which implies they can cut their input consumption by a specific fraction for the identical output data in order to become productive and achieveproductivitymarkpointequalto1.Withanefficiencyscoreof0.98832,
Slack table:
Table12ConstantReturnstoScaleDEAapproachtocalculateSlackvalues
INR)
(MWh)
INR)
1 APGENCO 4318.4341 0.00000 29693.353 0.00000 0.00000
2 APL 0.00000 0.00000 0.00000 0.00000 0.00000
3 CGPL 841.92947 0.00000 0.00000 156.30439 0.00000
4 DVC 4063.7015 0.00000 5483.3823 0.00000 0.00000
5 GSECL 0.00000 0.00000 0.00000 3541.7707 0.00000
6 HPGCL 361.91598 0.00000 6871.3653 0.00000 0.00000
7 JPL 0.00000 0.00000 0.00000 0.00000 0.00000
8 JSWEL 0.00000 0.00000 0.00000 0.00000 0.00000
9 KPCL 4202.7512 0.00000 12362.707 0.00000 0.00000
10 MAHAGENCO 2511.8677 0.00000 9729.4537 0.00000 0.00000
11 MPL 0.00000 0.00000 291.50231 0.00000 4641.54562
12 MPPGCL 0.00000 0.00000 0.00000 0.00000 0.00000
13 NLC 0.00000 0.00000 0.00000 0.00000 0.00000
14 NTPCLtd. 19601.1131 0.00000 203401.171 0.00000 0.00000
15 RRVUNL 0.00000 0.00000 0.00000 0.00000 53201.5211
16 TATAPCL 0.00000 0.00000 0.00000 0.00000 0.00000
17 UPRVUNL 1639.97208 0.00000 18899.0551 0.00000 0.00000
18 WBPDC 919.63096 0.00000 11659.302 0.00000 0.00000
AbovedeskdepictsvariouslevelsofseveralDecisionMakingUnitswithproductivityscoresnotmorethanone.Slackvariable dataforMAHAGENCOisasfollows:
Volume: 09 Issue: 04 | Apr 2022 www.irjet.net
Input slack variables:
Technology
e ISSN:2395 0056
ISSN:2395 0072
EmployeesBenefit=2410.8679RawMaterial=9729.4535 The value of Input slack variables suggests that MAHAGENCO can reduce its inputconsumptionbythosemanyunitsto makeitefficiencyscorefrom0.5417to1.
Output Slack variables:
Theoutputslackvariableof MPL istakenintoconsiderationSalesRevenues(millINR):4638.54563 The figure indicates that in order to attain the efficient frontier, this MPL must lower input resource consumption of Raw Materialexpendituresby289.5023millINRwhilealsoincreasingoutputvariablesalesrevenue by4638.54563.
Target Data Table
Table:
Efficient Input Target
Efficient Output Target
APGENCO 2398.51561 4460.76881 43020.57265 34772.36000 138625.00000
APL 1618.91000 8580.10000 61557.91000 43782.37000 107144.40000
CGPL 981.63112 248.18175 2260.70451 1708.91439 7717.50000
DVC 1919.17623 3605.49793 37741.52486 27849.68000 116060.00000
GSECL 2071.46252 2275.44720 15037.68139 18122.52085 61533.30000
HPGCL 831.29409 1793.62461 28118.04044 13052.13000 70372.20000
JPL 609.31000 1001.00000 4831.41000 8208.18000 24568.80000
JSWEL 889.10000 2061.00000 36778.10000 14606.67000 86888.50000
KPCL 1101.20809 2049.90519 21100.49328 15856.49000 65487.04000
MAHAGENCO 2801.53738 5193.07423 52207.43640 40289.85000 164237.62000
MPL 321.25904 1038.72115 12862.37797 6303.68000 28021.54563
MPPGCL 3979.16000 3846.00000 4328.26000 16213.75000 53046.63000
NLC 22351.00000 2991.00000 923.20000 19987.98000 59673.67000
NTPCLtd. 17216.75798 28601.3210 155746.0812 233266.54000 726441.20000
RRVUNL 1483.12700 3519.29947 57236.50040 24239.14000 137214.52126
TATAPCL 6211.40100 2032.31000 41442.90000 9411.88000 86904.80000
UPRVUNL 1916.88408 3265.65116 16372.81597 25874.47000 79196.31000
WBPDC 1463.28023 2651.54677 24006.56306 20769.16000 80213.00000
Factor value: 7.529
9001:2008
Volume: 09 Issue: 04 | Apr 2022 www.irjet.net
e ISSN:2395 0056
ISSN:2395 0072
Thegoaldeskshowsinputandoutputdatathateachdecision makingunitshouldaimforinordertoachievethe productivityboundary.ForMPL,itisclearthatthedataoftheinputsaremodifiedfromtheirpreviousdata.
Table:
1052 13407.6 6299.68 23381
12902.37788 6299.68000 27998.54564
To reach the efficient frontier, MPL must decrease input Workers profit to 321.15903 since its current value of 319.9, reduceMonitoredcapacityto1041.72116fromitscurrentvalueof1050,andreduceRawmaterialexpensesto12862.377 from its current value of 13307.5, while maintaining the output value of Generation at 6303.69 andincreasing Sales revenuesto28020.545fromitscurrentvalueof23382.
Optimum Lambda with Benchmark: Table:15 OptimallambdaswithtargetsmeasuredwiththehelpofCRSDEAmethod
APGENCO 3.613 2.813 JPL 0.810 JSWEL
APL 1.000 1.000 APL
CGPL 0.103 0.061 JSWEL 0.042 NLC
DVC 2.801 2.046 JPL 0.759 JSWEL
GSECL 2.025 1.818 JPL 0.168 JSWEL 0.036 NLC
HPGCL 1.026 0.310 JPL 0.726 JSWEL
JPL 1.000 1.000 JPL JSWEL 1.000 1.000 JSWEL
KPCL 1.607 1.188 JPL 0.419 JSWEL
MAHAGENCO 4.121 3.108 JPL 1.012 JSWEL
MPL 0.309 0.063 APL 0.247 JSWEL
MPPGCL 1.000 1.000 MPPGCL
NLC 1.000 1.000 NLC
NTPCLtd. 27.908 27.255 JPL 0.655 JSWEL
RRVUNL 1.714 0.016 APL 0.195 JPL 1.506 JSWEL
TATAPCL 1.000 1.000 TATA PCL
UPRVUNL 3.122 3.081 JPL 0.042 JSWEL
WBPDC 2.205 1.787 JPL 0.419 JSWEL
of Engineering and Technology (IRJET)
Volume: 09 Issue: 04 | Apr 2022 www.irjet.net
e ISSN:2395 0056
p ISSN:2395 0072
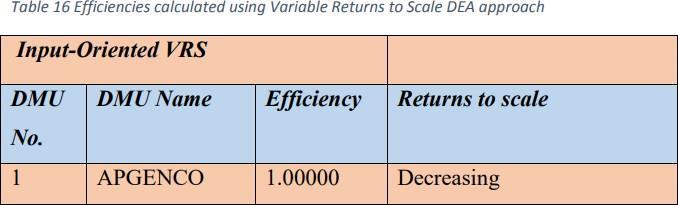
Theefficiencyscoreswithvariablereturnstoscale(BCCmodel)aredifferentfromtheconstantreturnstoscale. Thisiscalled puretechnicalefficiency.SomecompanieswithefficiencyscoreslessthanoneonCRShavebeen abletoachieveVRSefficiency score one. If UPRVNL becomes able to reduce its input or increase output by the suggested value it will soon become benchmarkforitselfandwillhaveefficiencyscoreofone.
Variable Returns to Scale (VRS) model: Efficiencies:
The efficiency scores with variable returns to scale (BCC model) differ from those with constant returns to scale. This is knownaspuretechnicalefficiency.SomeorganizationswithCRSefficiencyratingslessthanonehavebeen abletoobtainVRS efficiencyscoreone.
Volume: 09 Issue: 04 | Apr 2022 www.irjet.net
DVC 0.00000 0.00000 0.00000 321.80385 0.00000
GSECL 0.00000 0.00000 0.00000 0.00000 0.00000
HPGCL 314.05842 0.00000 6599.26243 0.00000 0.00000
JPL 0.00000 0.00000 0.00000 0.00000 0.00000
JSWEL 0.00000 0.00000 0.00000 0.00000 0.00000
KPCL 3359.53822 0.00000 5384.91437 0.00000 0.00000
ISSN:2395 0056
ISSN:2395 0072
MAHAGENC
O 0.00000 506.74470 0.00000 2619.53 0.00000
MPL 0.00000 0.00000 0.00000 0.00000 0.00000
MPPGCL 0.00000 0.00000 0.00000 0.00000 0.00000
NLC 0.00000 0.00000 0.00000 0.00000 0.00000
NTPC Ltd. 0.00000 0.00000 0.00000 0.00000 0.00000
RRVUNL 0.00000 0.00000 18412.0146 0.00000 16817.6514
TATA PCL 0.00000 0.00000 0.00000 0.00000 0.00000
UPRVUNL 0.00000 0.00000 0.00000 0.00000 3561.55623
WBPDC 0.00000 0.00000 0.00000 0.00000 6033.30360
APGENCO 7668.20000 5092.50000 82897.10000 34772.35000 138626.00000
1568.90000 8580.00000 61557.90000 43782.38000 107144.30000
CGPL 3667.26000 500.00000 4556.37000 1562.61000 7717.40000
DVC 7283.13187 4386.75663 52580.40419 28171.49385 116061.00000
GSECL 2433.05831 2675.11608 17679.73835 14590.75000 61533.20000
878.13251 1799.53347 28497.33488 13052.12000 70371.20000
JPL 610.30000 1000.00000 4831.40000 8208.19000 24567.80000
JSWEL 890.00000 2060.00000 36778.00000 14606.68000 86888.60000
KPCL 2313.11295 2195.51482 30354.87723 15856.48000 65486.04000
7332.90915 6803.31247 87202.56796 42909.36984 164238.6200
MPL 319.90000 1050.00000 13307.50000 6303.69000 23382.0000
MPPGCL 3981.06000 3845.00000 4328.25000 16213.76000 53045.6300
NLC 22350.00000 2990.00000 923.10000 19987.97000 59672.6700
NTPC Ltd. 47675.40000 37042.23000 465102.9000 233266.5300 726440.2000
RRVUNL 1734.42473 4006.06395 48568.12827 24239.04000 100831.6514
TATA PCL 6210.30000 2021.30000 41442.80000 9411.89000 86903.80000
UPRVUNL 4301.19272 3825.70354 42656.78877 25874.48000 82756.8662
WBPDC 2728.05768 3025.95698 40768.10912 20769.06000 86245.3036
Engineering
Volume: 09 Issue: 04 | Apr 2022 www.irjet.net
Optimal Lambdas with Benchmarks:
DMU Name
Technology
e ISSN:2395 0056
ISSN:2395 0072
Table:19 OptimallambdaswithreferencemeasuredwithCRSDEAmethod
Optimal Lambdas with Benchmarks
APGENCO 1.000 APGENCO
APL 1.000 APL
CGPL 1.000 BPSCL
DVC 0.688 JSWEL 0.095 MPPGCL 0.159 NLC 0.057 NTPC Ltd.
GSECL 0.210 JPL 0.369 JSWEL 0.409 MPPGCL 0.010 NLC 0.00 3 NTPC Ltd.
HPGCL 0.010 APGENCO 0.273 JPL 0.718 JSWEL JPL 1.000 JPL
JSWEL 1.000 JSWEL
KPCL 0.232 APGENCO 0.536 JPL 0.232 JSWEL
MAHAGENCO 0.731 JSWEL 0.141 MPPGCL 0.128 NTPCLtd.
MPL 1.000 MPL
MPPGCL 1.000 MPPGCL
NLC 1.000 NLC
NTPC Ltd. 1.000 NTPCLtd.
RRVUNL 0.219 APL 0.766 JSWEL 0.015 NTPCLtd.
TATA PCL 1.000 TATAPCL
UPRVUNL 0.032 APGENCO 0.845 JPL 0.049 JSWEL 0.073 NTPC Ltd.
WBPDC 0.023 APGENCO 0.424 JPL 0.514 JSWEL 0.038 NTPC Ltd.
Volume: 09 Issue: 04 | Apr 2022 www.irjet.net
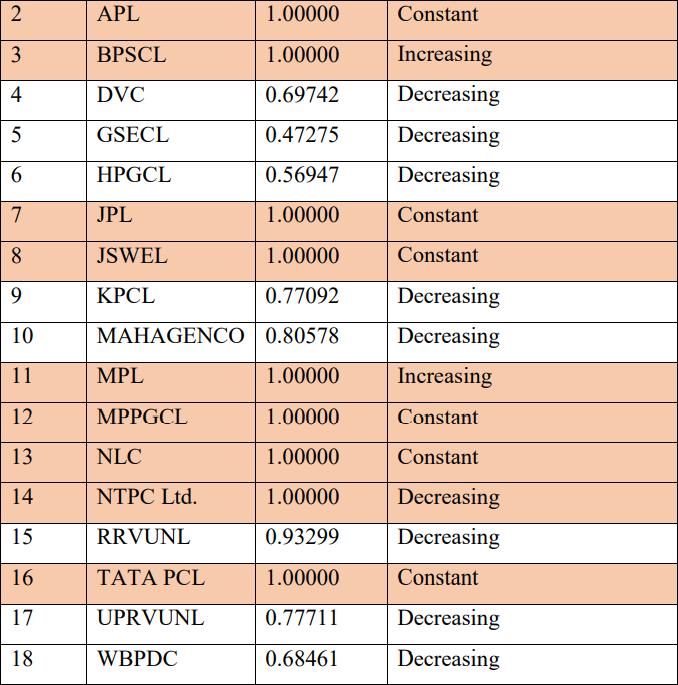
Scale Efficiencies:
Table:20 Scalesproductivities
VRSproductivityandCRSproductivitymarks
e ISSN:2395 0056
ISSN:2395 0072
1
APGENCO 0.87595 1.00000 0.875949
2 APL 1.00000 1.00000 1
3 CGPL 0.49616 1.00000 0.496164
4 DVC 0.57320 0.69742 0.821882
5 GSECL 0.40210 0.47275 0.85056
6 HPGCL 0.56757 0.56947 0.996661
7 JPL 1.00000 1.00000 1
8
JSWEL 1.00000 1.00000 1
9 KPCL 0.71944 0.77092 0.933223
10 MAHAGEN CO 0.57232 0.80578 0.710265
11 MPL 0.98831 1.00000 0.988306
12 MPPGCL 1.00000 1.00000 1
13 NLC 1.00000 1.00000 1
14 NTPC Ltd. 0.77215 1.00000 0.772154
15 RRVUNL 0.79727 0.93299 0.854529
16 TATA PCL 1.00000 1.00000 1
17 UPRVUNL 0.64263 0.77711 0.826946
18 WBPDC 0.59899 0.68461 0.874945
FirmswithaConstantReturntoScalemarkofnotmorethanoneandaVariableReturntoScalescoreofonehaveaConstant ReturntoScalemarkofnotmorethanoneandaVariableReturntoScalemarkofonebecauseofscaleproductivitymarkdata notmorethanone.
5. Key Findings:
Withlittleexceptions,thewholesegmentrunsonanproductivitymarkgreaterthan0.5.Themajorityofprivatesegmentfirms are determined to be on the efficient envelop, with a productivity mark of one. The primary cause which increased productivities was shown to be productivity resource usage, such as staff expenditures and fuel costs for electricity generation.MPListheonlyprivatesectorcompanywithatrueefficiencyscoreof0.988.
Whencomparedtocomparablemoderatecapacityrivals,NTPC,oneofIndia'smajorpublicsectorcompanies,hasanefficiency scoreof0.77215,whichisinefficient.Theefficiencyscoreoftwopublic sectorbusinesseswasjudgedtobeone.
To increase their efficiency, most businesses must lower their personnel and fuel costs. In order to achieve the efficient frontier,certainorganizationsmustsimultaneouslyenhancetheiroutputwhilereducingtheirinputs.
The high cost of gasoline shows that the limited resource is not being used to its maximum potential,andthattechnologyor manufacturingmethodsmustbeimprovedtoincreaseproductivity.
Whileweputvariousunitsonvariedmarks,organizationwithahugenumberofinstalledcapabilityget anproductivitymark ofone,indicatingthattheyarecapableofreaching puretechnicalefficiencyofone.
Factor value:
9001:2008
Volume: 09 Issue: 04 | Apr 2022 www.irjet.net
e ISSN:2395 0056
p ISSN:2395 0072
The organizations are found to be deficient in attaining scale productivities which has pure technical productivity mark one (Variable Return to Scale) but does not have Constant Return to Scale productivity score one. (BPSCL, APGENCO, NTPC, MPPGL). Allprivatesectorcompanieshavebeenabletoachievescaleefficiencyalsoequalstoone.
6. Conclusion:
Private enterprises use cutting edge technology and invest in expanding their production skills, and they have built a high performanceculture.Profitisthedrivingforcebehindthesebusinesses,andtheystriveforongoingprogress.Becauseofallof these variables, these businesses have been able to attain extremely high efficiency when compared to government run enterprises.
Because of the great efficiency of the private sector, the government should encourage private investment in electricity generation and create incentive measures to attract it. To attract international investors, the government must make significant efforts to enhance the business environment and minimise bureaucratic red tape. The promotion of FDI will also aid in technology transfer, which will not only increase production and overall system efficiency, but will also assist to minimiseoverallenvironmentaldegradationcausedbypoorproductivityandsubpartechnologies.
To attain targeted efficiency, the majority of public sector enterprises must minimise labour costs. Because of labour restrictions in the public sector, it is extremely difficult for the government to terminate low performing staff. This industry needs to encourage voluntary retirement plans for downsizing and embrace the high performance culture that exists in the private sector. Some governments, like as China, are using the divestiture option to help make decisions that are not influencedbyothergovernmentissues.
In this case, the government must encourage competition among diverse public sector firms. They have little motivation to outperform others, thus the government must devise policies that encourage competition among diverse public sector enterprises.
Theprimarygoal ofpublic sectorcompaniesistoprovideservices,butthiscanonlybeaccomplished throughinvestmentin better technology and capability development; therefore, in addition to providingservices, these companies should also be profit driveninordertobringnewadvancedtechnologiestomarket.
These organisations with significant installed capacities were able to obtain pure technical economies but not scale efficiencies,implyingthatgreaterdecentralisationandreorganisationofthesecompanieswillaidinbettermanagement.
As the government has proposed ultra mega power plants, it will be preferable to develop them through public private partnerships because private sector engagement helps to introduce high performanceculture and managerial skills, which improvesproductioncapacities.
Publicsectorenterprisescanadoptbestpracticesusedbyprivatesectorcompaniesorbringtechnology andexperiencefrom other nations via various treaties. Because of the increased focus on climate change and environmental preservation, all countries are eager to transfer clean energy production technology. As this involves large initial capital inputs, it should be supportedthroughdifferentincentivessuchasdoubletaxationavoidanceortaxbreaksforthefirstfewyears.
References:
Farrell,M.J.(1957).Themeasurementofproductiveefficiency. Journal of the Royal Statistical Society.Series A (General), 253 290.
Charnes, A., Cooper,W.W., &Rhodes, E. (1978). Measuring the efficiencyof decisionmakingunits. European journal of operational research, 2(6),429 444.
Charnes,A.,Cooper,W.W.,Golany,B.,Seiford,L.,&Stutz,J.(1985).FoundationsofdataenvelopmentanalysisforPareto Koopmansefficientempiricalproductionfunctions. Journal of econometrics, 30(1),91 107.
9001:2008


