International Research Journal of Engineering and Technology (IRJET)

Volume: 09 Issue: 04 | Apr 2022 www.irjet.net
e ISSN:2395 0056
p ISSN:2395 0072
International Research Journal of Engineering and Technology (IRJET)
Volume: 09 Issue: 04 | Apr 2022 www.irjet.net
e ISSN:2395 0056
p ISSN:2395 0072
1M. Tech (Remote Sensing &GIS), School of Geoinformatics, Remote Sensing Applications Centre U.P.
2Scientist SC, Land Use Survey Division, Remote Sensing Applications Centre, U.P.
3Scientist SE, Head, School of Geoinformatics, Remote Sensing Applications Centre, U.P.
***
Very fine solid or liquid particles which are present in the atmosphere are termed as Aerosols. Measurement of these aerosolsparticleswhichisdistributedinthecolumnoftheairfromtheearth’ssurfacetotheTopofAtmospherearecalled Aerosol Optical Depth (AOD) Space monitoring of AOD can serve as a potential human induced activity indicator which pollute the air. The Moderate Resolution Imaging Spectroradiometer (MODIS) data, both Terra and Aqua can help us determinetheAODsince2000.
ThepresentworkaimstoinvestigatetheseasonalvariationsinAODlevelsintheLucknowdistrict
TheAODwasfoundto beincreasingby86.5%inthelast20yearsinthemonthofJanuarywhichwasrecordedthehighestpercentageincreasein AODwhilethelowestwasinthemonthofSeptember 7.5%.
Keywords: Anthropogenic activity, space monitoring, Aerosols, Aerosol Optical Depth (AOD), MODIS (Moderate Resolution Imaging Spectroradiometer)
Atmospheric aerosols affect the overall energy balance of the earth. They are produced by both natural and man made processes and get dispersed horizontally and vertically through atmospheric circulation. Due to their brief and momentarily life span of about a week in the lower atmosphere, they exhibit large spatial and temporal variability. Aerosolsaffecttheclimateandplayamajorroleinclimatechangebutduetovariabilitiesincharacteristicsontheregional levelsitbecomesdifficulttopredicttheircharacteristics.
MODIS provides both Terra and Aqua satellites to find AOD over land and water bodies. The regional populated tropical areas contribute most to global aerosol surface forcing (Chung et.al,2005). The researchers have begun to explore the potentialofMODISdatatoestimateairquality(Guptaet.al2006).Thespatialtemporalvariabilityoccursbymeteorological conditionssuchas moist air masses andair pollutioninduced due to anthropogenic activities contributingtoincrease in AODs.
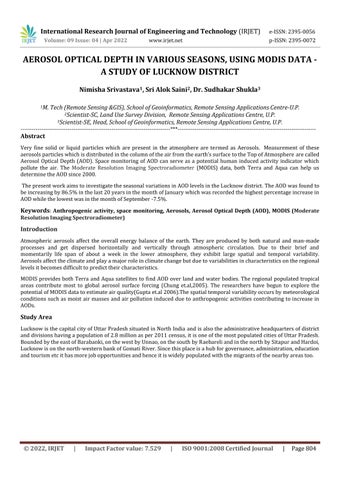
LucknowisthecapitalcityofUttarPradeshsituatedinNorthIndia andisalsotheadministrativeheadquartersofdistrict anddivisionshavingapopulationof2.8millionasper2011census,itisoneofthemostpopulatedcitiesofUttarPradesh BoundedbytheeastofBarabanki,onthewestbyUnnao,onthesouthbyRaebareliandinthenorthbySitapurandHardoi, Lucknowisonthenorth westernbankofGomatiRiver.Sincethisplaceisahubforgovernance,administration,education andtourismetcithasmorejobopportunitiesandhenceitiswidelypopulatedwiththemigrantsofthenearbyareastoo.
9001:2008
Nimisha Srivastava1 , Sri Alok Saini2 , Dr. Sudhakar Shukla3of Engineering and Technology (IRJET)
Volume: 09 Issue: 04 | Apr 2022 www.irjet.net
e ISSN:2395 0056
ISSN:2395 0072
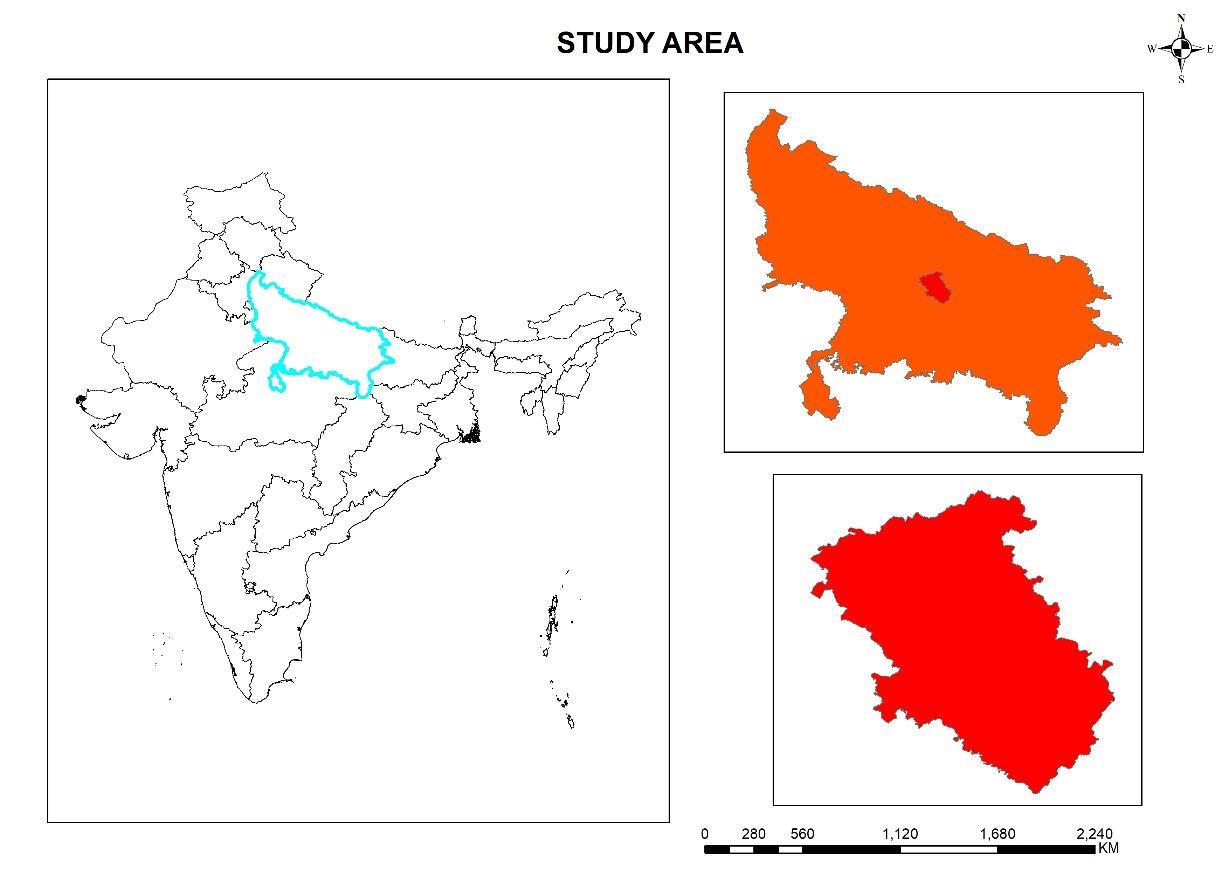
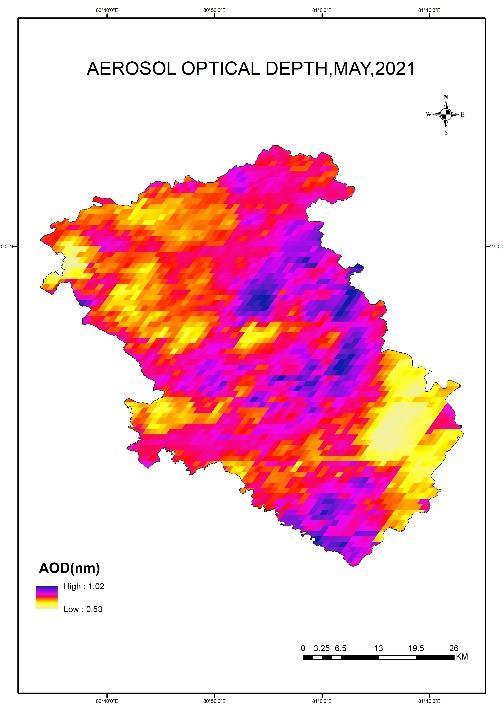
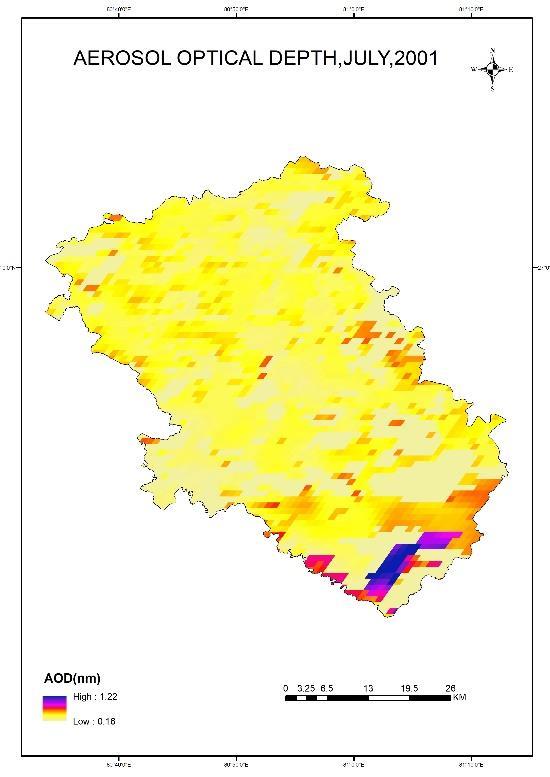
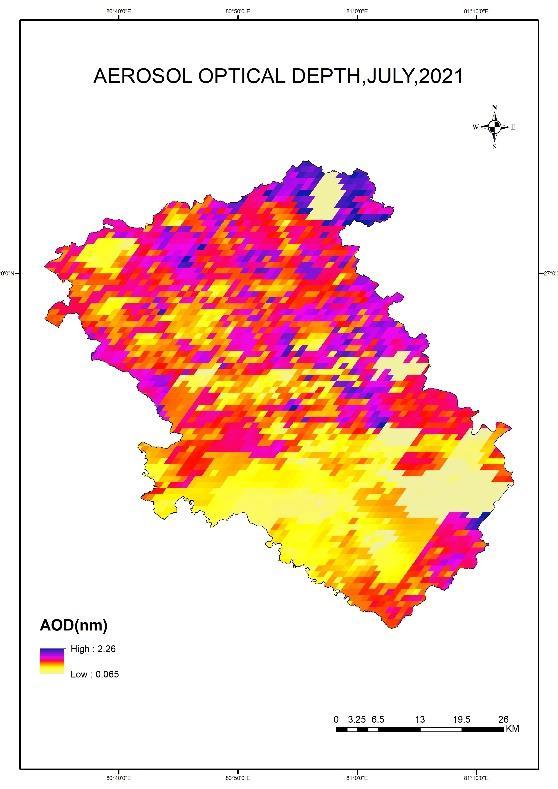
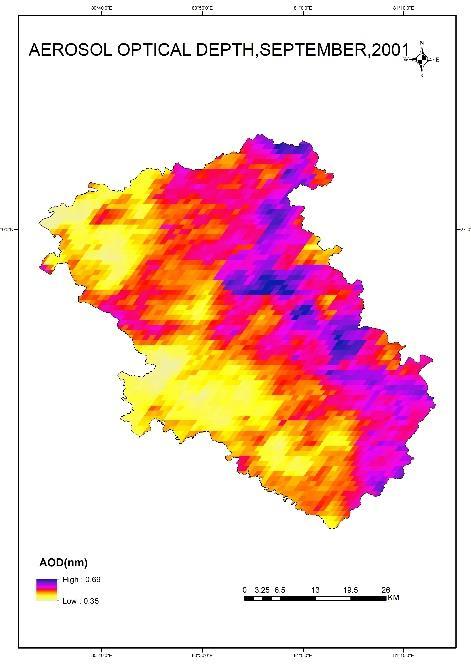
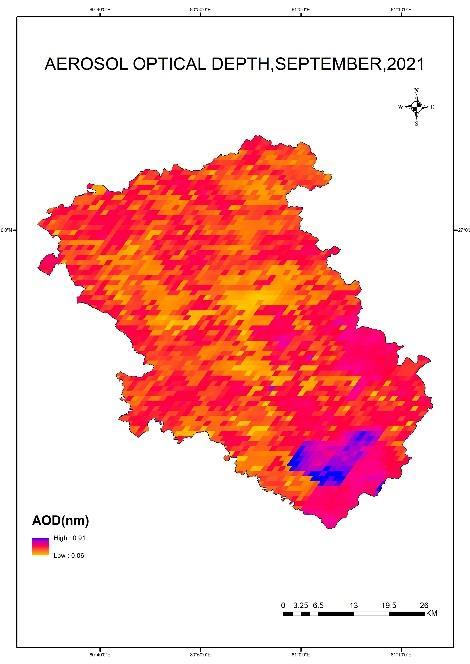
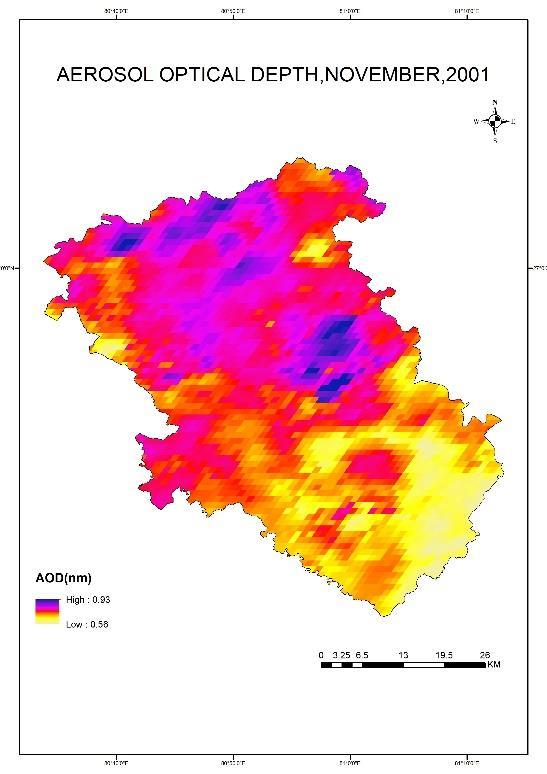
OurapproachtoestimatingtheAODoverLucknowdistrictwasbasedonanalysinglong termvariationsofAOD.Toattain thegoal,weusedAODdata fromtheMODIS.ThebandnamedasOptical_Depth_047,BlueBand(0.47um)aerosoloptical depth over land) was retrieved the AOD data from Google Earth Engine. The AOD was estimated for the year 2001 and 2021oftheJanuary,March,May,July,September,Novembermonths.MODIS Terra, a comparisonbetweenthe 2001and 2021showedsimilarAODtrendsandresults.
The MCD19A2 V6 data product is a combined Terra and Aqua, Multi angle Implementation of Atmospheric Correction (MAIAC) Land Aerosol Optical Depth (AOD) gridded Level 2 product produced daily at 1 km resolution. (MAIAC user guide)
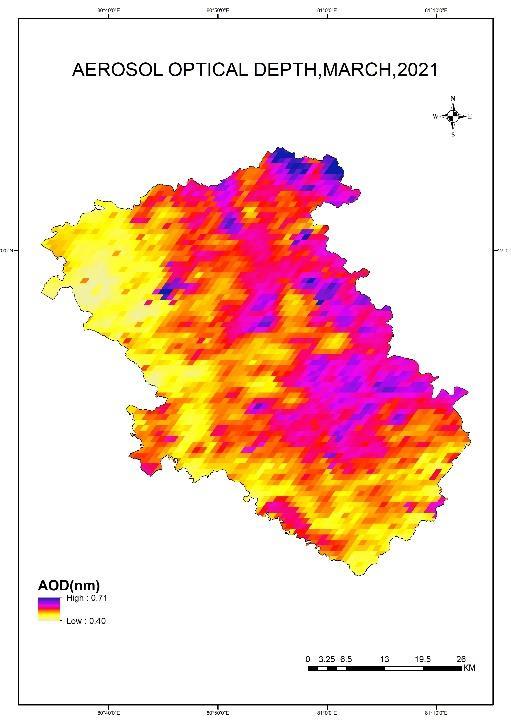
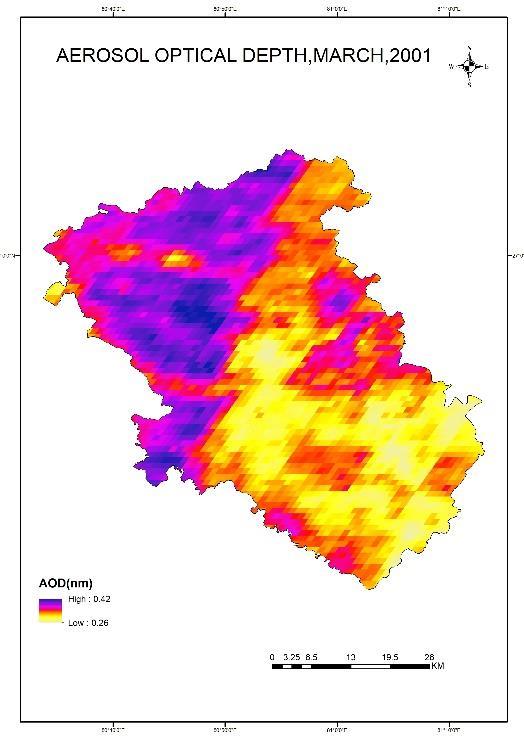
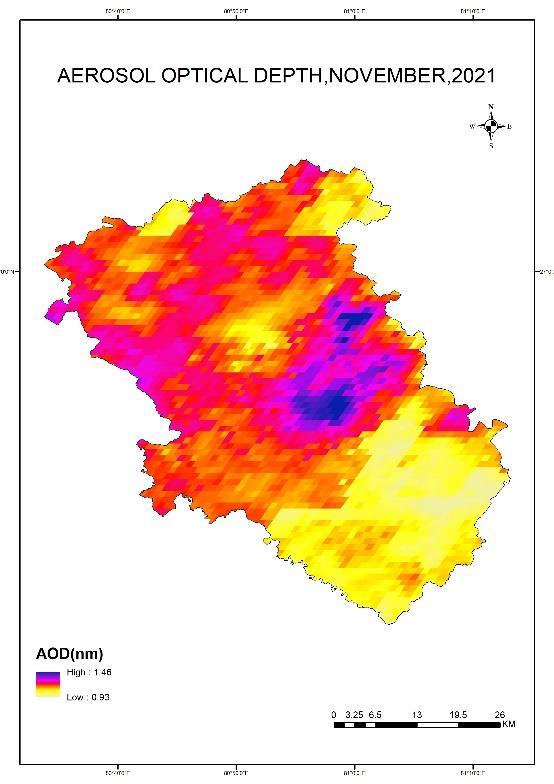
TheMaximumAerosolOpticalDepthin2001wasfoundtobe0.74inthemonthofNovemberwhilein2021theAODwas maximuminthemonthofNovemberandJanuaryrespectively.TheleastAODwasobservedinthemonthofMarchin2001 which was 0.34 and in the year 2021 the minimum AOD was observed in the month of September which was post monsoon,followedbythemonthofMarchwithanAODof0.56.
MONTH 2001 AOD mean 2021 AOD mean
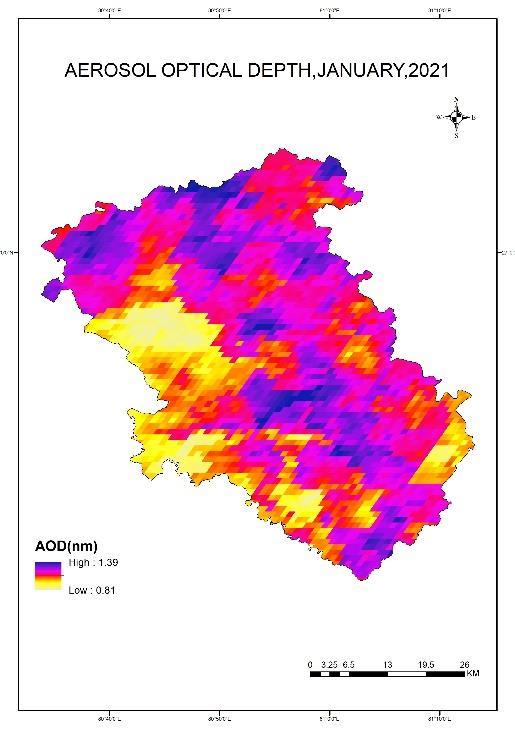
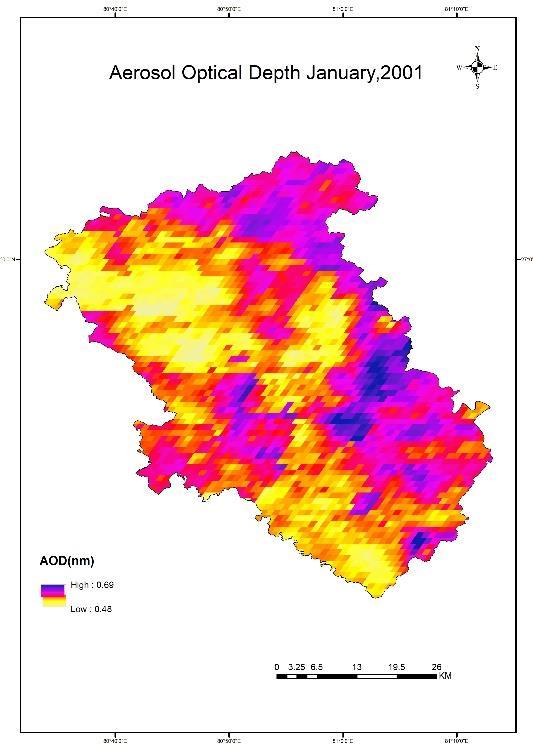
JANUARY 0.58 1.10
MARCH 0.34 0.56
MAY 0.69 0.78
JULY 0.69 1.16
SEP 0.52 0.48
NOV 0.74 1.20
Volume: 09 Issue:
www.irjet.net
e ISSN:2395 0056
ISSN:2395 0072
Engineering and Technology (IRJET)
Volume: 09 Issue: 04 | Apr 2022 www.irjet.net
100
Perc e n ta ge %
e ISSN:2395 0056
ISSN:2395 0072
Percentage increase in AOD in 20 years
80
International Research Journal of 0
p 20
86.57273508 64.06693838 13.3836126
60
67.96256299 7.593258852
61.45794994 -20
JANUARY MARCH MAY JULY SEP NOV
Month
Aerosols have increased leaps and bounds in the past 20 years due to immense consumption of energy. In the month of January,themaximumAODwas0.69nmand 0.48nmwhiletheminimumAODrecordedwas0.48nmand0.81nmin2001 and2021respectively.Thisaccountsforanincreaseof86.5%increaseinthelevelsofaerosolopticaldepthinthelast20 years.In the monthof September whichisthemonthafter theheavysouth western monsoonhasalreadytaken placein this region, the AOD was quite less. Although an increase was noticed in the maximum AODs of the September month in 2001 and in 2021. The main city area of the Lucknow district remained full of aerosol particles in the winter months (NovemberandJanuary)thusmakingtheairmorepollutedanddifficultforbreathingespeciallyforthepeoplewhosuffer fromlungandrespiratorydiseases.Anincreaseofaround61.45%wasalsorecordedinthemonthofNovember.
Increased energy consumption of fossil fuels, stubble burning and burning of fire crackers etc have been prominent reasonsfortheincreasedAODlevelsinthemonthofNovember.DuetoatmosphericconditionsprevailingintheNorthern India,theAerosolslevelremainhighduringthewintermonth.WhenthereisonsetofsummeraroundthemonthofMarch, theAODlevelsslowlydecreaseduetowidespreadduststormscommonlynamedas“loo”. Duetoincreasedconsumption offossilfuelsandindustrialeffluents,theaerosolsagainriseintotheatmospherebutsoonaftertheMaymonthends,the monsoon hits Lucknow and the AOD levels become comparatively low. Again, in the month of November due to several reasons,theAODlevelrises.
The only way to combat rising levels of AOD is to cut down on sources which causes dust, smoke and pollution which means use of eco friendly use of transportation, capacity building of farmers to not be inclined towards Shifting agriculture.
© 2022, IRJET | Impact Factor value: 7.529 | ISO 9001:2008 Certified Journal | Page808 40
1. Boiyo,R.,Kumar,K.R.,&Zhao,T.(2018).SpatialvariationsandtrendsinAODclimatologyoverEastAfricaduring 2002 2016: a comparative study using three satellite data sets. International Journal of Climatology, 38, e1221 e1240.
2. Chung,C.E.,Ramanathan,V.,Kim,D.,&Podgorny,I.A.(2005).Globalanthropogenicaerosoldirectforcingderived fromsatelliteandground basedobservations. Journal of Geophysical Research: Atmospheres, 110(D24).
3. Chung,C.E.,Ramanathan,V.,Kim,D.,&Podgorny,I.A.(2005).Globalanthropogenicaerosoldirectforcingderived fromsatelliteandground basedobservations. Journal of Geophysical Research: Atmospheres, 110(D24)
International Research Journal of Engineering and Technology (IRJET)
Volume: 09 Issue: 04 | Apr 2022 www.irjet.net
e ISSN:2395 0056
p ISSN:2395 0072
4. Kumar,K.R.,Sivakumar,V.,Reddy,R.R.,Gopal,K.R.,&Adesina,A.J.(2013).Inferringwavelengthdependenceof AOD and Ångström exponent over a sub tropical station in South Africa using AERONET data: Influence of meteorology,long rangetransportandcurvatureeffect. Science of the Total Environment, 461,397 408.
5. Nayak,S.,Maity,S.,Singh,K.S.,Nayak,H.P.,&Dutta,S.(2021).Influenceofthechangesinland useandlandcover ontemperatureoverNorthernandNorth EasternIndia. Land, 10(1),52.
6. Nyasulu, M., Haque, M. M., Boiyo, R., Kumar, K. R., & Zhang, Y. L. (2020). Seasonal climatology and relationship betweenAODandcloudpropertiesinferredfromtheMODISoverMalawi,SoutheastAfrica. Atmospheric Pollution Research, 11(11),1933 1952.
7. Ramachandran,S.,&Kedia,S.(2013).AerosolopticalpropertiesoverSouthAsiafromground basedobservations andremotesensing:areview. Climate, 1(3),84 119..
8. Sogacheva,L.,Rodriguez,E., Kolmonen,P., Virtanen,T. H.,Saponaro,G.,deLeeuw, G.,...&vanderA,R. J.(2018). Spatial and seasonal variations of aerosols over China from two decades of multi satellite observations Part 2: AOD time series for 1995 2017 combined from ATSR ADV and MODIS C6. 1 and AOD tendency estimations. Atmospheric Chemistry and Physics, 18(22),16631 16652.
9. Wang, Y., Xin, J., Li, Z., Wang, S., Wang, P., Hao, W. M., ... & Sun, Y. (2011). Seasonal variations in aerosol optical propertiesoverChina. Journal of Geophysical Research: Atmospheres, 116(D18).
| ISO 9001:2008