International Research Journal of Engineering and Technology (IRJET)

Volume: 09 Issue: 04 | Apr 2022 www.irjet.net
e ISSN: 2395 0056
p ISSN: 2395 0072
International Research Journal of Engineering and Technology (IRJET)
Volume: 09 Issue: 04 | Apr 2022 www.irjet.net
e ISSN: 2395 0056
p ISSN: 2395 0072
1Computer Science and Engineering, Jain (Deemed to be) University), India
2Dean, PG Studies, FET, Jain (Deemed to be) University, India
***
Abstract TheIntegratedProductionModelingApproachis essentially a design methodology that integrates the subsurface andsurface facilities as a single system as opposed to a silo design. It integrates the inflow and outflow performance of wells and multiphase flow analysis through the wellhead to the surface processing plant. This paper models and optimizes a mature oilfield of two (2) reservoirs and two (2) wells with both tied to a central inlet manifold by two separate flowlines and fluid delivered to a central separator at the process plant with limited capacity thereby requiringoptimization. The models are implementedutilizing Petroleum Experts’(PETEXs) Integrated Production Modeling (IPM) tool kit comprising Pressure, Volume and temperature Package (PVTP), Material Balance Software (MBAL) for the Reservoir modeling, the Production and System Performance Analysis Software (PROSPER) for well modeling and nodal analysis, the General Application Package (GAP) for multiphase network modeling and optimization. The IPM toolkit also provides for a field numerical reservoir modeling called REVEAL and an Interface called RESOLVE for explicit coupling of the reservoir and network simulator. The facility achieveda combinedproductionof20,806STB/day exceeding the process facility separator capacity of 18,000STB/day which resultedinoptimizingthe productionbychokingbacka well thereby achieving an optimized production rate of 17,000STB/day. The accumulatedforecast productionstands at 117MMSTB over the period from 2008 to 2030.
Key Words: Oilfield, Integrated Production Modeling, ProductionOptimization,MBAL,PROSPER,GAP
Oilfield, Integrated Production Modeling, Production Optimization,MBAL,PROSPER,GAP.
Dempsey et al [12] pioneering integrated design was embraced by multinational oil and gas companies who developed their respective integrated designs in their organizations[13,14,15,16].
The Petroleum Experts’ (PETEXs) Integrated Production Modelling (IPM) suite comprising (PVTP), (MBAL),
2022,
Factor value:
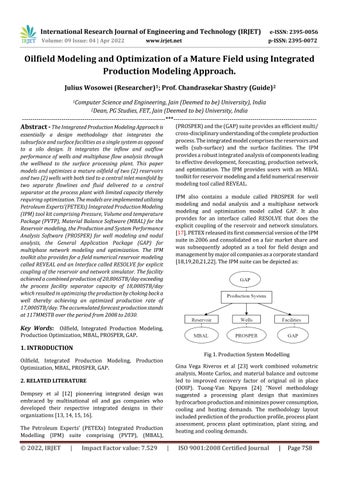
(PROSPER)andthe(GAP)suiteprovidesanefficientmulti/ cross disciplinaryunderstandingofthecompleteproduction process.Theintegratedmodelcomprisesthereservoirsand wells (sub surface) and the surface facilities. The IPM providesarobustintegratedanalysisofcomponentsleading toeffectivedevelopment,forecasting,productionnetwork, and optimization. The IPM provides users with an MBAL toolkitforreservoirmodelingandafieldnumericalreservoir modelingtoolcalledREVEAL.
IPM also contains a module called PROSPER for well modeling and nodal analysis and a multiphase network modeling and optimization model called GAP. It also provides for an interface called RESOLVE that does the explicit coupling of the reservoir and network simulators. [17].PETEXreleaseditsfirstcommercialversionoftheIPM suitein2006andconsolidatedonafairmarketshareand was subsequently adopted as a tool for field design and managementbymajoroilcompaniesasacorporatestandard [18,19,20,21,22].TheIPMsuitecanbedepictedas:

Gina Vega Riveros et al [23] work combined volumetric analysis,MonteCarlos,and material balanceandoutcome led to improved recovery factor of original oil in place (OOIP). Tuong Van Nguyen [24] “Novel methodology suggested a processing plant design that maximizes hydrocarbonproductionandminimizespowerconsumption, cooling and heating demands. The methodology layout includedpredictionoftheproductionprofile,processplant assessment, process plant optimization, plant sizing, and heatingandcoolingdemands.
|
9001:2008
International Research Journal of Engineering and Technology (IRJET)
Volume: 09 Issue: 04 | Apr 2022 www.irjet.net
Somecrediblelessonslearnedshowthatthe difference in weights in IPM simulation compared to stand alone is a functionoftheaccuracyofboundaryconditions.Hatviketal [25]madeaperformancecomparisonamong;astand alone dynamicreservoirmodel,astand aloneflownetworkmodel, andafullycoupledreservoirnetworkmodelandconcluded that a fully coupled model is the only one that reflected integrated behavior of the entire system that reduces the uncertaintyorforecast.
TheintroductionofMBALaccountsformaterialsenteringor exitingthesystem.Thesetofcalculationsderivedconsiders thereservoirasalargetankandusesmeasurablequantities to ascertain materials that are difficult to measure. The measurablequantitiesarethecumulativefluidforwater,oil, andgas,fluidproperty,andreservoirpressure.Thematerial balanceispremisedonthemassconservationprinciple.
Initial Hydrocarbon originally in place = Fluid produced+Remainingfluidinplace
Production=STOIIP*UnitExpansion+WaterInflux
Materialbalanceimpliesproducingacertainamountoffluid and measuring the average reservoir pressure before and afterproduction,andwiththehindsightofPVTpropertiesof thesystemcalculateamassbalance.TheMaterialBalance Equation[MBE]wasmodifiedbyHavlenaandOdehtoderive a straight line equation with parameters expressed as a function of others [26]. The MBE can be mathematically expressedas: Np*[Bo+(Rp Rs)*Bg]+WpBw = N*[(Bo Boi) + (Rsi Rs)*Bg + MNBoi*(Bg/Bgi 1)+(1+M)*NBoi*(CwSw+Cf)∆P/1
Equation(1)
Thesimplifiedstraight lineformcanbegivenas: F=N*(E
Equation(2)
Therefore,takingaplotof[F/(E
E
VsW
e ISSN: 2395 0056
p ISSN: 2395 0072
PROSPERisforthemodelingofthewell.Itservesasatool for the modeling of Well and pipelines as well as for the nodalanalysisfortheutilizationofspecificfieldinformation. TheWellmodelcreatedformsthelinkbetweenthereservoir and surface production system components [27]. The characteristicsoftheWellhoweveraccountedforthefluid characterization (PVT) and other essential components of thePROSPERsuitearetheVerticalLiftPerformance(VLP), InflowPerformanceRelationship(IPR),TubingTransverse curves,andAbsoluteOpenFlow(AOF).
While the MBAL and PROSPER are used for the Reservoir andWell,theGAPsuiteisusedfordevelopingthesurface facility model [28]. The creation of GAP requires all Well details (Well type, name, and location), flowline and pipe specifications(landroughnessanddiameter),andelevation. In the surface model, all active and inactive Wells are includedinthesurfacenetworkobservedinbothReservoir andWelldevelopment.TheGAPdesigninthisModeldoes not have a compressor due to low gas requirements. The generalGAPworkflowisasdetailedbelow:
Constructasurfacemodel(GAP).
LinkMBALandPROSPERmodelstoGAP.
AddQmaxandDowntimeorWellheadabandonment pressureandMRTLL.
GenerateIPRandVLPcurves.
PerformSimulation.
The Input parameters for the MBAL, PROSPER, and GAP modelsareasfollows:
3.4.1 MBAL:TheMBALinputcomprisesthePVTdata,Tank data, history matched aquifer properties, relative permeabilitydata,productiondata(history),andreservoir thickness. The input parameters are summarized in the tablesbelow:
E
givesa linearrelationshipestimatingthe Original Hydrocarbon in Place (OHIP) with a unit slope meaning a reservoir model and the aquifer is identified. A situation wherethisdoesnotexistimpliesthedeviationisadynamic mechanismandfurthertuningofparametersisrequiredto obtainlinearityandthepresenceofcorrupteddataforthe analysis.
PROSPERisapackageofthePETEXIPMsuiteforproduction modeling. While MBAL is used to model the reservoir,
ISO 9001:2008
Research Journal of Engineering and Technology (IRJET)
Volume: 09 Issue: 04 | Apr 2022 www.irjet.net
Table1PVTData

Table5ReservoirXData

e ISSN: 2395 0056
p ISSN: 2395 0072
Table2TankData


Table3RelativePermeabilityofX
Table6ReservoirYData
3.4.2 PROSPER Model: ThePROSPERinputWellX1datais ascontainedinthetablesbelow;
WaterCut:22.2%
ProductivityIndex=11.6STB/day/psi ReservoirPressure:4680psig TotalGOR:325.028SCF/STB

Table7WellDeviation
Table4RelativePermeabilityofY
ISO 9001:2008
Research Journal of Engineering and Technology (IRJET)
Volume: 09 Issue: 04 | Apr 2022 www.irjet.net
Table8DownholeEquipmentDataforWellX1


Table9GeothermalGradientforWellX1
Table10TestDataPointforWellX1
Theinput Well Y1 datais:
WaterCut:0%
ProductivityIndex=7.03stb/day/psi ReservoirPressure:4660psig
TotalGOR:768scf/stb
Table11WellDeviationforWellY1
Table12DownEquipmentDataforWellY1
2022, IRJET
e ISSN: 2395 0056
p ISSN: 2395 0072
Table14TestDataPointforWellY1
3.4.3 GAP Model:TheinputparametersfortheGAPsurface facilitiesmodelisasinthetablebelow(Pipelineproperties). SeparatorCapacity:18,000bbl/day SeparatorPressure:250psig
Table15PipelineProperties


Datapreparationandconsistencycheckswerecarriedout ontherelevantinputparameters.TheseincludePVTdata, the average pressure, production history, and aquifer parameters. The available PVT data were matched using different Black Oil PVT models to select the model that provides the best match for the acquired data. The Glaso correlationandthePetroskywereuseful.

TheavailablePVTdataforReservoirXwasmatchedusing different Black Oil PVT models to select the model that provides the best match to the acquired data. From the analysis,theGlasocorrelationwasfoundtoprovidethebest match for Bubble point, Oil formation volume factor, and solution Gas Oil Ratio whereas the best matches for gas

Impact Factor value: 7.529 | ISO 9001:2008 Certified

International Research Journal of Engineering and Technology (IRJET)
Volume: 09 Issue: 04 | Apr 2022 www.irjet.net
formationvolumefactor,gasviscosity,andoilviscositywere offeredbythePetroskycorrelation.However,forReservoir Y,theVasquez Beggscorrelationwasfoundtoprovidethe bestmatchforBubblePoint,SolutionGas Oilratio,andOil formationvolumefactor.TheBealetalcorrelationprovided the best match for Oil viscosity, Gas viscosity, and Gas formationvolume.
Field data is generally prone to several errors including samplingerror,systematicerror,randomerror,andothers. Therefore,theresearchdatawasvalidatedbycarefulreview, accuracychecks,andconsistency.Thecomparisonbetween laboratory PVT data and the Black Oil PVT model was adequateandconsistent.
The Energy needed to drive the hydrocarbon from the reservoir to the surface comes basically from three (3) sources namely: Fluid expansion, PV compressibility, and waterinflux,andthisisdeterminedbyhistorymatching.It determinesthesourceofthedrives,sizeandaquifertype, andalsoitsstrength.Thebestfitisderivedthroughatrial erroronmaterialbalancebycomparingtheobserveddata andcalculatedvalueatazero dimensionallevel.
The analytical method is a nonlinear regression based technique employed in estimating the unknown reservoir and the aquifer parameters. It minimizes the difference between the observed and measured reservoir model productionandassessestheeffectofparametervariations. Theregressionqualityexplainsthedifferencebetweenthe model standard deviation and measured values. The analyticalplotdeterminestheOOIP,innerandouterradius, encroachmentangle,andaquiferpermeability.
Afteraproperqualitymatchobservationfromtheanalytical plot,HavlenaandOdelinearplot(F/EtvsWe/Et)canbeused todeterminethesizeoftheaquiferinthegraphicalmethod. This is also known as the Campbell plot with no initial aquifer and flow expansion becoming the only source of energydriveofthereservoir.
The energy plot defines the existing energy drive of the reservoir. These are either or all of the fluid expansion, waterinflux,andinjectionorpore volumecompressibility. Thisistheenergysystemcontributiontothereservoir.
e ISSN: 2395 0056
p ISSN: 2395 0072
Duetothevulnerabilityofmaterialbalancecalculationseven withsmallpressurechanges,certainassumptionsaremade:
Constanttemperature
Pressureequilibrium
Constantreservoirvolume
4.9 Black Oil correlation model:Thisdescribedthefluid behaviorinbothwellsXandYduetolimitedPVTdata.The blackoilmodelusuallyaccountsforretrogradecondensate fluidsandallowsfortheproductionofliquiddropoutinthe Wellbore.
4.10 Stable and Cyclic Wells: Wells can be classified as either stable or unstable. Wells producing at constant WellheadRate(WHR)areclassifiedasstablewhereascyclic (unstable)WellsexhibitconstantBHPpressurebuild upin short bursts of Gas and under liquid loaded conditions. ReservoirYinourstudycontainsvolatilecrudewhereasX doesnot.
BeforemyanalysisiscarriedoutinPROSPER,theIPRand VLP must be matched with correlations for accurate sensitivity analysis. IPR is defined as “the Well flowing bottom holepressure(Pwf)aboutproductionrate”.Itshows whatreservoirscandelivertothebottomhole.Itdescribes the flow rate behavior with respect to pressure and represents an important tool to understand productivity. VLPcurveshowstheamountofpressurerequiredtoliftan amountoffluidtothesurfaceatagivenWHP.Theessenceof the matching is to ascertain the percentage difference betweenthemeasuredrate andcalculatedrateofgasand Bottomholepressure.
Reservoir X is an undersaturated oil reservoir with the followingspecifications:
Initialpressure=5150psia
Temperature=2150F
Bubblepointpressure=1537.85psia
API=35.2
InitialsolutionGasratio=352.028scf/STB
Thickness=120ft
InitialOilinplace=425MMSTB
© 2022, IRJET | Impact Factor value: 7.529 | ISO 9001:2008 Certified
762
Journal of Engineering and Technology (IRJET)
Volume: 09 Issue: 04 | Apr 2022 www.irjet.net
After a proper aquifer fitting was performed on historical productionandaquiferparameters,apictorialviewofthe fractional distribution of energy responsible for hydrocarbonrecoveryoffieldXwasobtainedasshownin figure 2. The energy plot shows that fluid expansion was initiallythemajordrivemechanism,afterwhichwaterdrive becameamajorcontributortoproductionandPoreVolume compressibilitytheleast.
Fig.3: Graphical plot (Campbell) for field X before Regression
e ISSN: 2395 0056
p ISSN: 2395 0072


From the production history match without adding an aquifer, the above plots were obtained for the analytical and graphical methods asshowninfigures3and4.From the Campbell plot, the history data points do not lie in a straightline,showingthatagoodmatchhasnotbeenmade andtheremaybethepresenceofanaquifer.
The Analytical plot also shows a mismatch between historicalcumulativeproductionandthatderivedfromthe model. It shows an under prediction of cumulative oil produced for a given pressure drop. For this reason, the presenceofanaquiferisalsosuspectedtobecontributingto historicalproduction.
Fig.5: Graphical plot (Campbell) for field X after Regression

Volume: 09 Issue:
| Apr
Engineering and Technology (IRJET)
www.irjet.net
Amodifiedvan EverdingenandHurstaquifermodelwasset up to match historical production and the aquifer parameterswiththehighestuncertaintieswereregressedto matchhistoricaldata,allwithinwell definedboundariesthat suit reasonable engineering and geological judgment. The parameters regressed include The encroachment angle, outer/inner radius, and aquifer permeability. The plots in figures5and6weregeneratedaftertheregressiononthe differentparameters.
Afterdefiningtheaquifer,andregressingontheuncertain parameters, it can now be seen that the graphical plot (Campbell) nowfallsonastraightlineandthe Analytical plot nowfollowsthehistoricaltrend.Thematchedaquifer propertiescanbeseenintheanalyticalplotwhichshows: encroachment angle 360(degrees), calculated Aquifer volume(113975mmft3),Aquiferpermeability(9.93591mcl), andOIP(425.704MMSTB).Withthis,agoodhistoricalmatch hasbeenmadeandpredictionscannowbecarriedoutafter agoodfractionalflowmodelisobtained.
Reservoir Y is an undersaturated oil reservoir with the followingproperties:
Reservoir X is an undersaturated oil reservoir with the followingspecifications:
Initialpressure=4800psia
Temperature=2150F
Bubblepointpressure=2786.84psia API=51.84
InitialsolutionGasratio=768scf/STB Thickness=110ft
InitialOilinplace=762MMSTB
e ISSN: 2395 0056
p ISSN: 2395 0072
After a proper aquifer fitting was performed on historical productionandaquiferparameters,apictorialviewofthe fractional distribution of energy responsible for hydrocarbonrecoveryoffieldYwasobtainedasshownin figure 7. The energy plot shows that fluid expansion was initiallythemajordrivemechanism,afterwhichwaterdrive becameamajorcontributortoproductionandPoreVolume compressibilitytheleast.
Fig.9: Analytical plot results for field Y after regression 5.8 Analytical plot


9001:2008

Research Journal of Engineering and Technology (IRJET)
Volume: 09 Issue: 04 | Apr 2022 www.irjet.net
Fromtheproductionhistorymatch,thefollowingAnalytical plots as in figures 8 and 9 were derived for without/with Aquifer respectively. The plot without Aquifer shows a mismatchbetweenhistoricalcumulativeproductionandthat derived from the model. This signifies the presence of an aquiferandisalsosuspectedtobecontributingtohistorical production.Whileafterdefiningtheaquifer,andregressing on the uncertain parameters, it can now be seen that the Analytical plot nowfollowsthehistoricaltrend.Withthis,a good historical match has been made and predictions can now be carried out after a good fractional flow model is obtained.


BasedontheAnalyticalplot,pressuresimulationwasalso carriedouttodeterminethevalidityofthemodel,asshown belowinfigure10.BothHistoryandsimulationplotslieon thesamelineshowingagoodmatch.
From the pressure simulation, we can see a good match between historical pressure and simulated pressures for reservoir Y. More so, using the historical data, a good fractionalflowmatchwasalsoobtainedasshowninfigure 11.

Fig.11:ShowsFractionalFlowbetweenHistoricaland Simulatedpressures.
e ISSN: 2395 0056
p ISSN: 2395 0072
6. Well Model (PROSPER): Thismodelthewellfor optimizationandperformance.
6.1 WellX1
6.2 IPR
Fig.12:DownholeSchematicsofWellX1

After PVT matching and defining the well properties, the well IPR was modeled as shown in figure 13 with the AbsoluteOpenFlowPotentialtobe46621.6STB/day. Sensitivitieswerealsocarriedonreservoirpressureandthe IPRcanbeseentovaryasshownbelowinFigure14

Fig.14:PlotsofIPRafterSensitivityonReservoirPressure
2022,
Factor value: 7.529 | ISO 9001:2008 Certified
Research Journal of Engineering and Technology (IRJET)
Volume: 09 Issue: 04 | Apr 2022 www.irjet.net
Infigure15differentcorrelationswerematchedtothetest pointtoobtainthetubingtraversecurve,allgivingagood matchatthetestdatapoint.However,thePetroleumExperts 2correlationwasselectedasitshowstogivemorecorrect predictionsoveralargerrangeofdata.
The IPR is the Well flowing bottom hole pressure (Pwf) in relation to production rate and the VLP curve shows the amountofpressurerequiredtoliftanamountoffluidtothe surfaceatagivenWHP.Thematchingiscarriedouttoshow the measured percentage difference concerning the calculated percentage difference of gas and Bottom hole pressure.VLP/IPRisneededforaccuratesensitivityanalysis asseeninfigure16showingagoodmatchatthetestrate andbottomholepressure.


With the good match obtained for VLP/IPR, sensitivities were carried out, and lift curves were generated for Production Performance Prediction as shown in figure 17 below.
e ISSN: 2395 0056
p ISSN: 2395 0072

7. WELL MODEL(PROSPER)
7.1 Well Y1
7.2 IPR
Fig.18:DownholeSchematicforWellY1
Fig.19:PlotofIPRshowingAbsoluteOpenFlow(AOF)

AfterPVTmatchinganddefiningthewellproperties,the wellIPRwasmodeledasshowninfigure19withAbsolute OpenFlowPotentialtobe24052.6STB/day
Sensitivitieswerealsocarriedonreservoirpressureand theIPRcanbeseentovaryasshownbelowinFigure20.
2022,
Factor value: 7.529 | ISO 9001:2008
International Research Journal of Engineering and Technology (IRJET)
Volume: 09 Issue: 04 | Apr 2022 www.irjet.net

As shown below in figure 21, different correlations were used to match the test point, to obtain the right tubing traverse curve. However, only the Petroleum experts 2 correlationwasabletocorrectlymatchthetestdatapoint.

The IPR is the Well flowing bottom hole pressure (Pwf) in relation to production rate and the VLP curve shows the amountofpressurerequiredtoliftanamountoffluidtothe surfaceatagivenWHP.Thematchingiscarriedouttoshow the measured percentage difference with respect to the calculated percentage difference of gas and Bottom hole pressure.VLP/IPRisneededforaccuratesensitivityanalysis asseeninfigure22showingagoodmatchatthetestrate andbottomholepressure.


e ISSN: 2395 0056
p ISSN: 2395 0072
Withthegoodmatch,sensitivitieswerecarriedout,andlift curves were generated for production performance prediction,asshownbelowinfigure23.
Fig.23:VLP(Tubing)curvesforProductionPerformance Prediction


Fig.24:GAPModelforFieldsXandY
2022, IRJET
Impact Factor value: 7.529 | ISO 9001:2008 Certified Journal |
767
Journal of Engineering and Technology (IRJET)
Volume: 09 Issue: 04 | Apr 2022 www.irjet.net
Figure 24 above is the generated GAP Model for the reservoirs and wells in the study. It consists of two reservoirs,eachofwhichisproducedbyonewell.Thetwo wellsaretiedtoacentralmanifoldbyseparateflowlinesand productionisdeliveredtoacentralseparator11kmaway. Theseparatorisoperatingatapressureof250psigandcan processabout18,000STB/dayofoil.Thismodelwillhelpto optimizerecoveryfromthesewellsbyprovidingchokeback options,tomeetthecapacityofthecentralseparator.

The combined production for both wells is about 20,806 STB/day, as shown below. This is above the separator capacityof18,000 STB/day andneedsto beoptimized by chokingbackonthewells.

e ISSN: 2395 0056
p ISSN: 2395 0072
The well combined rate to the separator is now 17011 STB/day,whichwasobtainedbychokingbackwellX1and leavingwellY1fullyopened,asshowninfigure26.
Fig.27:ShowsProductionPredictionfrom01 10 2008to 01 01 2030.

The plot above shows how the oil production rate will changeovertime,from2008to2030.Cumulativeproduction ofabout117MMSTBofoilwouldhavebeenproduced.
Observation 1.
The results derived from MBAL analysis indicate that reservoirsXandYhavebeenaffectedbyadjoiningaquifers whichmayhavealsoaffectedthehistoricaldatausedinthe analysis. From the MBAL analysis, a significant aquifer permeabilityof10mband19.439mbandanencroachment angleof360degreesand359.739degrees respectively for reservoirsXandYindicatetheattainmentofa radial.The energyplotsindicatethatfluidexpansionandwaterdrive arethemajorsourcesofenergy.
The MBAL method was used to estimate the hydrocarbon reserveinpreferencetoothermethods.Othermethodsmay include Volumetric estimation, Numerical reservoir simulation,Carbonreservoirestimationmethod,Uncertainty modeling,Probabilisticmethod,MonteCarlotechnique,or Hypercube.Sincethebasicassumptionsforeachmethodare quitedifferent,themethodsmaynotaccountforthesame volumehencedifferentestimates.
After proper PVT matching with well properties properly defined, the IPR was modeled and the Absolute Oil Flow Potentialsshowed4662.6STB/dayand24052.6STB/dayfor fields X and Y respectively which represent the maximum flowrateofawellatazeroback pressureatperforations.
International Research Journal of Engineering and Technology (IRJET)
Volume: 09 Issue: 04 | Apr 2022 www.irjet.net
The VLP/IPR match relates the well flowing bottom hole pressure in relation to the production rate and pressure requiredtoliftanamountoffluidtothesurfaceatagiven WHP. It measures the percentage difference of the measured/calculatedrateofoil/gasatagivenBHP.Itshows 13970.0 and 13967.5STB/day for the measured and calculated respectively and a percentage difference of 0.017742 for liquid rate and 2671.30 and 2671.01Psig measured/calculatedandapercentagedifferenceof0.11086 forBHPpressure.
Theprocessseparatorcapacityis18000STB/daywhichis lessthanthe20806STB/dayproductionhencetheneedfor optimizationbychokingbackawellwhichbringsthetotal productionto17011STB/day.Thecumulativeexpectedoil production from 2008 to 2030 is seen to be at 117MMSTB/day.
Theconclusionsdrawnfromthework areasfollows: The work considered a comprehensive oilfield study by deploying IPM to optimize the fields. It modeled and optimizedthereservoir,wellandsurfacefacilityusingMBAL to model the reservoir, PROSPER for the well, and GAP to modelthesurfaceproductionfacility.
Flow expansion and water drive mechanisms are the predominant sources of energy for both reservoirsXandY.Theworkfurthershowsthatthe analytical method is not adequate proof for the usage of a particular model with aquifer support hence the need for a graphical method for verificationforbothreservoirsXandY.
CGR CondensateGasRatio
Ct TotalCompressibility
e ISSN: 2395 0056
p ISSN: 2395 0072
Thedatausedislackinginthegeologicaldimension of (Area in acres) needed to estimate HC reserve usingthevolumetricmethodwhichwould enable some comparative analysis of HC reserve using differentmethods.
Cw WaterCompressibility
EOR EnhancedOilRecovery
GA GasAnalysis
GAP GeneralAllocationPackage
QC QualityCheck
GOR GasOilRatio
IPM IntegratedProductionModeling
IPR InflowPerformanceRelationship
K Permeability
KrgmaxMaximumGasRelativePermeability
krwmax MaximumWaterRelativePermeability
MBAL MaterialBalance
MRTLL MinimumRatetoLiftLiquids
N STOIIP
Np CumulativeHydrocarbonProduction
OGIP OriginalGasinPlace
PETEX PetroleumExperts
Pres AverageReservoirPressure
PROSPER ProductionandSystemsPerformance AnalysisSoftware
PVT Pressure,Volume,andTemperature
PVTP Pressure,Volume,andTemperature
Package
Pwf
AverageFlowingBottomHolePressure
Q BottomHoleFlowRate
Qmax MaximumFlowRate
Qmin MinimumFlowRate
qg GasFlowRate
RD Outer/InnerRadiusRatio
RP ProducingGasOilRatio
Rs SolutionGasOilRatio
w WellRadius
Sgmax MaximumGasSaturation
Sgr ResidualGasSaturation
STOIIP StockTankOriginalOilinPlace
Swc ConnateWaterSaturation
T Time
Noalarmingvarianceisobservedshowingthatthe use of MBAL for estimation of HC reserve is appropriate else a dynamic model like Eclipse wouldhavebeenrecommended.
Bg GasFormationVolumeFactor
Bgi
InitialGasFormationVolumeFactor
BHP BottomHolePressure
Bo OilFormationVolumeFactor
Boi
InitialOilFormationVolume
Factor value:
T Temperature
U AquiferConstant
VLP VerticalLiftProfile
WGR WaterGasRatio
WHP WellheadPressure
WHR WellheadRates
Z CompressibilityFactor
Viscosity
GasDensity
LiquidDensity
Porosity
9001:2008
International Research Journal of Engineering and Technology (IRJET)
Volume: 09 Issue: 04 | Apr 2022 www.irjet.net
[1] SIFUENTES, W., MORENO, J., KUMARAN, P., et al. “SamarangIntegratedOperations(IO): IntegratedAsset Modeling An Innovative Approach for Long Term ProductionPlanningFocusedonEnhancedOilRecovery”.In: SPE/IATMI Asia Pacific Oil & Gas Conference and Exhibition SocietyofPetroleumEngineers,2015.
[2]Yuxiwang“IntegratedProductionModelingtoassessthe effect of Subsea water separation” Rio de Janeiro: UFRJ/COPPE,2019.
[3]OKAFOR,C.C.“BreakingtheFrontiersforEffectiveFlow Assurance Using Integrated Asset Models (IAM)". In: SPE Arctic and Extreme Environments Conference and Exhibition.SocietyofPetroleumEngineers,2011.
[4] BINIWALE, S., NITURA, J., SIFUENTES, W., et al. “IntegratedLiveAssetModeling ANecessitytoUnlockOil inMatureFieldsAchievingTrueIntegratedOperationsIO". In: International Petroleum Technology Conference. InternationalPetroleumTechnologyConference,2016.
[5] SAPUTELLI, L. A., RUDOLPH, S. R., EMBSER, J. T. “IntegratedProductionModelCalibrationAppliedtoaGulfof MexicoSub SeaField".In:SPEIntelligentEnergyConference andExhibition.SocietyofPetroleumEngineers,2010.
[6]ROTONDI,M.,COMINELLI,A.,DIGIORGIO,C.,etal.“The BenefitsofIntegratedAssetModeling:LessonLearnedfrom FieldCases".In:SPEEuropec/EAGEAnnualConferenceand Exhibition.SocietyofPetroleumEngineers,2008.
[7] LIGNY, F., ROBERTS, I., JAMES, D., et al. “Integrated Subsea Supplier Led Solution: A Case Study". In: Offshore Technology Conference. Offshore Technology Conference, 2018.
[8] MBAL Petroleum Experts 2018, User manual, MBAL Edinburgh,Scotland,PetroleumExpertsLtd.
[9]DILULLO,A.,MANTEGAZZA,T.,OMARINI,P.,etal.“From IntegratedAssetModeltoIntegratedFlowAssuranceModel: AStepForwardintheDesignofComplexO&GFields".In OffshoreMediterraneanConferenceandExhibition.Society ofPetroleumEngineers,2011.
[10]COATS,B.,FLEMING,G.,WATTS,J.,etal.“AGeneralized Wellbore and Surface Facility Model, Fully Coupled to a Reservoir Simulator", SPE Reservoir Evaluation & Engineering,v.7,n.02,pp.132 142,2004.
[11] GHORAYEB, K., HOLMES, J., TORRENS, R., et al. “A General PurposeControllerforCouplingMultipleReservoir Simulations and Surface Facility Networks". In: SPE Reservoir Simulation Symposium. Society of Petroleum Engineers,2013.
© 2022, IRJET
e ISSN: 2395 0056
p ISSN: 2395 0072
[12] DEMPSEY, J., PATTERSON, J., COATS, K., et al. “An Efficient Model for Evaluating Gas Field Gathering System Design", Journal ofPetroleumTechnology,v.23,n.09, pp. 1067 1073,1971.
[13] HOOI, H., GOOBIE, L., COOK, R., et al. “The Integrated TeamApproachtotheOptimizationofaMatureGasField". In: SPE Gas Technology Symposium. Society of Petroleum Engineers,1993.
[14]STARTZMAN,R.A.,BRUMMETT,W.,RANNEY,J.,etal. “Computer Combines Offshore Facilities and Reservoir Forecasts",PetroleumEngineer,v.65,1977.
[15] EMANUEL, A. S., RANNEY, J. C. “Studies of Offshore Reservoir with an Interfaced Reservoir/Piping Network Simulator",JournalofPetroleumTechnology,v.33,n.03,pp. 399 406,1981.
[16] Integrated Production modeling 2018, User manual, Edinburgh,Scotland,PetroleumExpertsLtd.
[17] NAZAROV, R., ZALAMA, P., HERNANDEZ, M., et al. “Integrated Asset Modeling in Mature Offshore Fields: Challenges and Successes". In: SPE Biennial Energy ResourcesConference.SocietyofPetroleumEngineers,2014.
[18]ALAIGBA,D.,ORODU,O.D.,AGUILERA,M.“Production OptimizationintheDukeFieldUsingtheIPMSuite".In:SPE Nigeria Annual International Conference and Exhibition. SocietyofPetroleumEngineers,2016.
[19]AGEH,E.A.,ADEGOKE,A.,UZOH,O.J.“UsingIntegrated ProductionModeling(IPM)asanOptimizationToolforField Development Planning and Management". In: Annual SPE International Conference and Exhibition. Society of PetroleumEngineers,2010.
[20]KABDENOV,S.,AITKAZIN,M.,MACARY,S.,etal.“IPM ToolforStrategicDecisions:DiverseApplicationsofIPMin the Supergiant Tengiz Field". In: International Petroleum TechnologyConference.InternationalPetroleumTechnology Conference,2014.
[21]ONBERGENOV,U.,AITKAZIN,M.,TANG,Y.,etal.“Best PracticesinCalibrationofIntegratedProductionModeling for Tengiz Field". In: SPE Annual Caspian Technical ConferenceandExhibition.SocietyofPetroleumEngineers, 2017.
[22] GONG, X., SIMMS, G., FOWLER, R., et al. “Integrated Reservoir Study of the Who Dat Field". In: Offshore Technology Conference. Offshore Technology Conference, 2018
[23]GinaVegaRiveros,LuigiSaputelli,JosePatino,Alejandro Chacon,RomeoSolis.“ReserveEstimationuncertaintyina matureNaturally fracturedCarbonateFieldLocatedinLatin
Impact Factor value: 7.529 | ISO 9001:2008 Certified Journal
770
Volume: 09 Issue: 04 | Apr 2022 www.irjet.net
America”.OffshoreTechnicalConference,BrazilheldinRio Janeiro,Brazil,4 6October2010.
[24]Tuong VanNguyen,YuriM.Barbosa,JulioA.M.daSilva, SilviodeOliveiraJunior,“Anovelmethodologyforthedesign andoptimizationofoilandgasoffshoreplatforms”,Energy, Volume 185, 2019, Pages 158 175, ISSN 03605442. https://doi.org/10.1016/j.energy.2019.06.164.
[25]HATVIK,M.,NORGARD,J.P.,BERG,K.,etal.“Optimized FieldDevelopmentthroughIntegratingFieldNetworkwith DynamicReservoirModelMethods".In:OffshoreTechnology Conference.OffshoreTechnologyConference,2018.
[26]Ottah,D.G.,Ikiensikimama,S.S.,andS.A.Matemilola. “Aquifer Matching with Material Balance Using Particle SwarmOptimizationAlgorithm PSO”.Paperpresentedat the SPE Nigeria Annual International Conference and Exhibition, Lagos, Nigeria, August 2015. DOI:https://doi.org/10.2118/178319 MS.
[27] PROSPER Petroleum Experts 2009, User Manual, PROSPER, Edinburgh,Scotland,Petroleum ExpertsLtd.
[28] GAP Petroleum Experts 2009, User Manual, GAP, Edinburgh,Scotland,PetroleumExpertsLtd.
Factor value: 7.529 | ISO 9001:2008 Certified
e ISSN: 2395 0056
p ISSN: 2395 0072