Key words-Monitoring, Temporal changes, Remote Sensing and Geographical information System, Topographical maps.
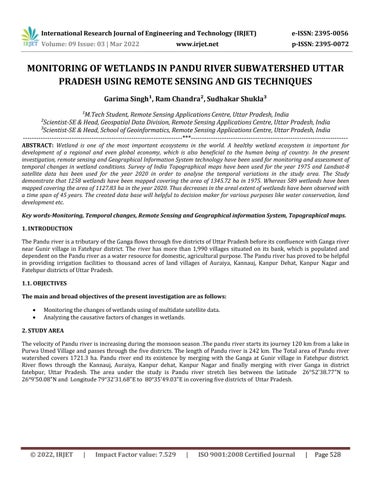
River flows through the Kannauj, Auraiya, Kanpur dehat, Kanpur Nagar and finally merging with river Ganga in district fatehpur, Uttar Pradesh. The area under the study is Pandu river stretch lies between the latitude 26°52'38.77"N to 26°9'50.08"Nand Longitude79°32'31.68"Eto 80°35'49.03"Eincoveringfivedistrictsof UttarPradesh.
Garima Singh¹, Ram Chandra², Sudhakar Shukla³
ThePanduriverisatributaryoftheGangaflowsthroughfivedistrictsofUttarPradeshbeforeitsconfluencewithGangariver near Gunir village in Fatehpur district. The river has more than 1,990 villages situated on its bank, which is populated and dependentonthePanduriverasawaterresourcefordomestic,agriculturalpurpose.ThePanduriverhasprovedtobehelpful in providing irrigation facilities to thousand acres of land villages of Auraiya, Kannauj, Kanpur Dehat, Kanpur Nagar and FatehpurdistrictsofUttarPradesh 1.1.
³Scientist SE & Head, School of Geoinformatics, Remote Sensing Applications Centre, Uttar Pradesh, India ***
Analyzingthecausativefactorsofchangesinwetlands.
ThevelocityofPanduriverisincreasingduringthemonsoonseason.Thepanduriverstartsitsjourney120kmfromalakein PurwaUmedVillageandpassesthroughthefivedistricts.ThelengthofPanduriveris242km.TheTotalareaofPanduriver watershed covers 1721.3 ha. Pandu river end its existence by merging with the Ganga at Gunir village in Fatehpur district.
Certified Journal | Page528
2. STUDY AREA
MONITORING OF WETLANDS IN PANDU RIVER SUBWATERSHED UTTAR PRADESH USING REMOTE SENSING AND GIS TECHNIQUES
International Research Journal of Engineering and Technology (IRJET) e ISSN: 2395 0056 Volume: 09 Issue: 03 | Mar 2022 www.irjet.net p-ISSN: 2395-0072 © 2022, IRJET | Impact Factor value: 7.529 | ISO 9001:2008

1. INTRODUCTION
TheOBJECTIVESmainandbroad objectives of the present investigation are as follows:
Monitoringthechangesofwetlandsusingofmultidatesatellitedata.
²Scientist SE & Head, Geospatial Data Division, Remote Sensing Applications Centre, Uttar Pradesh, India
¹M.Tech Student, Remote Sensing Applications Centre, Uttar Pradesh, India
ABSTRACT: Wetland is one of the most important ecosystems in the world. A healthy wetland ecosystem is important for development of a regional and even global economy, which is also beneficial to the human being of country. In the present investigation, remote sensing and Geographical Information System technology have been used for monitoring and assessment of temporal changes in wetland conditions. Survey of India Topographical maps have been used for the year 1975 and Landsat 8 satellite data has been used for the year 2020 in order to analyse the temporal variations in the study area The Study demonstrate that 1258 wetlands have been mapped covering the area of 1345.72 ha in 1975 Whereas 589 wetlands have been mapped covering the area of 1127.83 ha in the year 2020 Thus decreases in the areal extent of wetlands have been observed with a time span of 45 years. The created data base will helpful to decision maker for various purposes like water conservation, land development etc.
International Research Journal of Engineering and Technology (IRJET) e ISSN: 2395 0056 Volume: 09 Issue: 03 | Mar 2022 www.irjet.net p-ISSN: 2395-0072 © 2022, IRJET | Impact Factor value: 7.529 | ISO 9001:2008 Certified Journal | Page529 Fig -1: Location Map
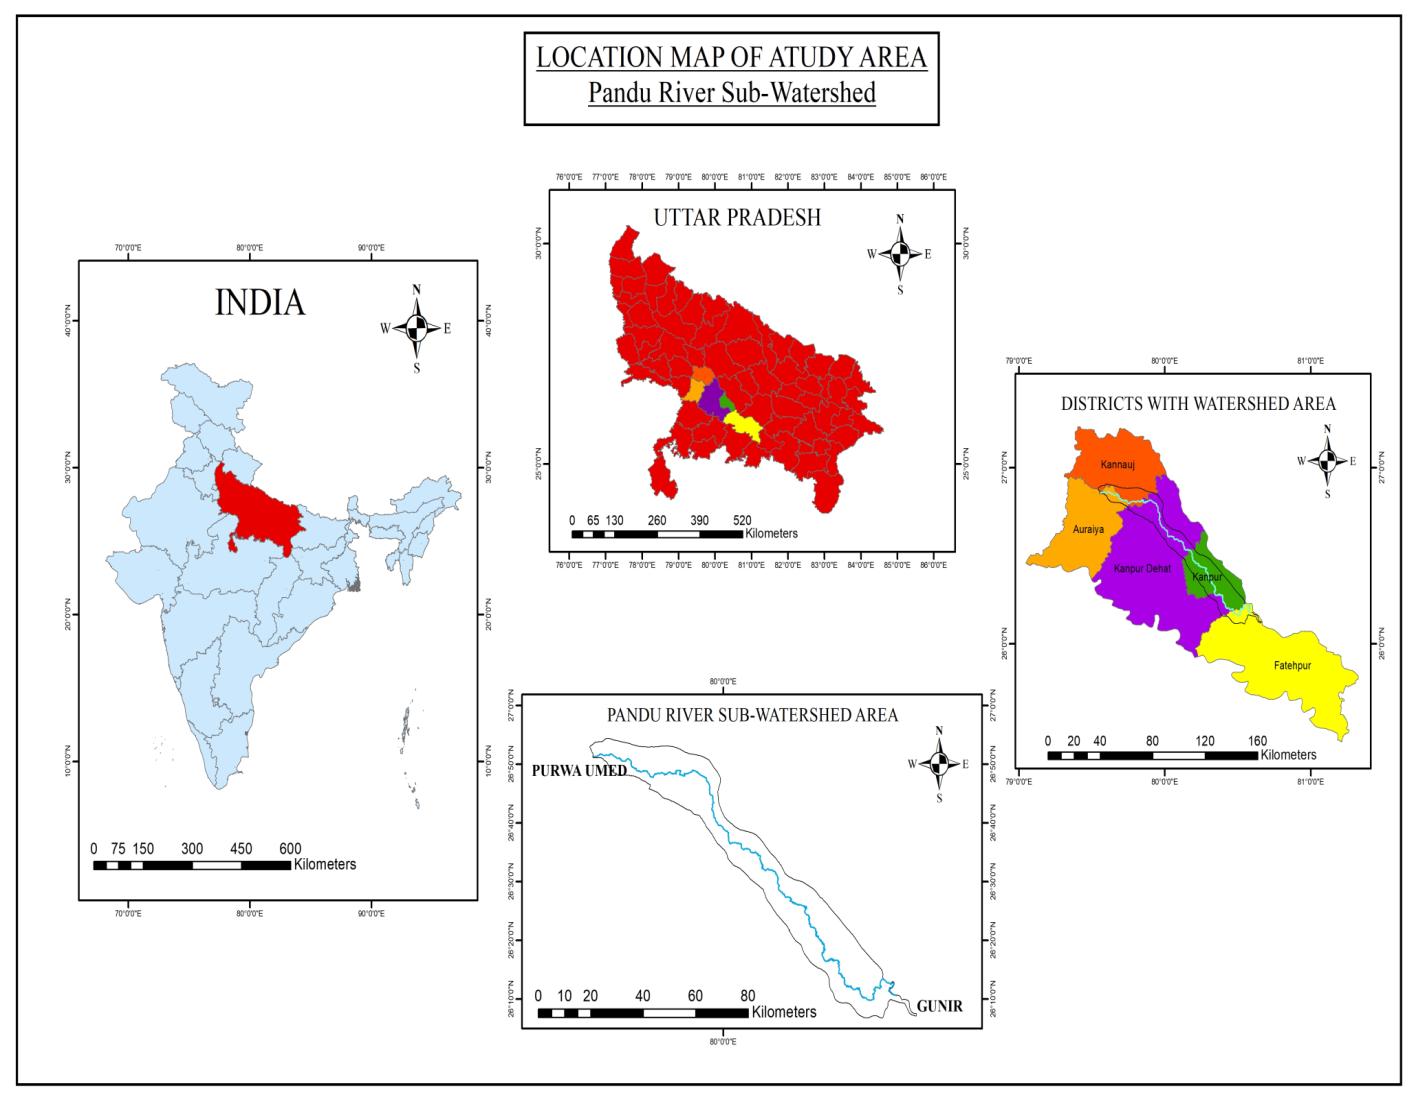
International Research Journal of Engineering and Technology (IRJET) e ISSN: 2395 0056 Volume: 09 Issue: 03 | Mar 2022 www.irjet.net p-ISSN: 2395-0072 © 2022, IRJET | Impact Factor value: 7.529 | ISO 9001:2008 Certified Journal | Page530 Fig -2: Study Area 3. MATERIAL AND DATA USED 3.1. DATA USED The following data and materials were used for achieving the objectives of the study: SURVEYOFINDIA TOPOGRAPHICALSHEETS SOITopographicalsheetscorrespondingto 54N/9,54N/13,54N/14,63B/2,63B/3, 63B/6,63B/7,63B/8,63B/11, and63B/12fortheyear1975. SATELLITE DATATable 1. Image acquisition details S.No. MissionLANDSAT TypeSensor Acquisition 1 5 TM 30,Oct2010 2 8 OLI 22,Oct2013 3 8 OLI 12,Oct2015 4 8 OLI 09,Oct2020 3.2. SOFTWARE USED ArcGIS
International Research Journal of Engineering and Technology (IRJET) e ISSN: 2395 0056 Volume: 09 Issue: 03 | Mar 2022 www.irjet.net p-ISSN: 2395-0072 © 2022, IRJET | Impact Factor value: 7.529 | ISO 9001:2008 Certified Journal | Page531
4. METHODOLOGY


ToposheetswasdownloadedfromNaksheportalwhichareprovidedfromSurveyofIndiaatascaleof1:50,000hasbeenused toextracttheinformationaboutthestudyareafortheyear1975.Thecorrespondingtoposheetsweregeoreferencedusingthe UniversalTransverseMercatorprojectionsystemintheworldreferencesystem(WGS84)datum.Landsat 8(TM/OLI)satellite datafortheyears2010,2013,2015and2020weredownloadedfrom(https://earthexplorer.usgs.gov/). Themethodologyinthisstudycontainsdifferentapproachesformappingandmonitoring ofwetlands.Theworkflowapplied inthisstudyisshownin Fig
3 Fig -3: Flow diagram of methodology GEOREFERENCING INTERPRETATION& DIGITIZATIONINTEGRATION AND ANALYSIS OF TEMPORAL CHANGES IN WETLANDS SURVEY OF INDIA TOPOSHEET DOWNLOAD DOWNLOADDATA LANDSAT DATA DOWNLOAD SATELLITE INTERPRETATIONPROCESSINGIMAGE&DIGITIZATION
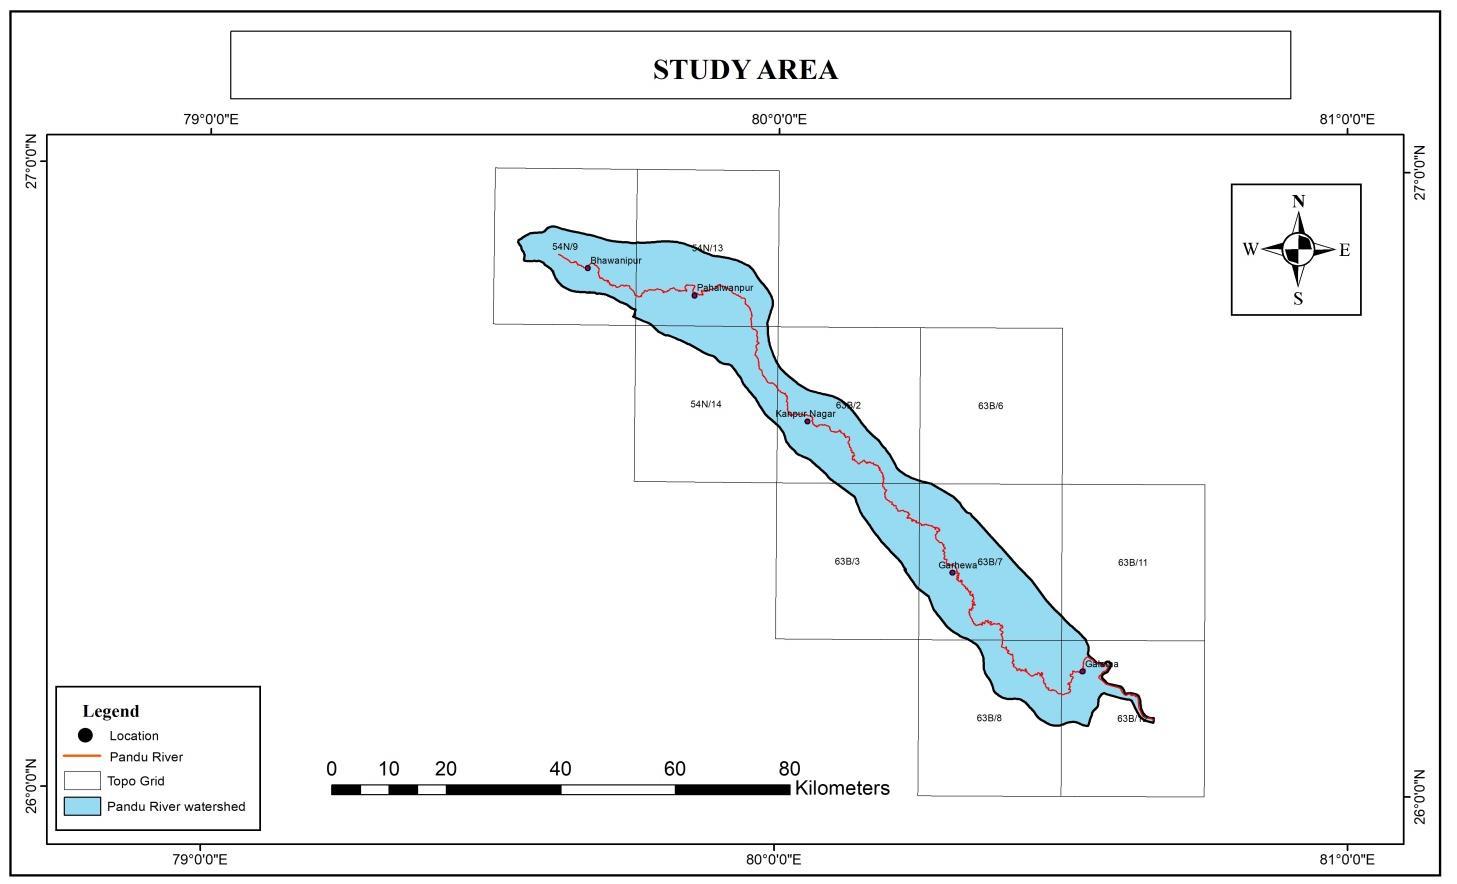
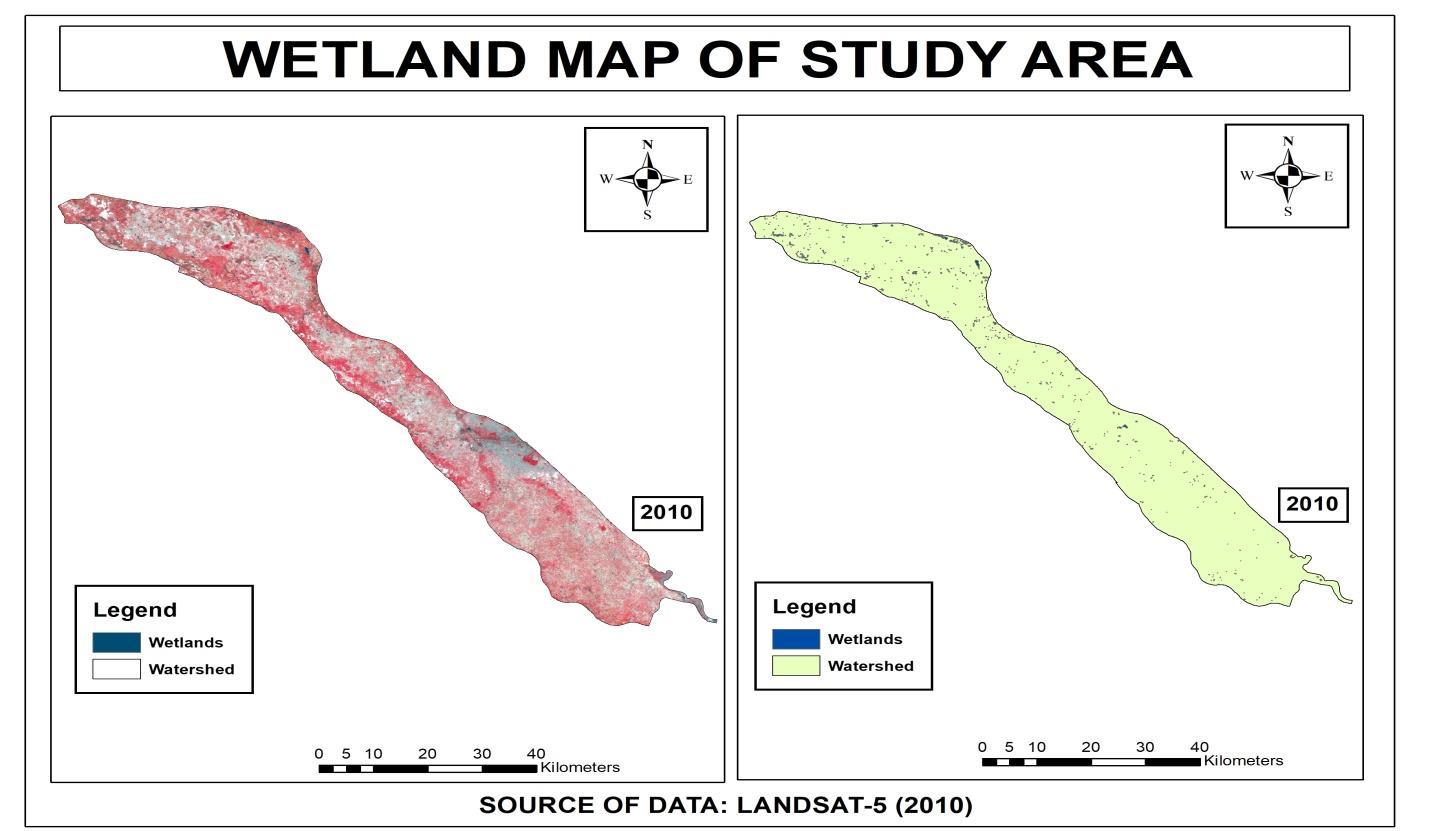
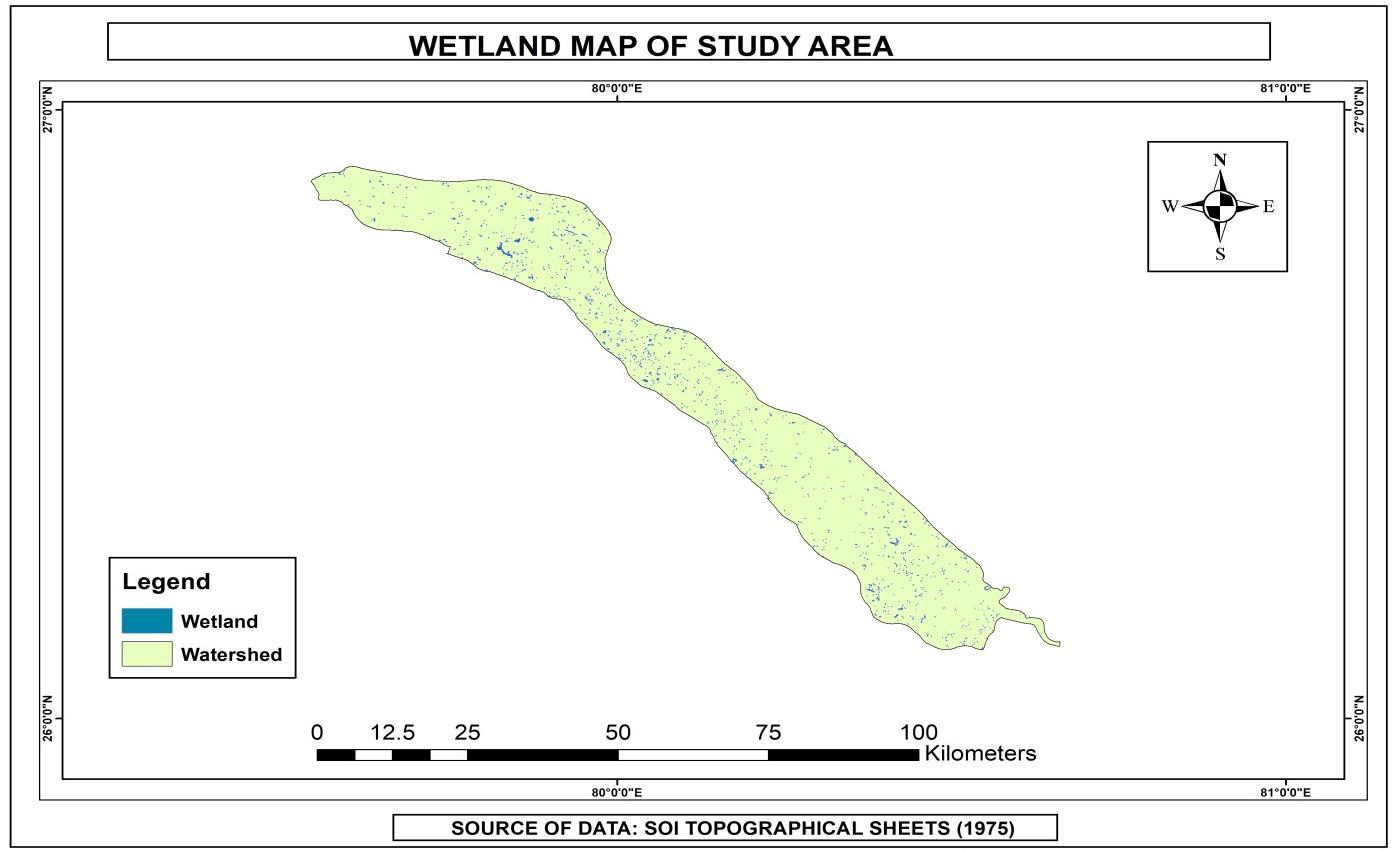
International Research Journal of Engineering and Technology (IRJET) e ISSN: 2395 0056 Volume: 09 Issue: 03 | Mar 2022 www.irjet.net p-ISSN: 2395-0072 © 2022, IRJET | Impact Factor value: 7.529 | ISO 9001:2008 Certified Journal | Page532 5. RESULTS AND DISCUSSIONS Fig 4: Wetlands generated from SOI Fig 5: Wetland generated from LANDSAT 5 satellite Image
International Research Journal of Engineering and Technology (IRJET) e ISSN: 2395 0056 Volume: 09 Issue: 03 | Mar 2022 www.irjet.net p-ISSN: 2395-0072 © 2022, IRJET | Impact Factor value: 7.529 | ISO 9001:2008 Certified Journal | Page533 Fig-6: Wetland generated from LANDSAT-8 satellite image Fig 7: Wetland generated from LANDSAT 8 satellite image
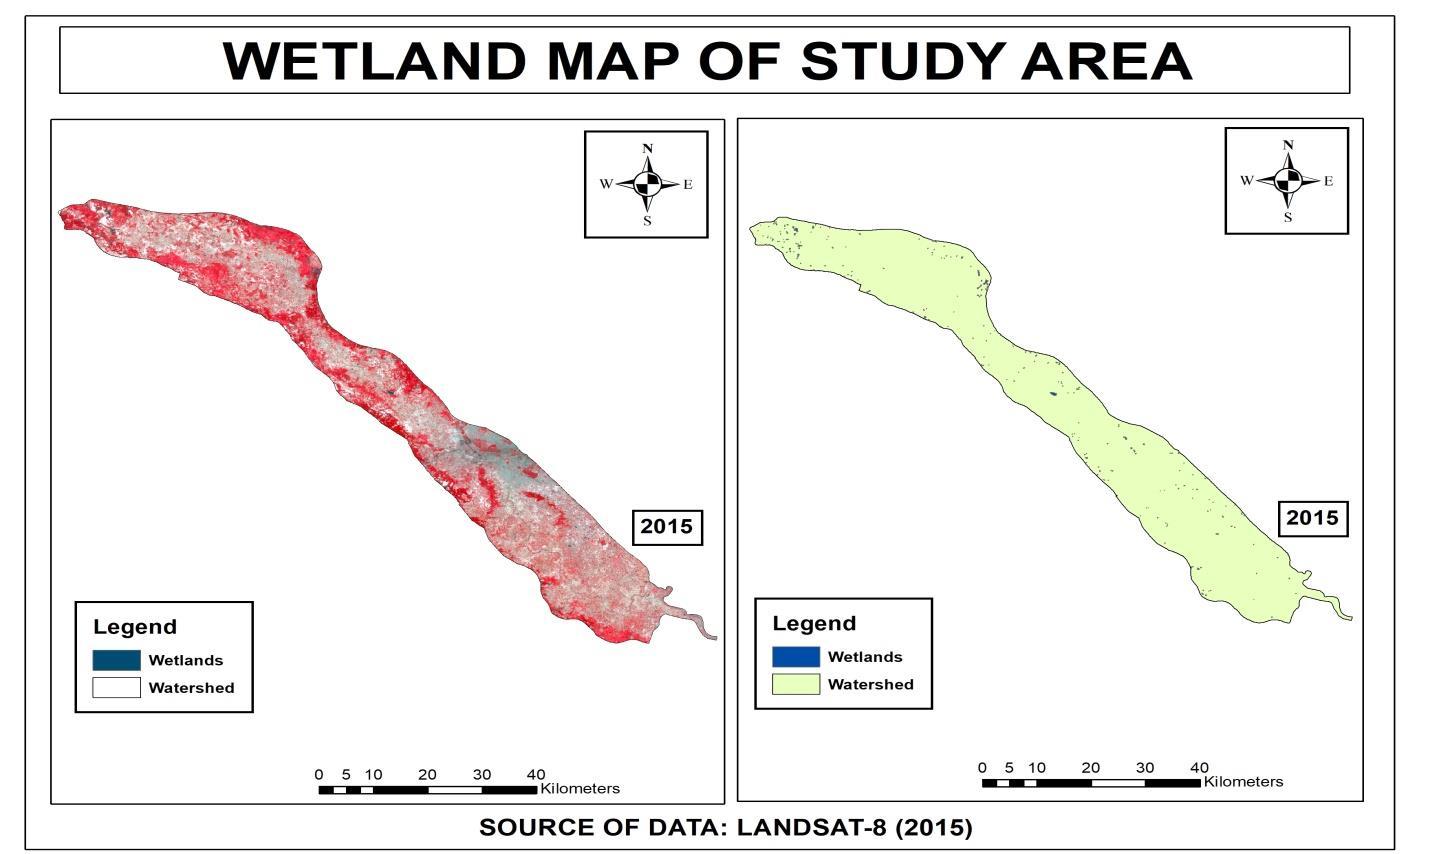
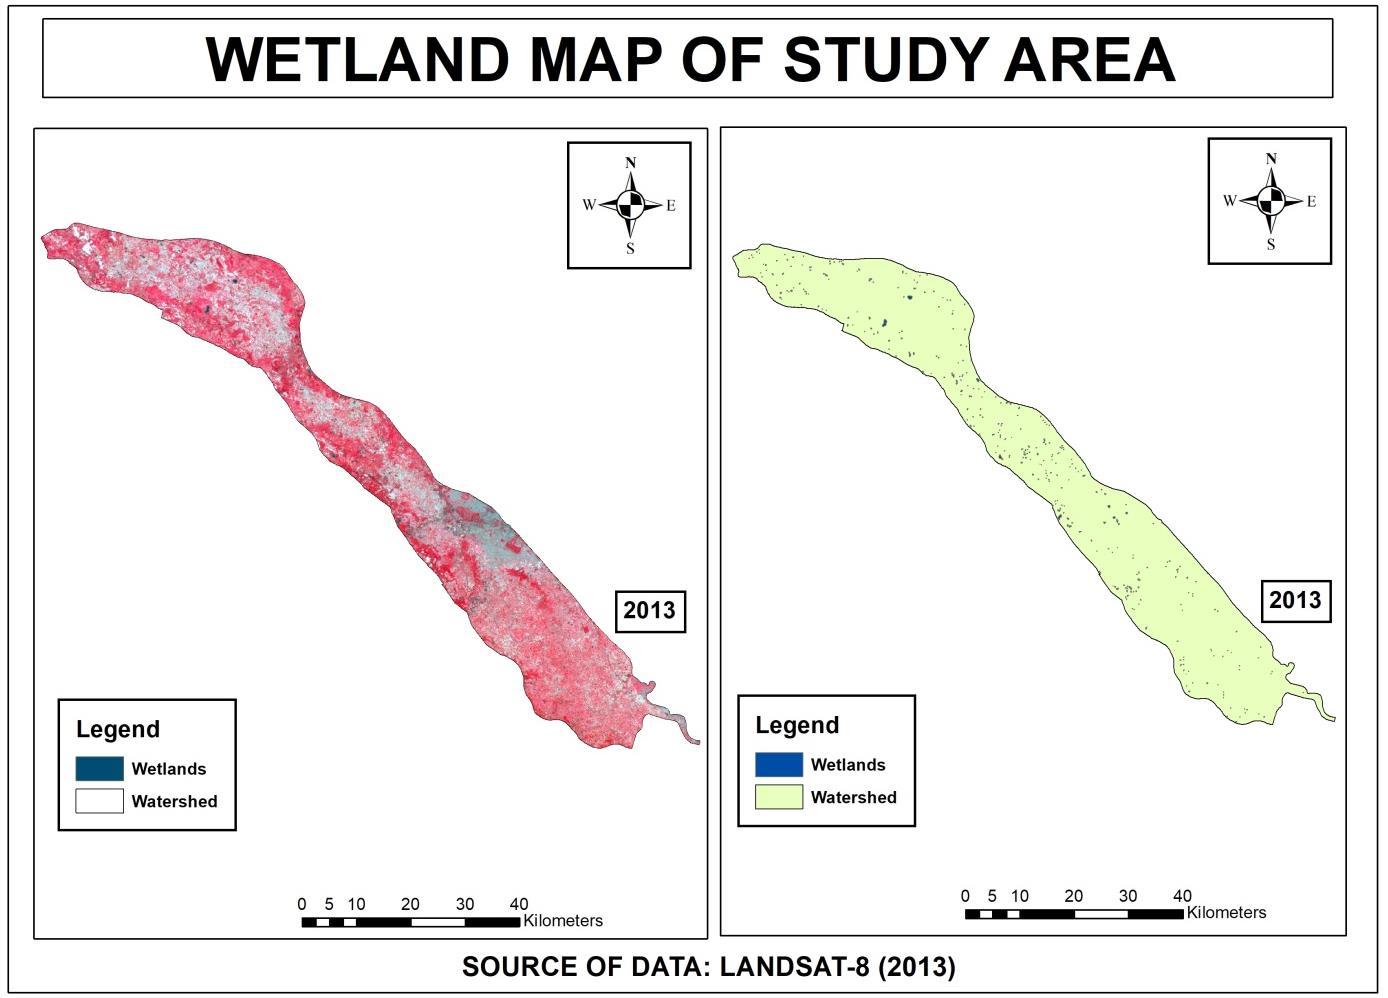
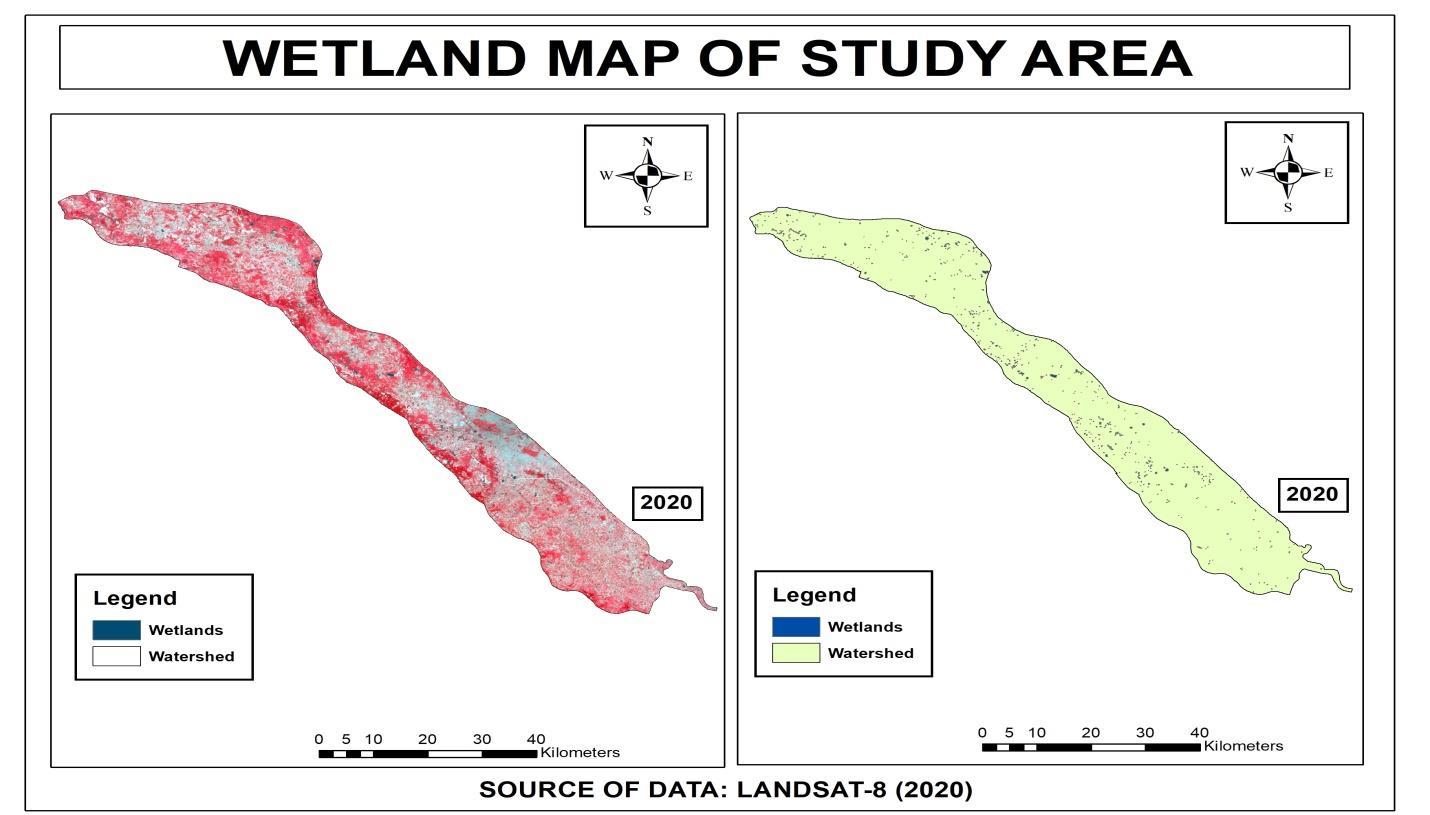
International Research Journal of Engineering and Technology (IRJET) e ISSN: 2395 0056 Volume: 09 Issue: 03 | Mar 2022 www.irjet.net p-ISSN: 2395-0072 © 2022, IRJET | Impact Factor value: 7.529 | ISO 9001:2008 Certified Journal | Page534 Fig 8: Wetland generated from LANDSAT 8 satellite image TABLE 2: TEMPORAL CHANGES IN WETLANDS IN DIFFERENT YEARS Year Number of Wetlands Area of Wetlands (in ha) SOI (1975) 1258 1345.72 2010 524 1200.21 2013 365 756.62 2015 238 563.21 2020 589 1127.2 These figures shows the extracted wetlands for the years 1975, 2010, 2013, 2015 and 2020 respectively and changes in the wetlands were observed. The Northeast average rainfall for our study area was 191.75 mm in the year 1975 and number of wetlands were 1258 have been depicted with the area of 1345.72 ha. However in the year 2010 the average rainfall for our studyareawas55.75mmandnumberofwetlandswere524havebeendepictedwiththearea1200.20ha.Whichdemonstrate decreases in the areal extent of wetlands between the years 1975 and 2010 due to decreasement of rainfall. Similarly in the years2013and2015theaveragerainfallforourstudyarearespectively76.64mmand29.94mmbutrainfallswereincreased in the year 2013 are compared to 2010. The numbers of wetlands were for the year 2013 and 2015 respectively correspondingto365and238withtheareaofrespectively756.62haand563.21ha.Thustheareaofwetlandswasdecreased intheyear2015duetoless rainfall incomparisonoftheyear 2013.Theaverage rainfall fortheyear2020was higher inthe comparisonoftheyear2015duetohighrainfallwith46.38mmrainfall.Thusanincreaseintheinthearealextentofwetlands
In the present study land use land cover mapping as well as temporal wetland changes were analyzed using multi date LANDSAT satellite data Which demonstrate decrease in areal extent of wetlands due to decline in annual rainfall and encroachment within the wetland area. This decline in wetlands leads to depletion of ground water level in the study area Thusconservationandmonitoringofwetlandsarehighlyessentialtoprovidebalancetotheecosystem
MacAlister Charlotte and Mahaxay Manithaphone, “Mapping wetlands in the Lower Mekong Basin for wetland resourceandconservation managementusing LandsatETMimagesandfieldsurveydata”,Journal ofEnvironmental Management,Volume90,No.7,2009,pp.2130 2137
Czajkowski, K., Torbick, N., & Lawrence, P. (2007). Application And Assessment Of A Giscience Model For JurisdictionalWetlandsIdentificationInNorthwesternOhioWetlandandWaterResourceModelingandAssessment: AWatershedPerspective(pp.2 12):CRCPress.
7. REFERENCES
Page
Ramachandra, T.V., Kiran, R., & Ahalya, N. (2002). Status, conservation and management of wetlands. New Delhi: AlliedPublishers.
with the numbers 589 have been depicted with an area 1127.2 ha in the year 2020 which was greater than numbers of wetlandsintheyear2015.Therefore,thedecreasesinthearealextentofwetlandshavebeenobservedfromtheyear1975to 2020.
Baker,C.,Lawrence,R.,Montagne,C.,&Patten,D.,“MappingwetlandsandriparianareasusingLandsatETM+imagery anddecision tree basedmodels”Wetlands,Volume26,No.2,2006,pp.465 474.
Civco,D.,Hurd,J.,Prisloe,S.,&Gilmore,M.(2006).Characterizationofcoastalwetlandsystemsusingmultipleremote sensingdatatypesandanalyticaltechniques.PaperpresentedattheIEEEInt.Conf.Geosci.RemoteSens.Symp.2006 (IGARSS2006).
Baker,Corey,RickL.Lawrence,CliffordMontagne,andDuncanPatten,“Changedetectionofwetlandecosystemsusing Landsatimageryandchangevectoranalysis”,wetlands,Volume27,No.3,2007,pp.610 619
Rani, M., Kumar, P., Yadav, M., &Hooda, R. S., “Wetland Assessment and Monitoring Using Image Processing Techniques:ACaseStudyofRanchi,India”,JournalofGeographicInformationSystem,Volume3,No.4,2011,pp.345 350
6. CONCLUSION
Ramachandra, T.V. (2002). Restoration and management strategies of wetlands in developing countries. Electronic GreenJournal,15.RetrievedNovember24,2007
International Research Journal of Engineering and Technology (IRJET) e ISSN: 2395 0056 Volume: 09 Issue: 03 | Mar 2022 www.irjet.net p-ISSN: 2395-0072 © 2022, IRJET | Impact Factor value: 7.529 | ISO 9001:2008 Certified Journal | 535
Butera,M.K.(1983).Remotesensingofwetlands.IEEETransactionsonGeoscienceandRemoteSensing(3),383 392.