Two-way Load Flow Analysis using Newton-Raphson and Neural Network Methods
Abstract This research presents a study of the optimal power flow for networked microgrids with multiple renewable energy sources (PV panels and wind turbines), storage systems, generators, and load. The OPF problem is performed using a conventional method and an Artificial Intelligence method. In this research, we investigated the performance of MGs system with renewable energy integration with focus on power flow studies. The calculation of the power flow is based on the well known Newton Raphson method and Neural Network method. The power flow calculation aims to evaluate the grid performance parameters such as voltage bus magnitude, angle, real and reactive power flow in the system transmission lines under given load conditions. The standard test system used was a benchmark test system for Networked MGs with four MGs and 40 buses. The data for the entire system has been chosen as per the IEEE Standard 1547 2018. The results showed minimum losses and higher efficiency when performing OPF using NN than the Newton Raphson method. The efficiency of the power system for the networked MG is 99.3% using Neural Network and 97% using the Newton Raphson method. The Neural Network method, which mimics how the human brain works based on AI technologies, gave the best results and better efficiency in both cases (Battery as Load/Battery as Source) than the conventional method.

Keywords: Optimal Power Flow, Microgrid, Newton Raphson,NeuralNetwork.
1. Introduction
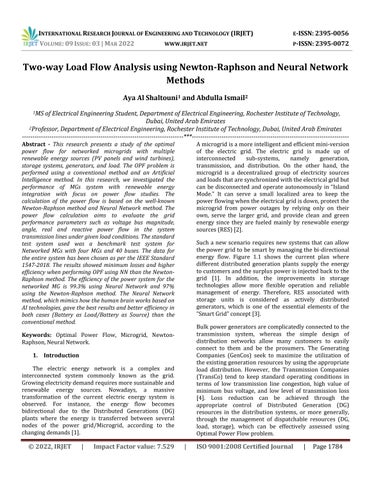
The electric energy network is a complex and interconnected system commonly known as the grid. Growingelectricitydemandrequiresmoresustainableand renewable energy sources. Nowadays, a massive transformation of the current electric energy system is observed. For instance, the energy flow becomes bidirectional due to the Distributed Generations (DG) plants where the energy is transferred between several nodes of the power grid/Microgrid, according to the changingdemands[1].
Amicrogridisamoreintelligentandefficientmini version of the electric grid. The electric grid is made up of interconnected sub systems, namely generation, transmission, and distribution. On the other hand, the microgrid is a decentralized group of electricity sources andloadsthataresynchronizedwiththeelectricalgridbut can be disconnected and operate autonomously in “Island Mode.” It can serve a small localized area to keep the powerflowingwhentheelectricalgridisdown,protectthe microgrid from power outages by relying only on their own, serve the larger grid, and provide clean and green energy since they are fueled mainly by renewable energy sources(RES)[2].
Such a new scenario requires new systems that can allow thepowergridtobesmartbymanagingthebi directional energy flow. Figure 1.1 shows the current plan where different distributed generation plants supply the energy tocustomersandthesurpluspowerisinjectedbacktothe grid [1]. In addition, the improvements in storage technologies allow more flexible operation and reliable management of energy. Therefore, RES associated with storage units is considered as actively distributed generators, which is one of the essential elements of the “SmartGrid”concept[3].
Bulkpowergeneratorsarecomplicatedlyconnectedtothe transmission system, whereas the simple design of distribution networks allow many customers to easily connect to them and be the prosumers. The Generating Companies (GenCos) seek to maximize the utilization of theexistinggenerationresourcesbyusingtheappropriate load distribution. However, the Transmission Companies (TransCo) tend to keep standard operating conditions in terms of low transmission line congestion, high value of minimum bus voltage, and low level of transmission loss [4]. Loss reduction can be achieved through the appropriate control of Distributed Generation (DG) resources in the distribution systems, or more generally, through the management of dispatchable resources (DG, load, storage), which can be effectively assessed using OptimalPowerFlowproblem.
Aya Shaltouni
1.1.Objectiveand Methodology
TheemploymentoftheOPFinsmartgridsisregardedasa newdevelopmentinpowersystemstudies.Therefore,this work aims to study the optimal power flow problem in microgrid by determining the best way to optimize the flow of power using the Newton Raphson approach and the Neural Network approach. The optimization of the power flow using the Newton Raphson method and Neural Network method will be performed using simulation. In addition, the impacts of the distributed generations, renewable energy sources, storage systems, andEVChargingstationsareinvestigated.
1.2.WorkOrganization
SectionII gives an overview of previous publications covering OPF. SectionIII gives an overview of the Optimal Power Flow. Section IV highlights the study of OPF using Newton Raphson method. In SectionV, the OPF Study using the Neural Network is analyzed. Discussions and conclusionsaredrawninSectionVIandVIIrespectively.
Fig 1.1 CurrentScenarioofthepowergrid.
2. LiteratureReview
Lin and shen [5] showed that utilizing renewable energysourcestoreducecarbonemissionandminimizing the fuel cost for energy saving in the OPF problem will reduce the global warming effect from the power generationsector.Inthispaper,a DPOPF(distributedand parallel OPF) algorithm for the smart grid transmission system with renewable energy sources was proposed to account for the fast variation of the power generated by renewableenergysources.TheproposedDPOPFalgorithm combines the recursive quadratic programming method, and the Lagrange projected gradient method. The proposed algorithm can achieve the complete decomposition and be implemented in the smart grid transmission system to make distributed and parallel computation possible. results confirm that the computing speed of the proposed DPOPF algorithm is fast enough to
cope with the fast variations of the power generated by renewable energy sources. A PSO (Particle Swarm Optimization) was presented in [6] to find the most optimal locations and sizes of DGs, with the objective function to minimize the system's total cost, real power loss, and the number of the installed DGs. Firstly, a radial distributionpowerflow(PF)algorithmisexecutedtofind the global optimal solution. Then, with respect to voltage profile,THDandlossreductionandbyusingthesensitivity analysis,PSOisusedtocalculatetheobjectivefunctionand to verify bus voltage limits. To include the presence of harmonics, PSO was integrated with a harmonic power flow algorithm (HPF). The proposed (PSO HPF) based approachwastestedonanIEEE15 busradialdistribution system. According to the authors, these scenarios yield efficiencyinimprovementofvoltageprofileandreduction of THD and power losses; it also permits an increase in power transfer capacity and maximum loading. According to Pazheri et al. [7], an economic/environmental dispatching(EED)problemformulationwaspresentedfor a hybrid system that comprises thermal units, the solar, wind, and storage unit. The study was simulated using MATLAB/Simulink. A consistent optimum EED was obtainedbyextractingmaximumrenewableenergyduring their availability and using them for both available and unavailable periods with the aid of their storages. In [8], Atwa et al. proposed a probabilistic planning technique to allocate various DG types (wind, solar, biomass) in the distribution system with an Objective Function to minimize the energy loss. The results reveal that regardless of the combination of the renewable resources usedtocalculatetheoptimalfuelmix,thereisasignificant reduction in the annual energy loss. An optimal control modelofaheatpumpwaterheater(HPWH)suppliedbya wind generator PV grid system was presented in [9] with anOFistominimizetheoverallenergycost.Thisproblem was solved using a mixed integer linear program. The resultsshowa70.7%costreductionuponimplementation of this intervention. Sanseverino et al. [10] showed an execution monitoring and re planning approach to solve the optimal generation dispatch problem in smart grids with OF to minimize the carbon emissions, production costs and improve the quality. The replanning module is based on a heuristic multi objective optimizer able to efficiently incorporate constraints. The obtained results were encouraging and suggest to incorporate into the Microgrids software technology approaches for managing uncertainties.Asmartenergymanagementsystem(SEMS) was presented in [11] to optimally organize the power productionofDGsourcesandenergystoragesystems and minimize the microgrid operational costs. The results show that the forecasting model is able to predict hourly
power generation according to the weather forecasting
Similarly,inputs.
an optimal energy management system of storage devices in grid connected microgrids was presentedin[12],wherethestoredenergyiscontrolledto balancetheloadsandrenewablesourcesandminimizethe total cost of energy at the PCC (Point of Common Coupling).Bracaleetal.[13]presentedanoptimal control approach for a DC microgrid that included dispatchable (micro turbine) and non dispatchable (PV generator) units, storage system, and controllable/non controllable loads. It was designed to achieve a minimum daily total energy cost and it shows that the power provided by the dispatchable unit and the storage system allowed the minimization of the daily costs of energy. A novel OPF algorithm for islanded microgrid was presented in [14], where it provides minimum losses and a stable operating pointwithrelevantdroopparametersusedtoregulatethe primary voltage and frequency. Shen et al. [15] presented anenergymanagementschemecontainingbatterystorage, diesel generators, PV, and wind. As a result, the proposed energy management system is effective in engineering practice and beneficial for both the microgrid and the customers. Hassanzadehfard et al. [16] employed battery banks as long term storage and ultra capacitors as short term storage to control the frequency in a microgrid. The simulation results showed that considering interruptible loads for the microgrid results in cost reduction for the
Themicrogrid.development
of EVs technology has a significant impactonmicrogridoperations.Yuetal.in[17]analyzeda model to find the effect of EV technology on demand response mobility. Numerical results show that EVs mobility of symmetrical EV fleet is able to achieve synchronous stability of network and balance the power demandamongdifferentdistricts.Moreover,Laureri et al. [18] presented an optimization technique to integrate the EVs into the smart grids. The results prove that the integration of electric vehicles in the smart grids can help in sustaining the grid processes when parked and so playing in costs minimization. Paterakis et al. [19] developed an optimization technique to minimize the energy procurement costs of a smart household. Coordinationstrategywasproposedinordertosatisfythe transformer capacity limits while promoting its economically fair usage by the households. Lin et al. [20] utilized an active power limitation strategy to reduce PV power injection during peak solar irradiation to avoid deviationsinvoltage.Theresultsshowthatthecontrolfor PV power rejection increases the installation capacity of a PV system to make full use of solar energy resources and
to maximize the net present value of a PV system investment. Moreover, a study was conducted in [21] to find the optimal design of a PV/Battery hybrid system regarding PV modules' numbers, the PV module's tilt, batteries numbers, and capacities. Results show that the choice of installation place and of the system type can significantlyaffecttheoptimizationresultssignificantly.In particular,theoptimumPVmoduletiltanglevaluechanges according to electrical energy demand of the domestic utility.In[22],anoptimizationofthepowerflowofthePV system connected to the grid was presented. It was performed by calculating the root of the active and reactivepowerequationusingNewton'sRaphsonmethod. Simulation results have shown the maximum value of the active power system at 1000 W/m2 irradiation was 408 W,asthereactivepowerisneededonly11.82Var.In[23], an application for optimization of the energy flows in smart power systems consisting of electric vehicles (EV), distributed energy sources (DER), flexible loads, and bidirectional storage is proposed, as well as an optimization model for energy distribution between electricvehicles,electricstoragedevices,andphotovoltaic generators. A nonlinear optimization problem with linear constraintsforoptimizingthepowerflowsinthesystemis defined and solved. A multi objective problem is determinedtosatisfyPVproductioncriteriaandmaximize the power flow to the EVs. An algorithm for finding the optimal solution to the multi objective optimization problem is also proposed. The approach is beneficial for energy flow control and analysis of DER behavior. The algorithm proposed for solving the multi objective problem is applicable when storage and PV generation unitsareusedintheDERsystem.
Rigo Marianietal.[3]investigated differentprocedures for the optimal power dispatching of a grid connected prosumer with energy storage consisting of a high speed flywheel. According to the paper, optimal off line scheduling for the day ahead aims to minimize the cost with regard to the daily energy rates and consider the forecasts for both consumption and production. That dispatching is performed using global optimization procedures based on a trust region method or a niching genetic algorithm. Another approach developed by the authors in [3] is using step by step optimization and exploiting an original self adaptive dynamic programming strategy. Kim and Lavrova [24] used an advanced optimization method to present optimal power flow and energy sharing among smart buildings. The authors claimed that this method could improve the smart grid's optimal power flow and energy sharing stability among smartbuildingsandenhanceenergydissipationbalanceto reach stability among many smart buildings in the smart
Kegrid.et
al. [25] presented a new probabilistic OPF (POPF) model with chance constraints that reflect the uncertainties of wind power generation (WPG). The results show the satisfactory accuracy of the PLF (ProbabilisticLoadFlow)method,andtheeffectivenessof theproposedP OPFmodel.In[26],aprobabilisticACOPF (POPF) was presented, considering the load variation, stochastic wind behavior, and variable line's thermal rating. It was observed that a reduction on the mean cost and also on the probability of reaching higher generation costs was obtained when dynamic limits where used. An optimizationsystemtocalculatetheoptimaloperationofa system comprising electric vehicles and offshore wind farms connected to the grid through an HVDC link was presented in [27]. It has been shown that the uncertainty associated with availability of power from wind farm and PEVs affects the overall cost of operation of system. Lin and Lin [28] proposed a risk limiting optimal power flow (RLOPF) problem for systems with high wind power penetration; the aim was to address the issue of possibly violatingthesecurityconstraintsin powersystemsdue to theinstabilityofwindpowergenerations.
3. OptimalPowerFlow
3.1. OPFofConventionalPowerGrid
Load flow, also known as a power flow, is a network solution that displays currents, voltages, and real and reactive power flows at each bus and lines in the power system. The calculation of power flow necessitates the solution of non linear equations. It can calculate the transmission system's electrical response to a specific set of loads and generator power outputs. Carpentier presented Optimal Power Flow in 1962 [4]. The OPF is typically a non linear and non convex problem with Objective Function that must be optimized (maximized or minimized), a set of equality and inequality constraints that must be satisfied, and a problem solving method. Specifically, OPF optimizes a given Objective Function controlling power flow throughout an electrical system without violating power flow constraints or operational limits [4]. In other words, each power plant's actual and reactive power should be scheduled so that the total operatingcostiskepttoaminimum.Thus,itcanhelpgrid operators address various challenges in grid planning, operation,andcontrol. OPF canalsobeusedtodetermine pricesontheday aheadmarket[29].Someoftheextended OPFversionsareillustratedbelow[4]:
SCOPF: It selects the optimal control settings for thebasesystemtominimizetheobjectivefunction whileensuringthatnoviolationsoccur.
DC OPF: The reactive power and transmission lossesarenottakenintoaccount.
ACOPF:IthastodowiththeACgridandisbased on the system's natural PF characteristics. As a result, the outputs of this type of OPF are more precise.
MixedAC/DCOPF:itisrelatedtothe OPF inboth ACandDCgrids.
OPF has been solved using a variety of conventional optimization methods such as Linear Programming method, Non linear Programming method, Quadratic Programming method, Newton’s method, and Interior Point method [30]. However, all of these methods have their own set of benefits and drawbacks which will be discussedfurther.
3.2.OPFProblemFormulation
The following is a description of a general minimizationproblem:
Minimize: f(x,u) (the objective function) where f(x,u)istheobjectivefunction.
Subject to: hi(x,u) = 0, i = 1,2,3,…. m (equality constraints) where hi(x,u) is set of equality constraints.
gi(x,u) ≤ 0, j =1,2,3, …. n (inequality constraints) where gi(x,u) is set of inequality constraints, u represents a set of controllable and xrepresentsdependentvariables.
3.3.Objectivefunction
These objective functions vary from fuel cost generation, active and reactive power transmission loss, reactive power reserve margin, security margin index, and emissionenvironmentalindex[31].
3.3.1. MinimizationofGenerationFuelCost
ThekeyobjectiveoftheOPFsolutionistoreducethe system's total operating costs. When there is a light load, the cheapest generators are always chosen to run first. More expensive generators will be brought in as the load increases. As a result, the operational cost plays a critical
part in the OPF solution. The amount of fuel or input to a generatorisusuallymeasuredinBritishthermalunitsper hour(Btu/hr)andtheoutputinmegawatts(MW)[30].
In all practical cases, the cost of generator i can be shown asafunctionofrealpowergeneration, Ci=[ai+(biPi)+(ciPi2)]*fuelcost (3.1) whichisexpressedinexpressedin$/hr
WherePiistherealpoweroutputofgeneratori,andai,bi, ciarethecostcoefficients.
The incremental cost can be obtained from the derivative ofCiwithrespecttoPi, dCi/dPi=(bi+2ciPi)*fuelcost (3.2) whichisexpressedin$/MWhr.
3.3.2. Minimization of Active Power TransmissionLoss
The OPF problemgoal isto minimize thepower loss. Theformulationoftherealpowerlosscanberepresented by Minimizing[31]:PLoss=ΣPi=ΣPgi ΣPdi,i=1,…….,Nb(3.3) where PLoss is the total I2R loss in the transmission lines andtransformersofthenetwork.
3.3.3. Minimization of Reactive Power TransmissionLoss
The total VAR loss is minimized as per the following equation[31]:
MinimizingQLoss=ΣQgi ΣQdi,i=1,….,Nb (3.4)
3.4.Controland DependentVariables
There are two relevant variables in an optimization problem: independent/control variables and dependent/state ones. Firstly, the optimal value must be determined for control variables to help minimize the objective function, and then, based on it, state variables shouldbecalculated[4].
In the OPF problem, control variables may include active power generation of all generator buses except slack bus, the voltage of all generator buses, transformers tap ratio, reactive power injection of shunt capacitor banks, etc. Moreover,dependent variablesmayalsoincludean active
power output of the slack bus, voltage angles of all buses excluding the slack bus, load bus voltages, reactive power generation of generators. It should be noted that the numberofcontrolvariablesdeterminesthesolutionspace. Infact,a problem withn control variablesresultsin an n dimensionalsolutionspace[4].Theclassificationofpower systembusesisshowninTable3.1[31].
Table 3.1: ClassificationofPowerSystemBuses.
Classifications Knowns Unknowns LoadBus P,Q V,δ GeneratorBus P,V Q,δ Slack(Swing)bus V,δ P,Q
3.5.Equality constraints
Both the physicality of the power system and the required voltage set points are reflected in the OPF's equalityconstraints.Thepowersystemphysicsisenforced by power flow equations that require that actual and reactivepowerinjectionforeachbusamounttozero[30].
Thiscanbeattainedbythefollowinganalysis:
Pi =PLoad +PLoss (3.5)
Qi =QLoad +QLoss (3.6)
where Pi and Qi aretheactiveand reactivepower outputs respectively.P
Load and QLoad are the active and reactive load powerPrespectively.
Loss andQLoss aretheactiveandreactivepowerloss Therespectively.powerflow
equationsofthenetworkcanbegivenas:
G(V,δ)=0(3.7) where G(V,δ)=Pi(V,δ) Pinet,Qi(V,δ) Qinet,Pm(V,δ) Pm net (3.8)
wherePi andQi arethecalculatedrealandreactivepower atPQbusrespectively
Pinet and Qinet are the specified real and reactive powerforPQbusrespectively
Vandδarethemagnitudeandphaseangleofvoltage atdifferentbusesrespectively
3.6.Inequalityconstraints
Components and equipment in the power system have operational limitations created to ensure system security andminimizetherequiredobjectivefunction[30].
Inequalityconstraints:
Pgimin ≤Pgi ≤Pgimax (3.9)
Qgimin≤Qgi ≤Qgimax (3.10)
ΣPgi PD PLoss =0 (3.11)
wherePgi istheamountofgenerationinMWatgeneratori. Qgi istheamountofgenerationinMVARatgenerator
Thei.
inequalityconstraintsonvoltagemagnitudeVof each PQbus
Vimin ≤Vi ≤Vimax (3.12)
where Vi min and Vi max are the minimum and maximum valuesofvoltagesatbusi.
The inequality constraints on phase angle δ of voltages at allbusesi
δimin ≤δi≤δimax (3.13)
where δimin and δimax are the minimum and maximum valuesofphaseangleatbusi.
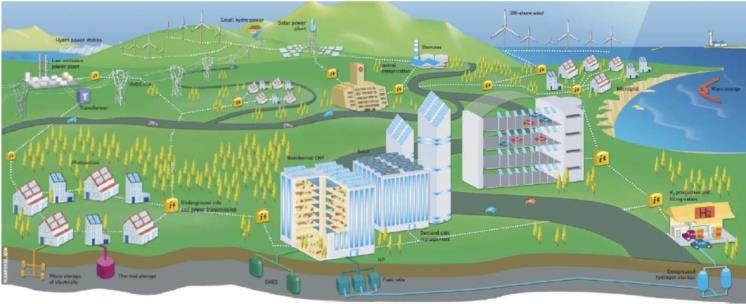
For a typical Microgrid system, the basic components are giveninTable3.2[12]:
Table 3.1 TypicalMicrogridcomponents.
WherethePCCcorrespondstothe“slack”bus.Itisalways indexedasbus1.
3.7. Conventional Vs Recent Optimization Methods forOPF
TheConventionalmethods arebasedonlinearObjective Functions that apply sensitivity analysis and gradient based optimization algorithms. The conventional optimizationmethodsareillustratedbelow[32]:
3.7.1. LinearProgrammingmethod
LP method is one of the fully developed methods now in commonuse.Iteasilyhandlesinequalityconstraints.Non linear objective functions and constraints are handled by linearization [33]. LP method is used for linearizing the problems of non linear system optimization; it is reliable. It has a good convergence feature, but the main shortcoming is that errors may occur due to digital computerrounding,especiallyunderconstraints.
3.7.2. Non-LinearProgrammingmethod
NLPisaprocessofsolvinganoptimizationproblemwhere the constraints and the OF are non linear. It helps to find the best solution to a problem using constraints that are not linear. The non linear method (NLP) is more precise
than the linear method, where non linear objective functions and constraints can be applied. The NLP techniquesusetheLagrangemultipliertousethereduced gradient method. The significance of this method is that it can be applied in a large scale system, whereas the disadvantages are that some system components are not takenintoconsideration[32].
3.7.3. QuadraticProgrammingmethod
Aparticularnonlinearprogrammingapproachcanbeseen in quadratic programming (QP), where the objective function is quadratic, and the constraints are linear. The determination of gradient steps is not necessary for this method.Thesolutionthat hasbeen obtainedusingthe QP Method is more accurate compared to the previous methods. In addition, it has fast convergence characteristics[32].
3.7.4. Newton’s method
The Newton Method is commonly used in power flow problems by applying second order partial derivatives to create the Lagrangian. It is a high speed convergence method, but it may give problems with inequality constraints. It was proved that Newton Raphson converged in many cases. Moreover, most Newton Raphson power flow problems converge in less than ten iterations. The disadvantages are that the Newton Raphson method requires high computer storage and computation time, and it is very much sensitive to the selectionofinitialconditions[33].
3.7.5. InteriorPointmethod
IP method is one of the fully developed and widely used methodsforOPF.TheIPmethodisgenerallyusedforlarge problems to solve the optimal power problem [32]. However,theresultsachievedbyIPresultsarebetterand require fewer iterations than LP. It easily handles inequalityconstraints[33].
The conventional methods are not always appropriate for optimizingthepowerflowsincetheoptimalpowerflowis a non linear (non convex) problem. Therefore, new optimizationmethodsareintroducedtosolvetheOPF.The advantagesoftheserecentmethodsarethefollowing[32]:
1. They can be applied in small and large scale systems
2. Ithasahighreliability
3. They converge rapidly compared to the conventionalmethods.
The recent optimization methods can be classified as follows[32]:
SwarmandBio inspiredOptimizationTechniques
The natural and bio inspired algorithm is an emerging approach based on the inspiration of the moving and lookingbehaviorofanimalsorbirdsforfoodsources.
Human InspiredOptimizationTechniques
Various techniques of optimization simulate human behavior,particularlywhenitcomestothinkingormaking decisions.
Physics InspiredOptimizationTechniques
Algorithms based on physics are conceptualized in space throughphysicslawsornaturalphenomena.
Evolutionary InspiredOptimizationTechniques
Evolutionary optimization algorithms come from natural selection mechanics and genetics or living bodies or animals.
HybridOptimizationTechniques
Several algorithms have been proposed for hybrid optimization to gain advantages of multiple techniques andobtainbetterresultsthansingletechniques.
Artificial Neural Network (ANN) and Fuzzy Logic
networks (ANNs) are computational methods that emulate the operation of biological neural networks. At the same time, the fuzzy set theory is a naturalandappropriatetoolforinaccuraterelations.
4. Networked MicrogridTestSystem
A Microgrid can connect with the main grid by a DGcontrolentitytoservelocalloads.Thebalancebetween the generation and load must be kept under all operating conditions to keep the frequency and voltage of MGs withinoperatinglimits.TheseDGsmaybedispatchableor non dispatchable.Forexample,thepowergenerationfrom PV panels and wind turbines is usually non dispatchable. Incontrast,thepoweroutputfromthemicroturbines,fuel cells, combined heat and power (CHP), and diesel generatorsarefullydispatchable.Thegrid,whichservesas
theMG'sslack bus,handlesthisbalanceingrid connected mode. While in an islanded mode, dispatchable DG must havesufficientcapacitytobalanceloadandgenerationand avoidloadshedding.
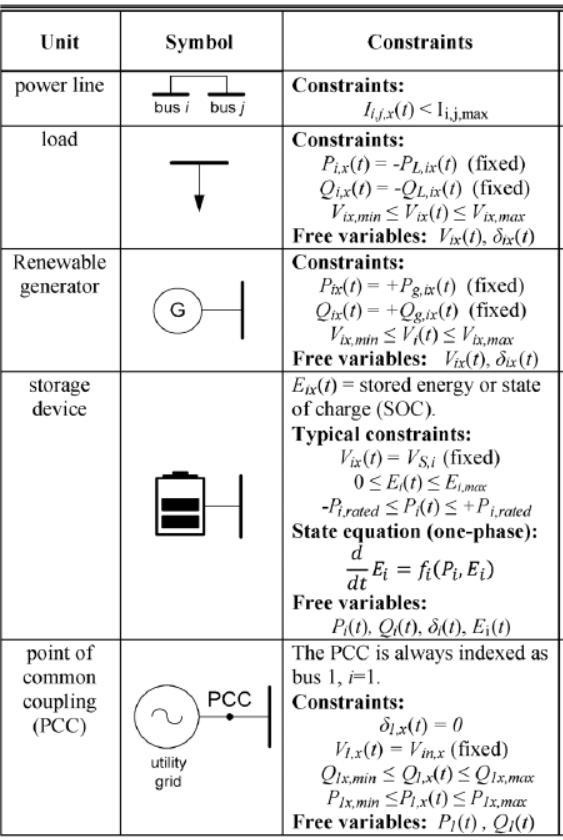
Figure 4.1 shows the electrical single line diagram of the test system with comprehensive buses, loads, and generation. A three digit number is used to identify each bus in the system. All lines, including the tie lines, are underground cables. Table 4.1 shows more details on the fourmicrogrids[34].
The first bus of each microgrid (101, 201, 301, and 401) servesastheslackbusofthatmicrogrid,anditsequipped with two or three units of conventional Synchronous Generatorstoallowthemicrogridtofunctioneffectivelyin isolated mode, with load balancing and reactive power supported. Whileingrid connectedmode,theslack bus of microgrid1(101)istheslackbusonthecompletesystem [34]. Load and generation balance is performed through thisbus.
AsshowninTable4.1,microgrid 1consists of6 buses, 11 underground cables, and three standby Synchronous Generators, each of 5000 kVA connected to bus 101. Moreover,3PVpanelsareinstalledatbuses102,103,and 104. microgrid 2 consists of 9 buses, eight underground cables, and three standby Synchronous Generators at bus 201.Additionally,3PVpanels(atbuses202,203,and204) and 2 Wind Turbines (at buses 206 and 209) are always available to generate power to the network. microgrid 3 has 18 buses and 17 underground cables. Bus 301 has threestandbySynchronousGeneratorsand6PVpanels(at buses 303, 304, 305, 306, 307, and 315) and 2 Wind Turbines (at buses 314 and 317). Finally, microgrid 4 has seven buses and eight underground cables, 3 PV panels at (at buses 405, 406, and 407), and two standby Synchronous Generators installed at bus 401. All these standby SGs are of equal capacity and have self starting capability[34].
Thenetworkedmicrogridsystemisdesignedtooperateon 11 kV three phase underground cables. The utility feeder is a 33 kV three phase single circuit overhead line. In
addition, there are three 20 MVA parallel step down transformerstomaintainthevoltageof11kVatbus101.
Fig 4.1 Single linediagramoftheNetworkedMGstest system.
AsshowninFigure4.1,microgrid1cansharepowerwith microgrid 2 through PCC1 and microgrid 3 through PCC2. While microgrid 2 can share power with microgrid 3 throughPCC4andmicrogrid4withPCC3.microgrid3and microgrid4canexchangepowerthroughPCC5.Ifafailure occursinmicrogrid1,microgrid2and3canbeconnected to the utility grid directly to ensure the continuity of supply.
Table- 4.1 DetailsofMicrogridsofthetestsystem.
Components MG1 MG2 MG3 MG4 9
SlackBus 101 201 301 401 Type Meshed Radial Radial Meshed
The line and bus data are necessary to perform out an optimalpowerflowanalysis.Thedatafromthenetworked microgrid system lines such as resistance, reactance, and cable length is presented in Table 4.2 [34]. Moreover, Table4.3showsthetie cabledatabetweenthemicrogrids [34].
1 101 102 3 0.7661 1.18
2 101 103 2.4 0.7715 0.991 101 104 3 0.7661 1.18
4 101 105 1.6 0.514 0.6604 101 106 1.6 0.514 0.6604
6 102 103 2 0.6429 0.825
7 102 105 1.5 0.4822 0.619
8 103 104 2 0.6429 0.825
9 103 105 1.2 0.3857 0.495
10 103 106 1.2 0.3857 0.495
11 104 106 1.5 0.4822 0.619
12 201 202 1.4 0.4500 0.577
13 202 203 1.6 0.5143 0.660 202 206 1.5 1.9710 1.338
15 203 204 2.2 0.7072 0.908
16 203 207 1.4 1.8396 1.249
17 204 205 1.8 0.5786 0.743
18 204 208 1.2 0.3857 0.495
19 208 209 0.8 1.0512 0.714
20 301 302 1.2 0.3857 0.495
21 302 303 1.8 0.5786 0.743
22 302 309 1.5 0.4822 0.619
23 302 311 1.4 1.8396 1.249
24 303 304 1.2 0.3857 0.495
25 303 313 1.5 1.9710 1.338
26 304 305 1.4 0.4500 0.577 304 314 1.4 1.8396 1.249 305 306 1.6 0.5143 0.660
29 305 315 1.4 1.8396 1.249
30 306 307 1.5 0.4822 0.619
31 306 317 1.4 1.8396 1.249 307 308 1.5 1.9710 1.338
33 307 318 1.7 0.5465 0.701
34 309 310 1.5 0.4822 0.619 311 312 1.2 1.5768 1.071
36 315 316 1.2 1.5768 1.071
37 401 402 0.6 0.3148 0.260 401 405 1 0.5247 0.433
39 401 406 1.8 0.9446 0.780 402 403 2 1.0495 0.867
41 403 404 0.6 0.3148 0.260 404 407 1 0.5247 0.433 405 406 1.5 0.7871 0.650 44 406 407 1.5 0.7871 0.650
Table 4.3 PCC/Tie cablesData.
No.S. busFrom BusTo (km)Length (ResistanceP.U) (ReactanceP.U)
T1 102 201 1 0.2553 0.394
T2 104 301 1.5 0.3830 0.591
T3 208 401 2 0.6429 0.825
T4 205 310 2.5 0.8037 1.032
T5 404 0.3214
Aone yeardatasethasbeenprovidedinthissystem.Table 4.4 provides the load data for the Networked Microgrids [34]. Table 4.4 indicates that the overall system loads are 30.802MWand 6.374 MW, includingcritical loadsof6.16 MWand1.27MVAR.Inaddition,thetableliststhreetypes of buses: 1) Type 1 bus: Slack bus; 2) Type 2 bus: Generatorbus;3)Type3bus:Loadbus(PQbus).
Table- 4.4 LoadDataoftheNetworkedMGSystem.
TotalBusLoad CriticalLoad kVAR
101 1 0 0 0 0 0
102 2 2125 336 450 68 6.9
103 2 3329 1023 650 124 10.81
104 2 2050 555 200 50 6.66
105 3 1257 310 200 35 4.08
106 3 1056 240 200 35 3.43
201 2 600 100 0 0 1.95
202 2 1250 487 500 80 4.06
203 2 1203 410 500 80 3.91
204 2 1366 443 650 138 4.43
205 3 764 36 0 0 2.48
206 2 503 21 0 0 1.63
207 3 345 11 0 0 1.12
208 3 629 8 0 0 2.04
209 2 642 12 100 25 2.08
301 2 580 150 0 0 1.88 3 650 85 250 50 2.11 2 673 96 0 0 2.18
304 2 439 135 0 0 1.43 2 600 128 250 50 1.95 2 560 112 0 0 1.82 2 851 145 385 50 2.76 3 420 25 0 0 1.36 3 500 45 0 0 1.62 3 637 33 0 0 2.07 3 788 95 350 83 2.56 3 125 50 0 0 0.41 3 169 20 0 0 0.55 2 200 43 0 0 0.65 2 250 32 125 25 0.81 3 213 12 0 0 0.69 2 133 25 0 0 0.43 3 200 38 0 0 0.65 2 426 80 0 0 1.38 318 78 125 20 1.03
403 3 356 81 125 20 1.16
404 3 459 88 0 0 1.49
405 2 820 91 0 0 2.66
406 2 2500 635 850 150 8.12
407 2 816 60 250 44 2.65
LoadTotal 30802 6374 6160 1127 100
Basevoltage:11kV;Specifiedvoltageatallbuses:1p.u.
Table4.5presentsdetailsofDERsinstalledatdifferentMG locations.Excesspowerissavedinenergystoragesystems installed with each PV system to use the stored energy when the PV solar is unavailable. Also, the details of the SynchronousGeneratorsarepresentedinTable4.6[34].
Table- 4.5 InstalledCapacityofPVandWTinMGs.
IDBus TypeDG (kW)PG (kVAR)QGmin (QGmaxkVAR) AreaNetwork
102 PV 2000 0 400 MG1
103 PV 2400 0 480 MG1
104 PV 2000 0 400 MG1
202 PV 1600 0 320 MG2
203 PV 1600 0 320 MG2
204 PV 2400 0 480 MG2
206 WT 800 250 250 MG2
209 WT 500 200 200 MG2
303 PV 2000 0 500 MG3
304 PV 400 0 100 MG3
305 PV 800 0 160 MG3
306 PV 800 0 160 MG3
307 PV 800 0 160 MG3
314 WT 500 250 250 MG3
315 PV 800 0 160 MG3
317 WT 1200 600 600 MG3
405 PV 1600 0 320 MG4
406 PV 2400 0 500 MG4
407 PV 1600 0 320 MG4
Table 4.6 StandbySynchronousGeneratorsDatainMGs
IDBus (kVA)CapacityUnit ofNumberUnits (kVAR)QGmin (QGmaxkVAR) areaNetwork
101 5000 3 3000 5000 MG1
201 2000 3 1500 2000 MG2
301 2000 3 1500 2000 MG3
401 2000 2 1000 2000 MG4
The Energy Storage Systems are installed at different buses, which are Lithium ion batteries. With 80% of DOD.
The SoC of batteries is assumed to be 20% of their total capacity. The details of the ESS are shown in Table 4.7 [34].
Table 4.7 EnergyStorageCapacity. (BuaLocationID) (kWh)CapacityStorageBattery Peak (Kw)SupplyPower AreaNetwork
102 3000 2000 MG1
103 4000 2400 MG1 3000 2000 MG1 4000 1600 MG2 4000 1600 MG2 4000 2400 MG2 3600 2000 MG3 800 400 MG3 2000 800 MG3 2000 800 MG3 2000 800 MG3 2000 800 MG3 3000 1600 MG4 6000 2400 MG4 407 3000 1600 MG4
5. OPF in Microgrids using Newton-Raphson method
Forthenetworkedmicrogridsillustratedintheprevious chapter, an Optimal Power Flow study will be performed usingNewton Raphsonmethod.
5.1.Principle of Newton Raphsonmethod
Anonlinearequationinasinglevariablecanbeexpressed fas:(x)=0 (5.10)
For solving this equation, select an initial value x0. The difference between the initial value and the final solution is Δx. Then x1 = x0 +Δx is the solution of nonlinear equation(5.10).Thatis[35]:
f(x0+Δx)=0 (5.11)
ExpandingtheaboveequationwiththeTaylorseriesyields [35]:
f(x0+Δx)=f(x0)+f′(x0)Δx+(f′′(x0)(Δx)2)/2!+···+(f (n)(x0)(Δx)n)/n!+···=0 (5.12)
where f ′(x0), … , f (n) (x0) are the derivatives of the functionf(x).
If the difference Δx is very small (meaning that the initial valuex0isclosetothesolutionofthefunction),theterms of the second and higher derivatives can be neglected. Thus equation (5.12) becomes a linear equation as below [35]:
f(x0+Δx)=f(x0)+f′(x0)Δx=0 (5.13)
Then: Δx=−f(x0)/f′(x0) (5.14)
Thenewsolutionwillbe: x1=x0+Δx=x0−f(x0)/f′(x0) (5.15)
Since equation (5.13) is an approximate equation, the valueofΔxisalsoanapproximation.
Thusthesolutionxisnotarealsolution.Furtheriterations areneeded.Theiterationequationis[35]:
xk+1=xk+Δxk=xk−f(xk)/f′(xk) (5.16)
The iteration can be stopped if one of the following conditionsismet:
|Δxk|<��1or|f(xk)|<��2 (5.17)
where ��1, ��2, which are the permitted convergence precisions,aresmallpositivenumbers.
The Newton method can also be expanded to a nonlinear equationwithnvariables.
f1(x1,x2,…,xn)=0 f2(x1,x2,…,xn)=0
··
fn(x1,x2,…,xn)=0
For a given set of initial values x1, x2, … , xn, we have the correctedvaluesΔx1,Δx2,…,Δxn.Then:
f1(x1+Δx1,x2+Δx2,…,xn+Δxn)=0
f2(x1+Δx1,x2+Δx2,…,xn+Δxn)=0
··
fn(x1+Δx1,x2+Δx2,…,xn+Δxn)=0
Similarly, expanding the above equations and neglecting thetermsofsecondandhigherderivatives,amatrixcanbe formedtofindthesolutionatkthiteration[35]:
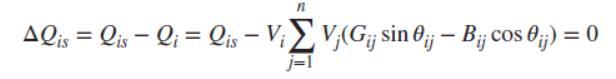
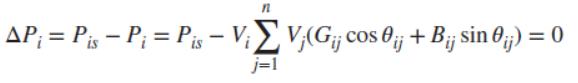
powerequation: where(525)
Pis, Qis are the calculated bus real and reactive powerinjections,respectively.
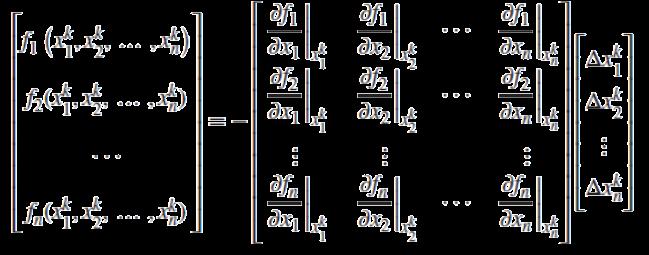
According to the Newton method, the power flow equations (5.24) and (5.25) can be expanded into Taylor series and the following first order approximation can be obtained[35]:
xk+1i=xki+Δxki i=1,2,…,n (5.18)
Theabovetwoequationscanbeexpressedas
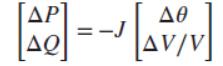
F(Xk)=−JkΔXk (5.19)

Xk+1=Xk+ΔXk (5.20)
whereJisann×nmatrixcalledaJacobianmatrix.
5.2. PowerFlowSolution
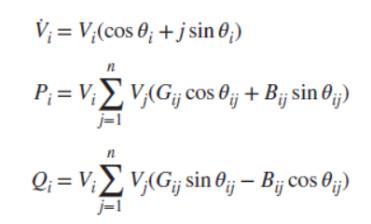
Thecomplexvoltage,realandreactivepowersofeachbus:
where(5.23)(5.22)(5.21)
��ij = ��i − ��j, which is the angle difference between busesiandj.
For each PV or PQ bus, we have the following real power mismatchequation:


