
3Associate Professor, Dept. of Civil Engineering S.T.B.C.E, Tuljapur (M.S.), India
International Research Journal of Engineering and Technology (IRJET) e ISSN: 2395 0056 Volume: 09 Issue: 03 | Mar 2022 www.irjet.net p ISSN: 2395 0072 © 2022, IRJET | Impact Factor value: 7.529 | ISO 9001:2008 Certified Journal | Page1722 “DESIGN OF WATER DISTRIBUTION NETWORK FOR DARFAL VILLAGE BY EPANET 2.0 SOFTWARE”

2. STUDY
1P.G. Student, S.T.B.C.E, Tuljapur (M.S.), India
Keywords: Pipe network, Flow, Daily demand, Discharge, EPANET 2.0 etc.
designphaseofwaterdistributionsystem,twoimportant consideration are essential first is to deliver adequate amounts of water to fulfill consumption requirements. Secondis,theefficientsystemofwatersupply;thedesired amount of water has to be made available daily for every individual. Now a day’s different modern software’s are available for the design purpose. The present work is aimed to design and analyze the water distribution networkusingEPANETSoftwareforvillageDarfal,District Solapur.
Nitin
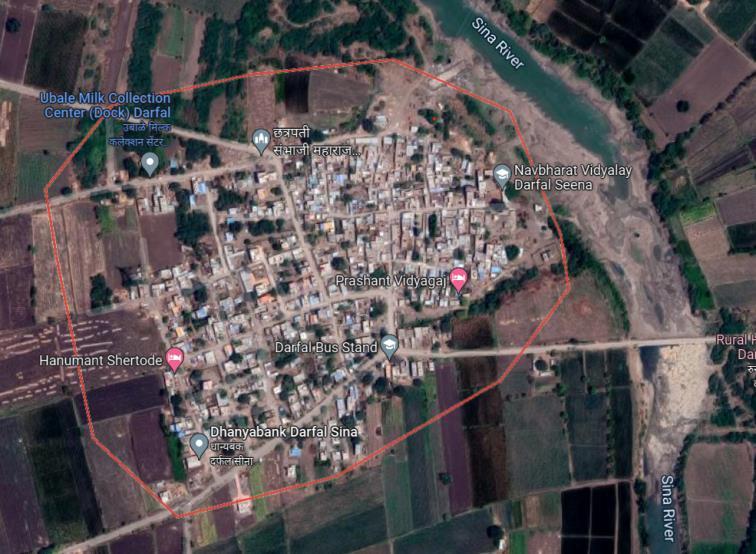
image of Darfal Village
Aim of this work is to design and analyze the water distribution network using EPANET Software for village Darfal, District Solapur. Water distribution network consistofelementslikepipes,tankspumpsandvalvesetc. All these components are connected to each other from source to consumer end. The first step of water supply engineer in planning of water distribution systems is to consider many factors like source and location of water, total demand, design period, future growth of population, sizes of pipes, loss of head, firefighting, leakages, etc It is also important to build a efficient network of water distribution which ensures adequate head at all points Maintainingdesigndischargeandpressureheadinoverall network of pipeline is good symbol of design. During the
***
To Design a efficient water supply distribution system for ruralareausingEPANET2.0software.
Abstract – Currently India has crossed 75 years of Independence. Notable technological development has been taken place in all sectors. The rural development of nation is the key area for progress of country. Because more than 70% population of India is living in village. Water is very essential human need. To fulfill this need is really challenging task for water supply department. It is the duty of local competent authority to fulfill the domestic need of water. A well planned water distribution network is essential helps to satisfy the need of water requirement. In the present study Darphal village’s Water Distribution Network (WDN) is designed which is located at district Solapur, State Maharashtra, India. While designing the water distribution network, forecasting of population is for two decades, per capita demand of water and also survey of the village is done. The survey of village used to determine contours, lengths and elevation distribution area. A road map is created. The EPANET 2.0 software is used to design water distribution network. EPANET 2.0 is useful software which is a computer program that performs extended period simulation of hydraulic and water quality behavior within pressurized pipe networks. EPANET tracks the flow of water in each pipe, the pressure at each node, the height of water in each tank etc.
Pawar1 , P.A. Hangargekar2 , S.C.Vadane3
2Research Guide & Head, Dept. of Civil Engineering, S.T.B.C.E, Tuljapur (M.S.), India
1. INTRODUCTION
1.2 Objectives of the study
1.1 Aim of the study
1.Toprovideadequateamountofwatertotheconsumers for drinkingpurpose.
AREASatellite
2.Tosupplywaterwithrequireddischargeandpressure.
In this work, the existing water distribution system is analyzedwiththehelpofEPANETinwhichthenumberof nodes, pipes, elevation and demand of Olpad village used. The main focused of this study is to analyzed the water distribution and identify the results in its analysis. The analysis was found that the resulting pressures at all junctionsandtheflowwiththeirvelocitiesatallpipesare enoughto provide the watertothestudy area. Thisstudy would help the water supple engineers in saving the time as it this process is fast and less difficult. To achieve basedemanddischargeshouldbeincreased.
It was developed by U.S Environmental protection agency’s national risk management research laboratory under the water supply and water resources division (formerly the drinking water research division). Due to public domain software it can be freely copied and distributed.Withinpressurizedpipenetworksitperforms extended period of simulation of hydraulic and water qualitybehavior
IX. Running Analysis Once connections are established and all data has been entered, the network is started for analysis. Warning messages are generated if negative pressuresarecreatedinthenodes.
IV. EPANET Once we converted layout in EPANET, all parameterssuchasunits,notations,colors,formulas,scale etc.wereselected.
VI.Input(BaseDemand) Thebaserequirementforeach node was calculated using the population and assuming a water requirement of 70 liters per day per capita and distributingitbetweeneachnodedependingonthelength ofpipesconnectedtoeachnode.
2) Extending EPANET capabilities with Add In Tools (2016)P.L.Iglesias,F.J.Martínez,J.V.Ribelles
1) Water Distribution Network using EPANET: A Case Study of Olpad Village,Surat district, Gujarat (Feb 2019)NishaPatel,AnkitaParmar
V. Input (Elevation) The essential data of elevation was enteredforeachnode/junctionfromAutoCADfile.
X. Correction To compensate for the negative pressure, increase the diameter of the pipe connected to the negative pressure node and rerun the analysis. This will continue until the negative pressure is gone and the run analysisshowsthemessage"Runsuccessfully".
International Research Journal of Engineering and Technology (IRJET) e ISSN: 2395 0056 Volume: 09 Issue: 03 | Mar 2022 www.irjet.net p ISSN: 2395 0072 © 2022, IRJET | Impact Factor value: 7.529 | ISO 9001:2008 Certified Journal | Page1723
In this work a new platform for information exchanging between EPANET and third parties’ programs have been developed. This new link allows using EPANET's GUI and simultaneously extend its editing capabilities, its computing resources and its processing capabilities. Although EPANET is universally accepted as a reference model in the analysis of water distribution networks, its editing capabilities, information processing and post processingfeatureshavebeenshownclearlyinsufficient
3)WatersupplynetworkusingEPANETthroughhydraulic modeling(March2016)Shivalingaswami.S.H., Vijaykumar.H,Nagaraj.S.Patil
2.2 Design Procedure
In this research the distribution network of Bagalkot (Navanagar) sector was analyzed according to sector 64,65,and 66. The water distribution network has 186 links, 120nodes, and 01 tank. The main aim of this researchwastocheckthewaterdistributionnetworkand find the deficiencies (if any) in the analysis. At the end of theanalysis,itwasfoundthattheresultingpressuresatall thenodesandthelinksvelocitiesaresatisfyingenoughto providewatertothestudyarea.
“Study of water distribution network using EPANET”, International journal of computational Engineering Research,Vol.03,Issue6.
A study was carried out using EPANET for water distribution network of a small area from Punjab city, India by Gupta I et.al. The work basically included the designofwaterdistributionnetworkwithhelpofEPANET software along with the study of hydraulic parameters
III. EPACAD EPACAD software is used to convert AutoCADfilestoEPANETfiles.
DarfalVillageislocatedinNorthTehsilofSolapurDistrict, Maharashtra,India.Itisplaced27kmfromSolapurcity.As per 2009 statistics, there is Gram Panchayat in Darfal Village. Dafal is located at 17.7965 ° N and 75.7946 ° E. It has an average elevation of 11 metres (36 feet). The climate of the village is tropical. During Summer, the humidity level is very high and in winter the climate is almostalwaysdry.Thetotalgeographicalareaofvillageis 3439 hectares. Darfal has a total population of 9150 peoples. There are about 1,600 houses in Darfal village. When it comes to administration, Darfal village is administratedbyasarpanchwhoiselectedrepresentative of the village by the local elections. All major economic activitiesareexecutedasitisneartothetown.
2.1About EPANET 2.0 software:
I. Survey Initially overall Survey of the distribution area was done. During this R.L of various junctions are taken, length of major and minor roads are measured. The position of important structures are marked. The data of survey was converted into an AutoCAD File showing all theimportantrecords.
VIII. Connection Pipes are used in network to connect the reservoir
II. Obtaining Survey data An AutoCAD file was obtained forthearea,showingvariousfeaturesandelevationdata.
VII. Input (Reservoir) We have placed a reservoir near the highest node. The reservoir should be located at an altitudeof15 20mabovethenode'shighestelevation.
3. LITERATURE REVIEW
4) Gupta I, Dr.R.K. Khitolya, Dr.Shakti Kumar (2013)
International Research Journal of Engineering and Technology (IRJET) e ISSN: 2395 0056 Volume: 09 Issue: 03 | Mar 2022 www.irjet.net p ISSN: 2395 0072 © 2022, IRJET | Impact Factor value: 7.529 | ISO 9001:2008 Certified Journal | Page1724
The following data of population is collected from Darfal grampanchayatoffice.Thispopulationgivesrecordofpast 05decadesi.eYear1982,1992,2002,2012,and2022.The forecasting of future 02 decades i.e Year 2032, 2042 is done. From geometric method of population forecasting the future 20 years population of Darphal village is calculatedandfinallyaccordingtothe2042populationthe totaldemandiscalculatedandadopted
3 Forcommunitieswith populationabove100000 togetherwithfullflushing system 150to200lphd
2 Forcommunitieswith population20000to100,000 togetherwithfullflushing system 100to150lphd
1)
EPANET2.0 2)AutoCAD2020 3)EPACAD 4)GOOGLEEarth
ACTUAL POPULATION FORECASTING OF DARFAL VILLEGE :
etc.
1. Collection of the population of last 6 decades of Darfal of the existing work data of head work, ESR andrawwaterpipeline.
4.
Geometric increase method: Year Population Increase populationin increasePercentage in population 1982 4320 1992 5200 880 20.37%880x100/4320= 2002 7120 1920 36.92%1920x100/5200= 2012 8000 880 880 x 100/7120 = 12.36% 2022 9150 1150 1150x100/8000= 14.38%
4.4 Estimation Of Total Water Demand as per IS 1172 : 1993
1
P2032 =P[1+(IG/100)]n =9150[1+(21/100)]1 =11072 P2042 =P[1+(IG/100)]n =9150[1+(21/100)]2 =13359
For design a water distribution network of Darphal village, the following data were obtained:
6.
WaterSupplyforResidences
4.1 Data required
4.2 Software used:
7.Meteorologicaldata Temperature,Evaporation, Wind,andHumidity
For communities with population up to 20 000 and withoutflushingsystem a)watersupplythroughstand post 40lphd(Min) b)watersupplythroughhouse serviceconnection 70to100lphd
required in design and corresponding variations in their functionsandvalues.Designanddevelopmentofnetwork consisted data collection, building water distribution model and calibration of it with bore well as source of watersupply.Comparisonofpressurewasalsocarriedout between results obtained from field survey and from the buildmodel.Thestudyshowedthatresultsobtainedfrom EPANET based model and actual network are close enough to each other.
4. Materials and Methodology
4.3 Population Forecasting
3.RoadmapofDarfalvillages. Dataofexistingwaterpipeline. ExistinglocationofDarfal. Capacityofexistingsourceofwater.
A minimum of 70 to 100 litres per head per day may be considered adequate for domestic needs of urban communities, apart from non domestic needs as flushing requirements. As a general rule the following rates per capita per day may be considered minimum for domestic andnondomesticneeds:
Average per decade 21.0%
2.village.Collection
5.
(Rainfall,
3. Area developed in haphazard manner with different complexity can be designed with the help of EPANET 2.0 software.
11 11 12 88 101.9 102 92 6440 0.075
Area1
PipeNo. Node Flow Length Dia. HL
5. CONCLUSIONS
5
4 4 5 14 100.8 100.9 24 1680 0.019
18 18 19 53 101.1 101.5 59 4130 0.048
19 9 19 51 101.5 101.6 61 4270 0.049
9 9 10 0.512 35 63 0.04
15 5 16 0.221 87 50 0.06 6 17 0.223 88 50 0.06
21 8 21 40 101.8 101.9 46 3220 0.037
12 2 13 0.316 142 50 0.19
14 4 15 88 100.2 100.4 90 6300 0.073
22 10 22 33 101.9 102 37 2590 0.03
5 5 6 1.74 32 90 0.06
6 6 7 1.47 10 90 0.06
14 4 15 0.221 88 50 0.06
REFERENCES
7 7 8 48 101.4 101.6 62 4340 0.05
13 3 14 0.221 88 50 0.06
19 18 20 0.144 51 50 0.02 8 21 0.121 41 50 0.01
Research Journal of Engineering and Technology (IRJET) e ISSN: 2395 0056
From To (LPS) (m) (mm) (m)
Volume:
12 2 13 142 102 100.1 132 9240 0.107
4
18
20 18 20 41 101.6 101.8 51 3570 0.041
3
16
2.0 software helps to design the water supply system within short time. Number of trials can be taken beforefinalizingthesystem.
2 2 3 12 100.6 100.7 21 1470 0.017
21 9 19 0.141 40 50 0.01 10 22 0.068 33 50 0 23 11 23 0.104 56 50 0.02
16 6 17 88 100.5 100.9 92 6440 0.075
17 7 18 52 100.9 101.1 61 4270 0.049
8 8 9 15 101.6 101.7 22 1540 0.018
09 Issue: 03 | Mar 2022 www.irjet.net p ISSN: 2395 0072 © 2022, IRJET | Impact Factor value: 7.529 | ISO 9001:2008 Certified Journal | Page1725
13 3 14 88 100.1 100.2 90 6300 0.073
No. Node1 Node2 LENGTH Node-1 Node2
7 7 8 0.91 48 75 0.07
10 10 11 28 101.8 101.9 37 2590 0.03
1 In this work, water distribution network is designed with less error with target discharge and pressure at all
2. A.N. Chavan, U.L. Deshpande. “Design of Optimized Water Distribution System for Rural India with Reference To Jambhali, District Satara, Maharashtra”.(Journal of IndianWaterWorksAssociation,July Sept2020)
Result and Discussion
1 1 2 3.01 40 110 0.09
Total Daily
=13359x70 = 935,130 lit/day. Add15%losses =935,130X(15/100) =9,49,156 say 9.50,000 lit/day.
17 7 18 0.423 52 50 0.12 18 19 0.145 53 50 0.02
3. Arati Shetkar, Nagesh Hanche, Devendra Hanche, Navagadi(B)ShashishankarA,“DesignofRuralWaterSupplyforVillageusingLOOPSoftware”.(InternationalJournal
8 8 9 0.751 15 75 0.01
1.A.N.Alkali,S.G.Yadima,B.Usman,U.A.IbrahimandA.G. Lawan. “DESIGN OF A WATER SUPPLY DISTRIBUTION NETWORK USING EPANET 2.0: A CASE STUDY OF MAIDUGURI ZONE 3, NIGERIA”. (Arid Zone Journal of Engineering,TechnologyandEnvironment,June2013)
6 6 7 10 101 101.4 47 3290 0.038
20
5 5 6 32 100.9 101 33 2310 0.027
22
Result of software:
23 11 23 56 102 102.2 61 4270 0.049
10 10 11 0.334 28 50 0.05
2 2 3 2.68 12 110 0.02 3 2.41 24 110 0.03 4 2.11 14 110 0.01
11 11 12 0.191 88 50 0.03
15 5 16 87 100.4 100.5 91 6370 0.074
4.5
Area1
Demand of water
International
LPCD LPS
2.ends.EPANET
3 3 4 24 100.7 100.8 32 2240 0.026
NODE RL POPULATION
4
9 9 10 35 101.7 101.8 47 3290 0.038
=Populationxdemandofwaterperheadperday
1 1 2 40 100 100.6 0 0 0
12. Nikhil Hooda, Om Damani “Inclusion of Tank Configurations as a Variable in the Cost Optimization of Branched Piped Water Networks” (Copernicus Publications,DelftUniversityofTechnology)
13. Nitin P Sonaje, Mandar G Joshi, “A REVIEW OF MODELINGANDAPPLICATIONOFWATERDISTRIBUTION NETWORK (WDN) SOFTWARES” (International Journal of TechnicalResearchandApplicationse ISSN:2320 8163)
(Global Research and Development Journal for Engineering,February2019e ISSN:2455 5703)
15. Rushikesh Jagtap, Rakesh Gawali, Vinayak Kanade, Sanket Tithe, Prof P R Gayake, “A REVIEW PAPER ON DESIGN AND ANALYSIS OF WATER DISTRIBUTION SYSTEM OF ADYPU CAMPUS” (International Research Journal of Engineering and Technology (IRJET) e ISSN: 2395 0056)
17 Dr. P.R. Bhave and S.D. Shangarpwar from IWWA march2001“computeraidedanalysisanddesignofwater distributionnetwork”
16. Vidhi N Mehta, Dr G. S. Joshi, “DESIGN OF RURAL WATERSUPPLYSYSTEMUSINGLOOP4.0”(International Journal of Modern Trends in Engineering and Research, December2016,Volume3,Issue 12)
18. Dr. P.R.Bhave and Dr. R.Gupta “Analysis of Water DistributionNetwork”
19.EigerG,ShamirU,Ben TalA.(1994)“OpatimalDesign of Water Distribution Network” Water Resources Research,Vol.30,No.9,pp 2637 2638
22. Walski,ThomasM., (march2006) “AHistory of Water Distribution”,JournalAWWA,Vol98,No.3,pp 110 111.
Volume: 09 Issue: 03 | Mar 2022 www.irjet.net p ISSN: 2395 0072 2022, IRJET Impact Factor value: 7.529 | ISO 9001:2008 Certified Journal 1726
Conference on Ecological, Environmental and Biological Sciences(ICEEBS'2012)Jan.7 8,2012Dubai)
|
4. A.R.AYAD, H.A.AWAD, A.A.YASSIN. “GEOGRAPHIC INFORMATION SYSTEMS IN WATER DISTRIBUTION NETWORKS”.(ConferencePaper,Jan2012)
14. Nisha Patel, Ankita Parmar, “Water Distribution Network using EPANET: A Case Study of Olpad Village”
7. Bhavana K. Ajudiya, Dr. S. M. Yadav, Prof. B.H.Pandit. “WaterDistributionNetworkDesignandAnalysis”:ACase Study.(LakhadhirjiEngineeringCollege)
20. Analysis”,21.NemanjaTrifunovic(2002)“WaterDistribution”.ShamirU.(1968)“WaterDistributionSystemsJournaloftheHydraulicDivisionProceedingof
theASCE,HY.1,1968:pp.219 222.
10. Manoj Nallanathel, B. Ramesh, A P Santhosh “Water distribution network design using EPANET A case study” (International Journal of Pure and Applied Mathematics Volume119No.172018)
| Page
9. Emengini, Ebele Josephine1, Unigwe, Ozioma2 “DEVELOPMENT OF A GIS BASED SYSTEM FOR MANAGEMENT OF WATER DISTRIBUTION NETWORK OF ACHARA LAYOUT ENUGU, ENUGU STATE, NIGERIA”. (International Research Journal of Engineering and Technology(IRJET)e ISSN:2395 0056Volume:03Issue: 01|Jan 2016)
©
International Research Journal of Engineering and Technology (IRJET) e ISSN: 2395 0056
ofRecentAdvancesinEngineeringandTechnology(2016) ISSN2347 2812,Volume4,Issue 7)
8. Dr. H. Ramesh, L. Santhosh and C. J. Jagadeesh Network“SimulationofHydraulicParametersinWaterDistributionUsingEPANETandGIS”.(International
6. Bhagvat Zolapara, Neha Joshipura, Jaydeep Patel.(2015).”Case Study on Designing Water Supply Distribution Network Using EPANET for Zone I of Village Kherali “;(Indian Journal of Research, PARIPEX Volume 4 Issue7)
11. “Manual on Water Supply and Treatment” Third Edition, the GOI, Ministry of Urban Development, New Delhi,March1991,pp319.
5. Arjun Kumar, Kankesh Kumar, Bharanidharan B, Neha Matial, Eshita Dey, Mahan Singh, Vivek Thakur, Sarit Sharma, Neeraj Malhotra. “DESIGN OF WATER DISTRIBUTION SYSTEM USING EPANET”. (International Journal of Advanced Research (2015), Volume 3, Issue 9, 789 812)