IIT
1College of Technology, GBPUA&T, Pantnagar, School of Agro Technology, Guwahati,
& Rural
1.INTRODUCTIONUttarakhand
Singhal et al. accessedtheavailabilityofgroundwaterandits development in the district of Uttarakhand and estimated thattherechargerateinthewaterbearingformationsofthe regionwasabout19%followedbyastageofabout164%for groundwater development. These results suggested that therewasacriticalover exploitationofgroundwaterinthat region[8].
Marechal et al. reportedarapidincreaseinthenumberof mechanizedtubewellswhichhasresultedinhighestnumber of pump sets installations in the country. Moreover, groundwaterirrigatedlandareahasincreasedby105%in contrast with the area of surface water irrigated area remainedjust28%overthesameperiodoftwodecades[7].
Ravi Kant Bhardwaj1, Shivangi Sharma2
The aim of this present study is to evaluate the impact of rainfall of groundwater level fluctuations in Uttarakhand, Indiaduetorapidincreaseinpopulationrise,tourismand othersocioeconomicgrowthin the state. This will further boosttheneedforgroundwatermanagementresearchasthe findings will provide some insight towards sustainable utilizationofthispreciousresourcesanditsmanagementin ordertoavoidtheirshortageordecline.
the sea [4]. Groundwater can be dynamically replenished dependingonthenatureofvariousparameterslikeclimatic factors,hydrogeologicalandtopographicalconstraints[5]. Uttarakhandisthirdlargestdependent(morethan65%)on groundwaterforitsirrigationpurposesinthecountry[6]. Moreover,springs,whicharebasicallypointsofdischargeof undergroundwatersourcestothesurfaceisoneofthemajor domesticsourcesofwaterforthepeopleofthisregion.
India 2
Indiaisamongthecountrieshavingthegreatestnumberof rivers, but all the requirement of water in agricultural, industrialordomesticpurposescannotbefulfilledwithonly surface water. Groundwater is also one of the most significantdrinkinganddomesticwaterresourceworldwide, but the surge in urbanization and industrialization have overexploitedthispreciousresource,causingadramaticrise initsdemand[1].InmanypartsofIndia,groundwaterhas been extensively utilized for agricultural, industrial and domestic purposes [2]. Almost 250 billion cubic meters (BCM) of groundwater is extracted in India out of which more than 85% consumed for agricultural activities on yearlybasis[3].
Uttarakhand is situated in the Himalayan foothills and majority of the area of the State falls under hilly terrain (about86%)expectforHaridwar,UdhamSinghNagarand some parts of Dehradun district. In hilly terrains, groundwaterprimarilyoccursinfracturesandfissures;and emerges as springs. The state possesses a diverse hydrogeologicalset upandisdistinctivelydividedintotwo regimes namely, the Himalayan mountain belt and the Gangeticalluvialplain.
International Research Journal of Engineering and Technology (IRJET) e ISSN: 2395 0056 Volume: 09 Issue: 03 | Mar 2022 www.irjet.net p-ISSN: 2395-0072 © 2022, IRJET | Impact Factor value: 7.529 | ISO 9001:2008 Certified Journal | Page1666

1.1 Study Area
ThestudyareaisthestateofUttarakhandwhichliesinthe northernregionofthecountrybetween28043’Nto31028’
Impact of Rainfall on Ground Water Level Fluctuations in the State of Uttarakhand, India
Abstract Water is significant normal assets on soil which cater for all human endeavours. Groundwater is the foremost vital and reliable fresh water resource globally even in areas with excessive rainfall patterns and ample surface water. The present study is used to evaluate the impact of rainfall on ground water level fluctuations based on the data analysed over a period of 10 years from 2011 to 2020 for the state of Uttarakhand in the northern part of India. These data were analysed for the precipitation variation and groundwater variation. The examination too outlined that, the precipitation is impacting the groundwater level of the consider range as the rain more often than not begun in September and ended in December. Be that as it may, there are small events of rain within the rest of the months all through the year. The most extreme water level too was found amid January to February The water table begins to decrease from June to August and comes to its most reduced level ordinarily from August to September. The result too outlines that, groundwater level diminished day by day due to fumble and excessive withdrawal from water system divisions and household employments.
India ***
Insimpleterms,groundwatercanbethoughtofthewater whichinpresentbelowtheearthsurfacewithinsoilpores andcracksinrocks.Groundwaterconstitutesa significant partofthehydrologicalcycleandisformedasprecipitation orthewaterstoredinsurfacebodiesinfiltratesorseepsinto theground.Bynaturaldischarge,groundwaterfromaquifers enters springs, surface watersources,seepage areas or to
Key Words: Rainfall, Groundwater, Fluctuations,
The nature of water bearing formations falls under multi aquifer system in plain areas whereas fissures, joints and fracturesinmetamorphicandcrystallineigneousrocksare
2.1MethodologyDataCollection and Data Quality
Nlatitudeand77034’Eto81003’Elongitude.Thestateis adjacenttoUttarPradeshinthesouthernpartandHimachal Pradeshinthenorthwestandsharesinternationalboundary with China and Nepal. It has a total geographical area of 53,483km2[9]withapopulationofabout10.09millionand populationdensityof189perkm2aspercensusreportof 2011[10].

In Uttarakhand, the topography ranges from sub tropical forestsatloweraltitudestoglaciersathigheraltitudesdue to its location on the southern slope of the Himalayas. Uttarakhand falls under Montane, also known as alpine, climate regions. The climate of Uttarakhand is temperate withseasonalvariationintemperaturebutalsoaffectedby tropicalmonsoons.Thetemperaturefallswithelevationin altitude. January is the coldest month, with daily high temperaturesbelowfreezingandnear21°Cinthesoutheast. Julyisthehottestmonthinthenorth,with7°Ctoaround 21°Cdaily.Whileinthesoutheast,Mayiswarmestmonth, withdailytemperaturerangingfrom38°Ctothelowof27° C. Summer is the driest part of the year with afternoon relativehumiditybetween30%to45%andmorningrelative humidityfrom50%to70%insouthernpart.Intheseparts therelativehumidityrangesbetween80%and90%inthe morningand50%and70%intheafternoon.
Chart 1:Thestudyareamapindicatesthedistrictsfor whichthedatawascollected
Thegroundwaterleveldataforthethirteendistrictsofthe Uttarakhand state were collected from Central Ground WaterBoard(CGWB),MinistryofJalShakti,Departmentof Water Resources, River development and Ganga Rejuvenation,GovernmentofIndiafortheperiodof2011to 2020weresortedandarrangedinanExcelsheet.Soalso,the Evapotranspirationandrainfalldataforthesameyearswere collectedandsortedinthesameformatabove.Themapof thestudyareaobtainedfromUk.gov.inwebsiteofNational Informatics Centre Uttarakhand was used to locate the districts/stations.Allthedatawasfoundtobehomogeneous andthemissingvaluesobtainedwerelessthan5%forthe period2011to2020,themissingvaluesinthedataseries were estimatedusingvarious types of weighting methods suchasinverse,distance,correlation,andnormalratio.
2.
3 Results and Discussions
International Research Journal of Engineering and Technology (IRJET) e ISSN: 2395 0056 Volume: 09 Issue: 03 | Mar 2022 www.irjet.net p-ISSN: 2395-0072 © 2022, IRJET | Impact Factor value: 7.529 | ISO 9001:2008 Certified Journal | Page1667
3.1 Rainfall Variation
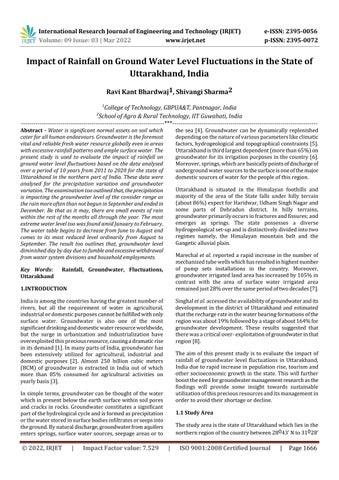
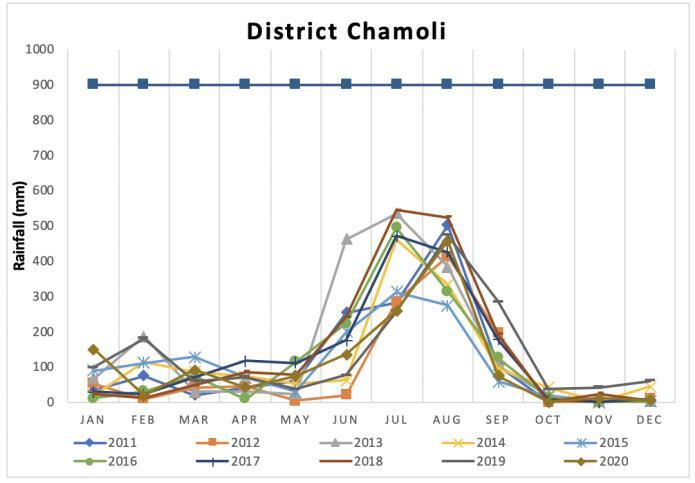
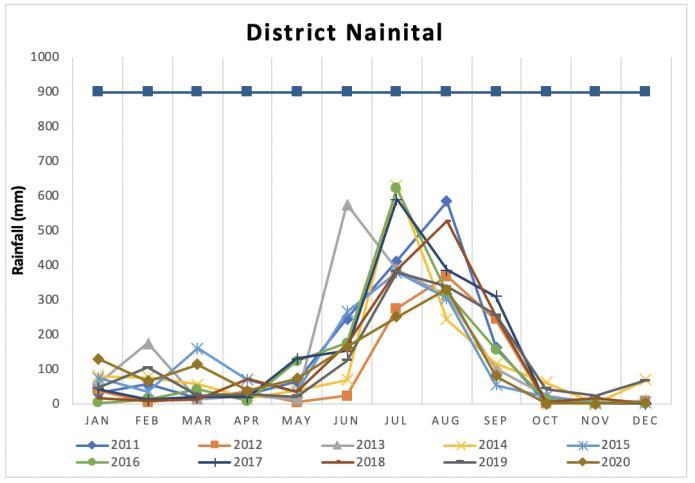
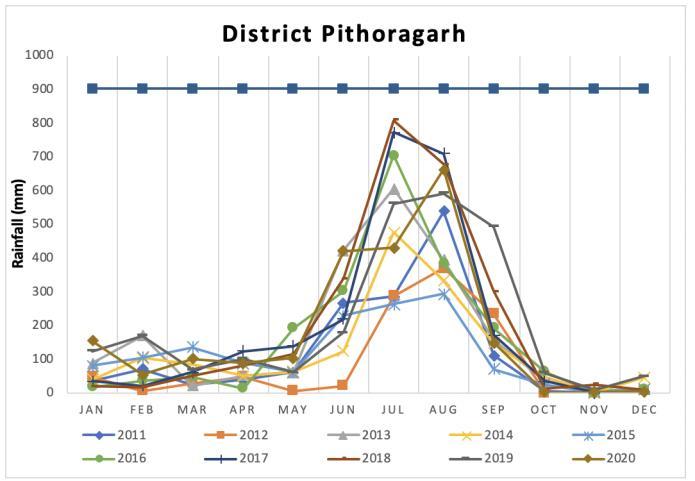
Thebelowfiguresindicatethemonthlyvariationinrainfall inthethirteendistrictsofthestateoveraperiodof10years from 2011 to 2020. The months from May to September experiencesthemaximumrainfallduringtherainyseason. The months from OctobertoApril observesthe minimum rainfallandsometimesverylittleornorainfall.Theresults ofthestudyentailthat,themaximumrainfallinAlmorawas recorded in August, 2011, Champawat August, 2011, BageshwarJuly,2018,DehradunAugust,2012,ChamoliJuly, 2018, Garhwal August, 2014, Pithoragarh July, 2018, HaridwarJuly,2018,NainitalJuly,2016,RudraprayagJuly, 2016,UttarakashiAugust,2012,TehriGarhwalAugust,2012 andUdhamSinghNagarAugust,2012.
Thestatereceivestheaverageprecipitationofaround1300 mm, mostly brought by southwest monsoon which blows fromJulythroughSeptember.Ingeneral,theyearisdivided into four seasons. The winter season from December to Februaryisfollowedbypre monsoonorhotweatherseason from March to May. June to September constitutes the southeast monsoon season and period of October and Novemberisofpostmonsoonseason[11].
themajorwatersourcesinhillyterrains.Thewaterlevelsin theseaquifersrangesfrom20mbgl(metersbelowground level)toabout100mbglandissafelyutilizedfordrinking, irrigation and domestic purposes. Between pre and post monsoon seasons the groundwater fluctuates typically between2mto4m.
Research Journal of Engineering and Technology (IRJET) e
2395 0056 Volume:
Chart 5:Monthlyvariationsinrainfallinthedistrictof Chamoli(2011 2020)
International ISSN: 09 2395-0072
Issue: 03 | Mar 2022 www.irjet.net p-ISSN:
© 2022, IRJET | Impact Factor value: 7.529 | ISO 9001:2008 Certified Journal | Page1668
Chart 6:Monthlyvariationsinrainfallinthedistrictof Garhwal(2011 2020)
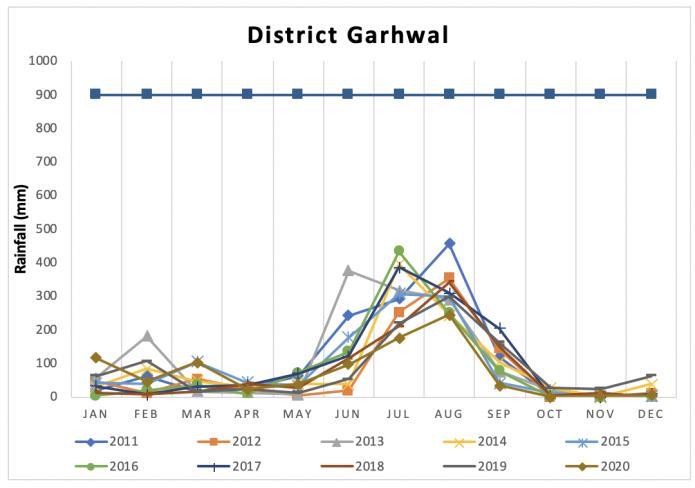
Chart -4:Monthlyvariationsinrainfallinthedistrictof Bageshwar(2011 2020)

Chart 1:Monthlyvariationsinrainfallinthedistrictof Almora(2011 2020)
Chart 2:Monthlyvariationsinrainfallinthedistrictof Champawat(2011 2020)

Chart 3:Monthlyvariationsinrainfallinthedistrictof Dehradun(2011 2020)
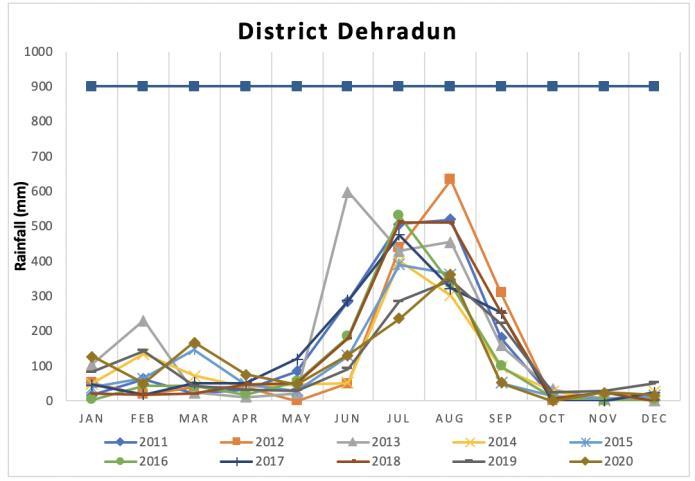
Chart -9:Monthlyvariationsinrainfallinthedistrictof Nainital(2011 2020)
International Research Journal of Engineering and Technology (IRJET) e ISSN: 2395 0056 Volume: 09 Issue: 03 | Mar 2022 www.irjet.net p-ISSN: 2395-0072 © 2022, IRJET | Impact Factor value: 7.529 | ISO 9001:2008 Certified Journal | Page1669
Chart 8:Monthlyvariationsinrainfallinthedistrictof Haridwar(2011 2020)
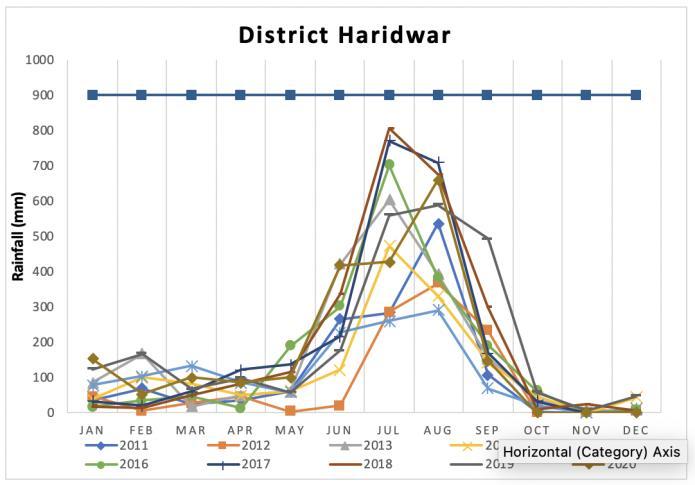
The maximum annual rainfall recorded in Almora was 1499.55 mm in 2011, Bageshwar 2263.35 mm in 2018, Champawat 1228.49 mm in 2014, Chamoli 1858.15 mm, Dehradun20178.94mmin2013,Garhwal1355.34mmin 2013,Haridwar1545.92mmin2013,Nainital1694.08mm in 2013, Pithoragarh 2455.27 mm in 2019, Rudraprayag 1991.07mmin2013,TehriGarhwal1539.46mmin2013, UdhamSinghNagar1758.85mmin2018andUttarakashi 1815.85mmin2013.ItfurtherindicatedthatUttarakhand statereceivedanexcessiverainfallintheyear2013,aseach district recorded higher values for rainfall. Pithoragarh received the highest rainfall of 2455.27 mm in 2019 and Uttarakashi received the lowest rainfall of 849.61 mm in 2011.Whiletheaverage rainfall receivedwasrecorded at Rudarprayag(1398mm)in2020.
Chart 10:Monthlyvariationsinrainfallinthedistrictof Rudraprayag(2011 2020)
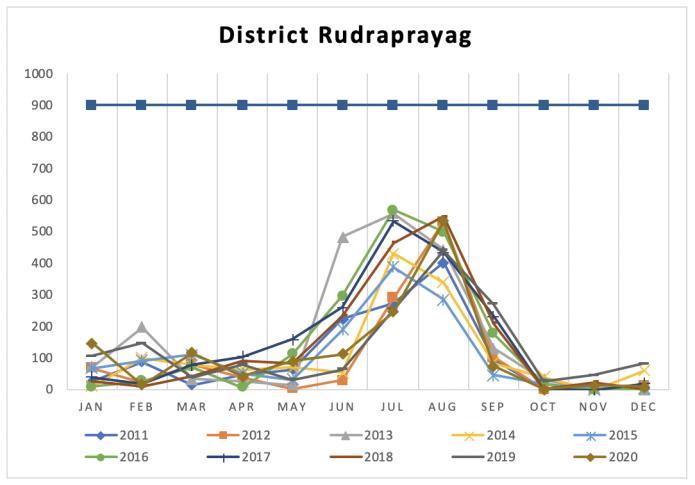
Chart 11:Monthlyvariationsinrainfallinthedistrictof Uttarkashi(2011 2020)

Chart -7:Monthlyvariationsinrainfallinthedistrictof Pithoragarh(2011 2020)
3.2 Rainfall Variation
International Research Journal of Engineering and Technology (IRJET) e ISSN: 2395 0056 Volume: 09 Issue: 03 | Mar 2022 www.irjet.net p-ISSN: 2395-0072 © 2022, IRJET | Impact Factor value: 7.529 | ISO 9001:2008 Certified Journal | Page1670
rainfallin
Chart 13:Monthlyvariationsinrainfallinthedistrictof UdhamSinghNagar(2011 2020)
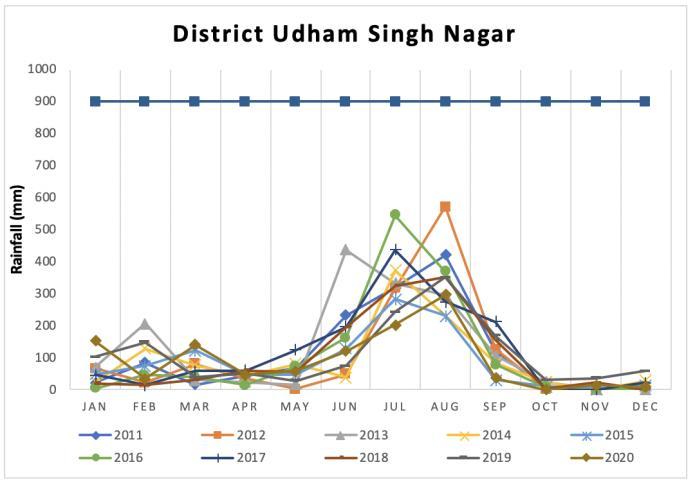
Chart 14:Groundwaterlevelfluctuationsforthestateof Uttarakhandoveraperiodof10years(2011 2020)

REFERENCES
Theresultoftheanalysissuggeststhat,annualrainfallofthe state has increased but the increase is not linear and decreasedin2020overtheperiodofstudyasrecordedin Table1.Similarly,theabove(Figure9)illustratesthetrends inthegroundwatertableofthestudyareaduring2011to 2020.Theresultshowedthattheminimumwatertablewas in 2016 and maximum was in 2018 due to increase in rainfall.Theresultindicatedthegoodrelationshipbetween theseparametersasthefluctuationcurveindicatedwhich wasabidingbythenatureoftherainwaterofthearea.The highestdeflectionoccurredfromApriltoJuly,andthewater tableslowlyincreaseduntilitreachedtheminimumduring
The watertablestartstodecreasestill theheavyrainwill startagaininMay.However,theoverallyearlywatertable resultindicatingdeclineingroundwaterleveltrendisdueto unsustainablewithdrawalofgroundwaterfordomesticand irrigationpurposesasthestateusedgroundwaterforwater supply,thiswereplayedavitalroleinwaterlevelfluctuation inUttarakhand,India.
The minimum annual rainfall was recorded at Uttarkashi (849.61mm)in2011whileGarhwalisthedistrictthathas thelowestrainfallinthestateasthetableaboveshows.The studyresultalsoshowsthattherainfallhasdecreasedinthe area since from 2011 to 2020, but the decrease is not linearly.Thereisawidevariationoftherainfallinthestudy areadependingupontheareaandtheyear.

The study results illustrate that, the maximum rainfall occurred during June to September, and little rainfall was recorded during January to March. The water table fluctuationwasrecordedmonthly,andanalysisshowedthat, precipitationhaveaninfluenceinrechargeofthewatertable inUttarakhand,India.ThewatertableelevatedduringApril to May due to the recharge by the listed parameters and usually declined from June to August. The lowest level of groundwaterlevelfluctuationwasfoundtobefromAugust to September. The result of this study entails that the groundwaterlevelfluctuationsinUttarakhandisdependent solidlyonrainfallpattern.Thefindingsofthisresearchcan provide some information to the government for water managementandforpredictingfutureclimaticevents.
4. Conclusions
[1] N. Adimalla, R. Dhakate, A. Kasarla, and A. K. Taloor, “Appraisalofgroundwaterqualityfordrinkingandirrigation purposes in Central Telangana, India,” Groundw. Sustain.
August to November it maintained an average level until February.
Table 1: Yearlyrainfall(mm)ofthirteendistrictsof Uttarakhand,India(2011 2020)
(2011
Chart 12:Monthlyvariationsin thedistrictof TehriGarhwal 2020)

[8] D. C. Singhal, M. Israil, V. K. Sharma, and B. Kumar, “Evaluationofgroundwaterresourceandestimationofits potential in Pathri Rao watershed, district Haridwar (Uttarakhand),”Curr.Sci.,vol.98,no.2,pp.162 170,2010.
Volume: 09 Issue: 03 | Mar 2022 www.irjet.net p-ISSN: 2395-0072 2022, IRJET | Impact Factor value: 7.529 | ISO 9001:2008 Certified Journal Page1671
International Research Journal of Engineering and Technology (IRJET) e ISSN: 2395 0056
[7] J.C.Marechal,B.Dewandel,S.Ahmed,L.Galea i,andF. K.Zaidi,“Combinedestimationofspecificyieldandnatural rechargeina semi aridgroundwater basinwithirrigated agriculture,”J.Hydrol.,vol.329,no.1 2,pp.281 293,2006, doi:10.1016/j.jhydrol.2006.02.022.
,W. Yu,andH.A.Michael,“Water ResourcesManagementintheGangesBasin:AComparison ofThreeStrategiesforConjunctiveUseofGroundwaterand Surface Water,” Water Resour. Manag., vol. 28, no. 5, pp. 1235 1250,2014,doi:10.1007/s11269 014 0537 y.
[3]A.Gulati,B.Sharma,P.Banerjee,andG.Mohan,“Nabard ResearchStudy 6,”2019.
[11]C. Of, “CLIMATE OF UTTARAKHAND,” India MeteorologicalDepartment,Pune,Pageno.21.
BIOGRAPHIES
RaviKantBhardwaj,Collegeof Technology,GBPUA&T, Pantnagar,India ShivangiSharma,SchoolofAgro &RuralTechnologyIITGuwahati, India
[6] V.Dhawan,“WaterandAgricultureinIndia:Background paper for the South Asia expert panel during the Global ForumforFoodandAgriculture (GFFA)2017,”OAV Ger. Asia PacificBus.Assoc.,pp.1 25,2017,[Online].Available: ater_Agriculture_India.pdf.5_Publikationen/5_Studien/1https://www.oav.de/fileadmin/user_upload/70118_Study_W
Dev., vol. 10, no. 126, p. 100334, 2020, doi: [2]10.1016/j.gsd.2020.100334.M.R.Khan,C.I.Voss

|
©
[9] K.Divisionetal.,“GeographicLocation:,”no.1,pp.1 4, [10]2000.R. Males, R. Females, U. Males, and U. Females, “Uttarakhand Profile Uttarakhand Profile,” Literacy, vol. 2011,pp.1 2,2011.
[4]. Julie Trottier and Paul Slack, "Managing Water Resources,PastandPresent,"2004.
[5] T. Anamika Shalini, “Groundwater Level and Rainfall Variability TrendAnalysisusingGIS in parts of Jharkhand state (India) for Sustainable Management of Water Resources,”Int.Res.J.Environ.Sci.Int.Sci.Congr.Assoc.,vol. 1,no.4,pp.24 31,2012,[Online].Available: