To overcome these problems FACTS devices are used. In this work, Distribution STATCOM (D STATCOM) is proposed. D STATCOM is a shunt connected voltage source converter. It is used to minimizeDdistributionStandardalgorithmreferencedeterminationDSTATCOM.usedSTATCOM.usedunbalancedsag,compensateforpowerqualityproblemssuchasvoltagevoltagefluctuation,voltageunbalanceandload.TheVoltagestabilityindexmethodistofindtheoptimallocationandsizingDAParticleswarmoptimizationalgorithmistofindtheoptimallocationandsizingofDSTATCOMismodeledfortheofitssizebyassumingdifferentvoltage.ForwardandbackwardSweepisusedtocarryouttheloadflowanalysisofIEEE12BusandIEEE34BusRadialsystemandCheckanuranisubstation.TheSTATCOMisusedtoimprovethevoltageprofileandthetransmissionloss.
DHANALAKSHMI C1 , KALIDASS P2 , SURESH S3 , RAJARAM K4
The power system is a network that consists of generation, transmission and distribution system. The power plants, transformers, transmission lines, substations, distribution lines, and distribution transformersarethesixmaincomponentsofthepower system. The generator generates the power which is step up or step down through the transformer for transmission. The transmission system carries the overhead lines which transfer the generated electrical energyfromgenerationtothedistributionsubstations. Distribution systems connect all the consumers in an areatothebulkpowersources.
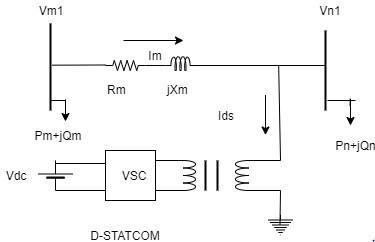
TestsystemconsideredisIEEE12,IEEE34Bus andCheckanuranisubstationinMadurai.Checkanurani substation is a step down substation with a rating of 110/11KV.Itconsistsofsixoutgoingfeeders.Namely, Karumathur, Thenpalanji, Gandhinagar, Kannanur, Powergrid, and University. Some distribution transformersareoverloaded,thishasresultedinmore lossesandundervoltageinthesystem.Toovercomethis issue,theloadsweredisconnectedfromtheoverloaded transformersandreconnectedtotheconnectedtothe nearby lightly loaded transformers and then the load flow program is executed to find the feeder losses by usingsweepalgorithms.Theshuntcapacitorsarealso placed to improve bus voltage and the results did not turnuptotheexpectedlevel.
Key Words: D STATCOM,Loadflowanalysis,IEEE12, IEEE34 Bus radial distribution system, Checkanurani Substation,Optimumlocation,Optimumsize
1Lecturer, Dept. of EEE, Lakshmi Ammal Polytechnic College
Abstract The electrical power system consists of generation, transmission, distribution system. The transmission system links the generators to substations, which supply power to the user through the distribution system. The Distribution system is most associated with power loss and has least reliability due to various reasons such as low voltage levels and multiplicity of faults. This workisapplyingparticleswarmoptimization algorithm (PSO) that aims to achieve the power loss reduction and maximum voltage profile in radial distribution network with Distribution Static Compensator (D STATCOM). D STATCOM is used to improve bus voltage profile. Voltage stability index is used to identify place for placing D STATCOM. An effectivelyparticleswarmoptimization is usedtosearch the best location and is employed to deduce the size and location of D STATCOM for the weak buses. The validity of the method is tested in the IEEE12,IEEE34 Bus radial CheckanuraniandandwithoutobtainedperformedofdistributionsystemandCheckanuranisubstationrating110/11KVinMadurai.LoadflowanalysisisandthebusvoltageandpowerlossisinMATLAB.TheresultsobtainedarecomparedandwithDSTATCOM.BytheoptimalplacementsizingofDSTATCOMthevoltageprofileimprovedthepowerlossreductionsareobtainedinthesubstationlocatedinMadurai,Tamilnadu.
International Research Journal of Engineering and Technology (IRJET) e ISSN: 2395 0056 Volume: 09 Issue: 03 | Mar 2022 www.irjet.net p ISSN: 2395 0072 © 2022, IRJET | Impact Factor value: 7.529 | ISO 9001:2008 Certified Journal | Page1600

***
1. INTRODUCTION
2Lecturer, Dept. of EEE, Lakshmi Ammal Polytechnic College
4Student, Dept. of EEE, Lakshmi Ammal Polytechnic College
OPTIMAL SITING AND SIZING OF D-STATCOM USING PARTICLE SWARM OPTIMIZATION
Distribution systems have high R/X ratio which results in high power loss which leads to voltage instability.Seriesvoltageregulatorandshuntcapacitors are the two conventional ways of maintaining the voltages of the distribution system at an acceptable range.But,thesedeviceshavesomedisadvantagesthat are conventional series voltage regulators cannot generatereactivepowerandhavequiteslowresponse because of their step by step operations. The disadvantage with the shunt capacitors is that they cannotgeneratecontinuouslyvariablereactivepower.
3Student, Dept. of EEE, Lakshmi Ammal Polytechnic College
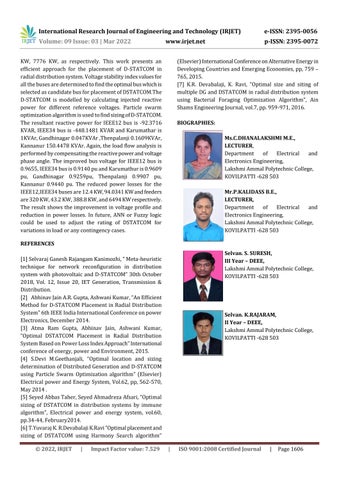
Qn=Reactivepower
TodeterminethesizingofD STATCOM using particle swarm optimization algorithm.
The reactive power injected by D STATCOM to the systemislimitedbyupperandlowerboundsgiven
Therelationbetweenloadcurrentandbranchcurrent canbefoundbyusingKCLequation
To find the optimal location of D STATCOMusingvoltagestabilityindex.
Forwardsweepalgorithmisusedtocalculatethevoltage ateachbusstartingfrombranchesfromfirstlayertolast layer.Vn(K)=Vm(K) IB(K)*Zm(K) …(3)
Where,IL=LoadCurrent
BackwardSweepalgorithmisusedtocalculatethe branchcurrentstartingfromthelastlayertowardsthe branchesconnectedtorootnode.
Where,IB=BranchCurrent
Minf=min(PTLoss)
Vm(K)=sendingendVoltage
3. OPTIMAL PLACEMENT OF D STATCOM
©
VoltageStabilityIndexmethodisusedtofindthe optimallocationofD STATCOMinthebuses.Thebus with highest value of stability index is selected as candidatebus.
Theexpressionforstabilityindexis
N=total.No.ofbuses
Fig 1: Singlelinediagramoftwobusdistributionsystem
Volume: 09 Issue: 03 | Mar 2022 www.irjet.net p ISSN: 2395 0072 2022, IRJET | Impact Factor value: 7.529 | ISO 9001:2008 Certified Journal | 1601
Where,
International Research Journal of Engineering Technology (IRJET) e ISSN: 2395 0056
Im=Branchcurrent
2.4.4 Power losses: Powerloss=Busvoltage*BranchCurrent ….(4)
R=Resistance(p.u.)
Pn=Activepower
Thesystemvoltageinallbusesshouldbeanacceptable range Vmin≤Vi≤Vmax
Vi is the voltage of ith bus and i bus varies from 1 to numberofbuses.
Xm=Branchreactance
2.1 IDENTIFICATION
P=RealPower(p.u.)
Q=Reactivepower(p.u.)
Toimprovevoltageprofileandreduce power loss in the distribution system byusingD STATCOM.
Vm=Voltage(p.u.)
4. MATHAMATICAL MODELLING OF D STATCOM
ThematrixcanWrittenas: [IB]=[BIBC][IL] (2)
and
2. PROBLEM DESCRIPTION AND FORMULATION
Theobjectiveoftheoptimalplacementandsizingof D STATCOMistominimizethetotal powerlossinthe distributionnetworkwithvoltageprofileimprovement.
CONSTRAINTS:
2.4 LOAD FLOW ANALYSIS
Theloadcurrentatanybusisgivenas:
ILn=(Pn jQn)/Vn Wheren=1,2….N ….(1)
2.4.2 Backward Sweep
BIBC=BusinjectiontoBranchCurrentMatrix
Where, K=1,2,…..Nb
Nb=totalno.of.Branches=N 1 Vn(K)= receiving end Voltage
Rm=Branchresistance
Page
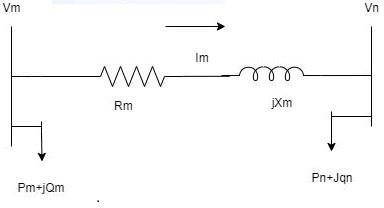
D STATCOM is a shunt connected voltage source device. It has three components such as voltage source
Qmin≤QD STATCOM≤Qmax
2.4.3 Forward Sweep
Thereductionoflossesandmaintainingavoltageprofile of theDistributionfeeders in a radial distributionsystem. ThiscanbedonebyusingD STATCOMofoptimalratingat appropriatelocationsandsizingofD STATCOM
Vn=BusVoltage
2.3 PROBLEM FORMULATION
2.2 OBJECTIVE
S.I=4*Rm*(Pn2+Qn2)/(Vm2*Pn) ....(5)
2.4.1 Calculation of load current
Step5:Foreachparticles,analyzeitsobjectivevaluewith the individual best. If the objective value is lower than P best, set this value as the current P best, and note the correspondingparticleposition.
Thetestsystemconsideredinthispaperisastep down substation with the rating of 110/11kV. The substationhastwocommonbusesandsixoutgoingfeeders. Bus1 is connected to station transformer and Bus2 is connected to potential transformer. These buses are systeminterconGandhiThenpalanjithreeinterconnectedthroughcommonswitch.Eachbusconsistsoffeedersi.e.,Bus1isconnectedtoPowergrid,andKannanur.Bus2isconnectedtoUniversity,NagarandKarumathur.Thefeedersarenectedthroughcommonswitch.Totallythetestconsistsofsixfeeders.
Step 2: Calculate the powerlossusing backward forward sweepindistributionsystem.
Page
International Research Journal of Engineering and Technology (IRJET) e ISSN: 2395 0056
h1=real(Vm1∟Өm) real(Zm.Im∟δ) h3= Xm
Vn1=Receivingendvoltage(candidateBus)
Algorithmforradialdistributionsystemisgivenbelow:
Journal
6. TEST SYSTEM
δ=phaseangleofIm
5. PROPOSED METHODOLOGY
theSTATCOM,andthecorrespondingfitnessvaluerepresentingminimumpowerloss.
Өn=phaseangleofVn1
Step3:Randomlyproducesaninitialpopulationofparticles with random positions and velocities on volume in the solutionspace.
Өm=phaseangleofVm1
7. PARTICLE SWARM OPTIMIZATION
Step8:Printtheoptimalsolutiontothetargetproblem.The bestpositionincludestheoptimallocationsandsizeofD
QDS=ReactivepowerbyD STATCOM
Vm1=Sendingendvoltage(previousbus)
Step1:Inputlineandbusdata,andsetbusvoltagelimits.
converter(VSC),couplingreactorandcontroller.TheD STATCOMismodelledbycalculatinginjectedcurrentand injectedreactivepowerwithdifferentreferencevoltage.
Update velocity: Vik+1=c*[wvik+c1r1*(Pbest Sik)+c2r2*(Gbest Sik)]
©
IDS=(Vn1cosӨn h1)/( h4sinӨn h3cosӨn) ….(9)
Step 4: For each and every particle if the bus voltage is withinthelimitsineachparticle,calculatetransmissionloss or,thatparticleisinfeasible.
Im=(Pn jQn)/Vn* ....(8)
Vik+1 Where,w=weightingcoefficient
h4= QDS=Rm(Vm1∟Өn).(IDS∟(π/2+Өn)) ….(10) *denotesthecomplexconjugate. Where,
Volume: 09 Issue: 03 | Mar 2022 www.irjet.net p ISSN: 2395 0072 2022, IRJET | Impact Factor value: 7.529 | ISO 9001:2008 Certified | 1602
Update position: Sik+1=Sik+ c1,c2=accelerationcoefficient
Fig 2:Singlelinediagramoftwobusdistributionsystem withD STATCOM
Step 6: Update the velocity and position of particle Steprespectively.7:Iftheiterationnumberattainthemaximumlimit,go toStep8Orsetiterationi=i+1,andgobacktoStep4.
Particle swarm optimization is a computational methodthatoptimizesaproblembyiterativelytryingto improve a candidate solution with regard a given measureofquality.
IDS=CurrentinjectedbyD STATCOM
Fig 3: SinglelinediagramofCheckanuraniSubstation distributiontesttheconsistrespectively.ofseventeenfeedersKarumathur,Gandhinagar,KannanurandThenpalanjiconsistoftwenty,twentytwo,fortyanddistributiontransformerswiththetotalrating2479KVA,2763KVA,5877KVA,and2075KVAThepowergridanduniversityfeedersofoneandthreedistributiontransformerswithratingof250KVAand100KVA.Thetotalloadforthesystemis22202.15KW.Thetotalcapacitiesofthetransformersare13444KVA.
(IRJET) e
12 0.0015 0.0015 0.0015 0.0015
r1,r2=randomnumbersbetween0and1 whichcanchangethespeedandaccuracyof algorithm.P
No Runof
|
and
best= best position that has been found by i th iterationtok th iteration
9 0.0076 0.0076 0.0076 0.0076
Position 1 Position 2 Position 3
The test results are analyzed for IEEE12, IEEE34 busradialdistributionsystem.Checkanuranisubstation results are analyzed for 4 feeders only, namely Karumathur,Thenpalanji,GandhiNagarandKannanur nottofeeders.ForothertwofeedersthevoltageprofileisfoundbewithinlimitandhencetheplacingofDSTATCOMisrecommended.Theresultsarepresentedbelow:
nLocatioOptimal
7th and8th &92.5143 92.3716& 12.4 12.4 Bus 70.8147 71.2604 7th ,8th and 92.5143 92.3716 12.4 12.4
8. RESULTS AND DISCUSSION
7th Bus 92.5143 92.3716 14.6 14.6
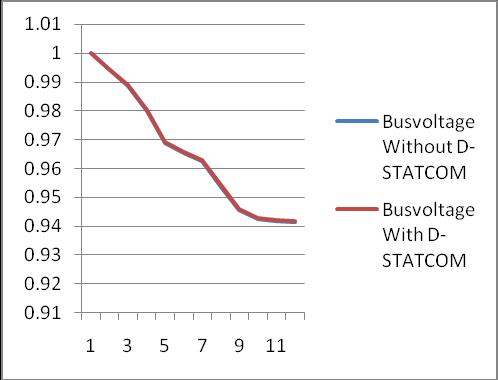
8.1 IEEE12 BUS RADIAL DISTRIBUTION SYSTEM Fig 4: Bus voltage profile in IEEE12 bus 8.1.1 Voltage stability Index Bus number 7 is the more stable and highest distributiontovalueofstabilityIndexwhichisselectedascandidateBusplacetheDSTATCOMintheIEEE12Busradialsystem. Table 1 :Optimal location of D STATCOM at different location numberBus SI casebasefor SI load10%for SI load20%for SI load30%for 2 0.0047 0.0047 0.0047 0.0047 3 0.0043 0.0043 0.0043 0.0043 4 0.0116 0.0116 0.0116 0.0116 5 0.0022 0.0022 0.0022 0.0022 6 0.0010 0.0010 0.0010 0.0010 7 0.0160 0.0160 0.0160 0.0160
11 0.0026 0.0026 0.0026 0.0026
Global Best position
Certified Journal | Page
Gbest=bestpositionofallparticles.
© 2022, IRJET | Impact
6 8th bus 4th bus 7th bus
3 7th bus 8th bus 4th bus
2 7th bus 8th bus 4th bus
Mode 7th bus 8th bus 4th bus
International Journal Engineering Technology ISSN: 2395 0056
8th Bus 70.8147 71.2604 14.7 14.7 4th Bus 87.1836 87.4843 16.9 16.9
Table 2 : Optimal sizing of D STATCOM for analyticalmethodandPSOmethodinbasecase
8 0.0150 0.0150 0.0150 0.0150
The top three voltage stability index values are sortedindescendingorderandthentrialanderrormethod andparticleswarmoptimizationwillbecarriedouttofind theoptimallocationamongthesethreebusses
www.irjet.net p
Volume: 09 Issue: 03 | Mar 2022 ISSN: 2395 0072 Factor value: 7.529 ISO 9001:2008 1603
7 7th bus 8th bus 4th bus
lAnalyticaMethod MethodPSO MethodAnalytical methodPSO
of
Research
5 7th bus 8th bus 4th bus
BeforeplacetheD STATCOMthetotalpowerlossis 19.7KW.AnafterplacingtheD STATCOMthetotalpower lossisreducedto12.5Kw.TwoD STATCOMplacementis enough for attain the minimum loss. In before D STATCOM,allthebusvoltagesarewithinthelimitin12 busradialdistributionsystem.
4 8th bus 7th bus 4th bus
10 0.0032 0.0032 0.0032 0.0032
1 7th bus 8th bus 4th bus
Table 3: OptimallocationandSizingofD STATCOM Sizing of D (KVAR)STATCOM Transmission loss (KW)
19 0.0011 0.0044 0.0044 0.0044
22
Transmissionloss byincreasing20% load(KW) 20 12.5
26
435, 437.2,436.1,438.3 435, 437.2,436.1,438.3
| Mar 2022 www.irjet.net p
Minimumvoltage(p.u) 0.9414 0.9419
4 0 0 0 0
TotalReactivepower inBasecase,+10% +20%load,load,+30% load(KVAR) 390, 392.2,391.1,393.3 390, 392.2,391.1,393.3
16 0 0.0003 0.0003 0.0003
International ISSN: 2395
10 0.0011 0.0044 0.0044 0.0044
8.1.2 IEEE34 BUS RADIAL DISTRIBUTION SYSTEM
17 0.0009 0.0002 0.0002 0.0002 0.0009 0.0035 0.0035 0.0035
34
18
Transmissionlossin basecase(KW) 19.7 12.4
11 0 0 0 0
5 0.0008 0.0032 0.0032 0.0032
Research Journal of Engineering and Technology (IRJET) e
12 0.0005 0.0022 0.0022 0.0022
Number SI baseforcase SIfor10% load SI 20%forload SI 30%forload
13 0.0005 0.0020 0.0020 0.0020
8 0.0017 0.0066 0.0066 0.0066
9 0 0 0 0
25
Table 6: OptimallocationofD STATCOMatdifferent location S.no No of run Global Best position 1Position 2Position 3Position 1 8thBus 23rdBus 21rdBus 2 8thBus 23rdBus 21rdBus 3 8thBus 23rdBus 21rdBus 4 23rdBus 8thBus 21rdBus 5 8thBus 23rdBus 21rdBus 6 8thBus 23rdBus 21rdBus 7 23rdBus 8thBus 22ndBus
8.1.3 Voltage Stability Index:
7 0 0 0 0
27
32
29
Description Without STATCOMD With STATCOMD
Transmissionloss byincreasing30% load(KW) 20.1 12.6
© 2022, IRJET | Impact Factor value: 7.529 | ISO 9001:2008 Certified Journal | Page1604
2 0 0 0 0
14 0.0003 0.0014 0.0014 0.0014
23 0.0017 0.0066 0.0066 0.0066 0.0010 0.0040 0.0040 0.0040 0.0011 0.0044 0.0044 0.0044 0.0007 0.0028 0.0028 0.0028 0.0003 0.0022 0.0022 0.0022 0.0003 0.0020 0.0020 0.0020 0.0003 0.0011 0.0011 0.0011 0.0003 0.0011 0.0011 0.0011 0.0002 0.0011 0.0011 0.0011 0.0003 0.0011 0.0011 0.0011 0.0002 0.0008 0.0008 0.0008 0.0001 0.0005 0.0005 0.0005
15 0.0002 0.0007 0.0007 0.0007
21 0.0014 0.0055 0.0055 0.0055 0.0014 0.0055 0.0055 0.0055
TotalActivepower inBasecase,+10% +20%load,load,+30% load(KW)
31
3 0.0006 0.0023 0.0023 0.0023
Volume: 09 Issue: 03 ISSN: 2395 0072
4th Bus 70.8147 71.2604 87.1836 87.4843
30
24
Table 4 :Comparison result with and without D STATCOM
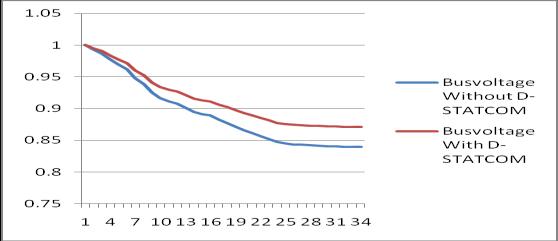
Busnumber8isthemorestableandhighestvalue ofstabilityIndexwhichisselectedascandidateBustoplace the D STATCOM in the IEEE 34 Bus radial distribution system.
33
28
0056
20 0.0011 0.0040 0.0040 0.0040
6 0.0008 0.0032 0.0032 0.0032
Fig 7: Bus voltage profile in IEEE34 bus
Transmissionloss byincreasing10% load(KW) 19.9 12.4
Table-5: VoltagestabilityIndex
|
10 8thBus 23rdBus 21rdBus Mode 8thBus 23rdBus 21rdBus
Volume: 09 Issue: 03 | Mar 2022 ISSN: 2395 0072 2022, IRJET Impact Factor value: 7.529 | ISO 9001:2008 Certified Journal | Page1605
2883.42880
International Research Journal of Engineering Technology (IRJET) ISSN: 2395 0056
8 8thBus 23rdBus 21rdBus
Table 7: OptimalsizingofD STATCOMforanalytical andPSOmethodinbasecase
Transmissionloss byincreasing30% load(KW) 132.3399 94.3469
9. CONCLUSION
8thbus 398.5237 448.1481 125.8953 118.3140 8th Bus23rdand 326.1786&398.5237 448.1481&448.1481 112.3405 103.2646 21rdbus23rd8th &326.1786&398.5237386.8826 537.7778&448.1481&448.1481 102.7214 93.8646 2883.42876.8,2880,2873.5, 2873.5,2876.8,
methodAnalytical
for analytical method and PSO method in base case
www.irjet.net p
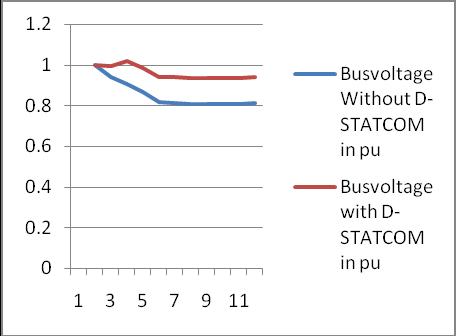
TheBusnumber3ishavingthehighestvalueofSI, whichisselectedascandidatebus.D STATCOMisplacedby assuming voltage at 3rd bus as 1pu. The current and reactive power to be injected is calculated. The load flow analysisiscarriedoutbyusingtheinjectedreactivepower. Theresultshowstheimprovementofvoltageprofile.The bus voltage increased to 0.9358 from 0.8076 which is minimumbeforeplacingD STATCOM
8.1.4 Optimal sizing STATCOM
Fig.8.BusvoltageprofileforKarumathurFeeder
method
Checkanuranisubstationresultsareanalyzedfor4 feeders only, namely Karumathur, Thenpalanji, Gandhi Nagar and Kannanur feeders. For other two feeders the voltage profile is found to be within limit and hence the placingofD STATCOMisnotrecommended
locationOptimal SizingofD STATCOM (Kvar) loss(KW)Transmission methodPSO methodPSO
Transmissionloss inbasecase(KW) 131.6234 93.8646
Transmissionloss byincreasing10% load(KW) 131.8778 94.0341
Theproposedworkexplainsaboutamethodwhich isusedtoimprovethevoltageperformanceoffeedersina substation and hence reduce the power loss. Sweep algorithmisusedtodeterminethebusvoltageandpower lossinIEEE12,IEEE34busanddistributionfeedersnamely Karumathur , Gandhinagar, Thenpalanji, Kannanur and averagevoltageofbusesinthebusesare0.9653pu,0.8645 andfeedersare0.8529pu,0.8670pu,0.9903pu,0.6126pu respectively.ThepowerlossesfortheIEEEbusesare19.7 KW,131.6234KWandfeedersare925.2KW,569KW,43.2
e
©
9 8thBus 21rdBus 23rdBus
8.2.1 Karumathur Feeder
Minimumvoltage (p.u) 0.8395 0.8713
Table 8: ComparisonresultwithandwithoutD STATCOM Description DWithoutSTATCOM DWithSTATCOM Total +30%load,+20%load,case,+10%powerActiveinBaseload(KW) 4646.443.1,4636.5,4639.8,46 4646.443.1,4636.5,4639.8,46 Total load+20%load,case,powerReactiveinBase+10%load,+30%(KVAR)
Transmissionloss byincreasing20% load(KW) 132.1326 94.2037
8.2 Checkanurani Substation
ThreeD STACOMplacementisenoughtoattainthe minimumloss.Thebusnumber8,23,21hashighestvalues ofstabilityIndex.Thelossesarereducedfrom131.6234to 93.8646 KW. The minimum bus voltage increased from 0.8395to0.8713pu.
of D
methodAnalytical
and
REFERENCES
Ms.C.DHANALAKSHMI M.E., LECTURER Department, of Electrical and ElectronicsEngineering, LakshmiAmmalPolytechnicCollege, KOVILPATTI 628503

International Research Journal of Engineering and Technology (IRJET) e ISSN: 2395 0056 Volume: 09 Issue: 03 | Mar 2022 www.irjet.net p ISSN: 2395 0072 © 2022, IRJET | Impact Factor value: 7.529 | ISO 9001:2008 Certified Journal | Page1606
KW, 7776 KW, as respectively. This work presents an efficient approach for the placement of D STATCOM in radialdistributionsystem.Voltagestabilityindexvaluesfor allthebusesaredeterminedtofindtheoptimalbuswhichis selectedascandidatebusforplacementofDSTATCOM.The D STATCOM is modelled by calculating injected reactive power for different reference voltages. Particle swarm optimizationalgorithmisusedtofindsizingofD STATCOM. The resultant reactive power for IEEE12 bus is 92.3716 KVAR,IEEE34 bus is 448.1481KVAR and Karumathar is 1KVAr,Gandhinagar0.047KVAr,Thenpalanji0.1609KVAr, Kannanur150.4478KVAr.Again,theloadflowanalysisis performedbycompensatingthereactivepowerandvoltage phase angle. The improved bus voltage for IEEE12 bus is 0.9655,IEEE34busis0.9140puandKarumathuris0.9609 pu, Gandhinagar 0.9259pu, Thenpalanji 0.9907 pu, Kannanur 0.9440 pu. The reduced power losses for the IEEE12,IEEE34busesare12.4KW,94.0341KWandfeeders are320KW,43.2KW,388.8KW,and6494KWrespectively. The result shows the improvement in voltage profile and reduction in power losses. In future, ANN or Fuzzy logic could be used to adjust the rating of DSTATCOM for variationsinloadoranycontingencycases.
[1]SelvarajGaneshRajangamKanimozhi,“Meta heuristic technique for network reconfiguration in distribution system with photovoltaic and D STATCOM” 30th October 2018, Vol. 12, Issue 20, IET Generation, Transmission & Distribution.
Selvan. S. SURESH, III Year DEEE, LakshmiAmmalPolytechnicCollege, KOVILPATTI 628503 Selvan. K.RAJARAM, II Year DEEE, LakshmiAmmalPolytechnicCollege, KOVILPATTI 628503
Mr.P.KALIDASS B.E., LECTURER, Department of Electrical and ElectronicsEngineering, LakshmiAmmalPolytechnicCollege, KOVILPATTI 628503


[7]765,DevelopingInternationalConferenceonAlternativeEnergyinCountriesandEmergingEconomies,pp,7592015.K.R.Devabalaji
(Elsevier)
[5]SeyedAbbasTaher,SeyedAhmadrezaAfsari,“Optimal sizing of DSTATCOM in distribution systems by immune algorithm”, Electrical power and energy system, vol.60, pp.34 44,February2014.
[6]T.YuvarajK.R.DevabalajiK.Ravi“Optimalplacementand sizing of DSTATCOM using Harmony Search algorithm”
[4] S.Devi M.Geethanjali, “Optimal location and sizing determinationofDistributedGenerationandD STATCOM using Particle Swarm Optimization algorithm” (Elsevier) Electrical powerandEnergy System, Vol.62, pp,562 570, May2014.
, K. Ravi, “Optimal size and siting of multipleDGandDSTATCOMinradialdistributionsystem using Bacterial Foraging Optimization Algorithm”, Ain ShamsEngineeringJournal,vol.7,pp.959 971,2016.
BIOGRAPHIES:
[3] Atma Ram Gupta, Abhinav Jain, Ashwani Kumar, “Optimal DSTATCOM Placement in Radial Distribution SystemBasedonPowerLossIndexApproach”International conferenceofenergy,powerandEnvironment,2015.
[2] AbhinavJainA.R.Gupta,AshwaniKumar,“AnEfficient Method for D STATCOMPlacement inRadial Distribution System”6thIEEEIndiaInternationalConferenceonpower Electronics,December2014.
