2 minute read
8th Bus 23rd Bus 21rd Bus


International Research Journal of Engineering and Technology (IRJET) e-ISSN: 2395-0056 Volume: 09 Issue: 03 | Mar 2022 www.irjet.net p-ISSN: 2395-0072
converter (VSC), coupling reactor and controller. The DSTATCOM is modelled by calculating injected current and injected reactive power with different reference voltage.
Advertisement
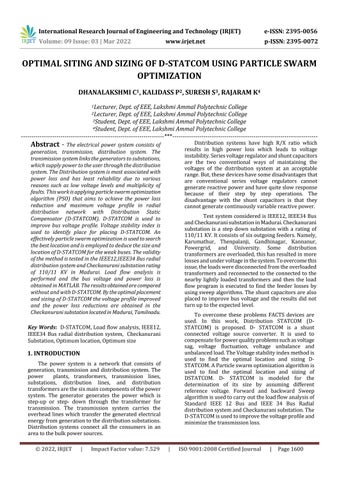
Fig 2:Single line diagram of two bus distribution system with D-STATCOM
Im=( Pn-jQn)/ Vn* .... (8) IDS= (Vn1cosӨn-h1)/(-h4sinӨn-h3cosӨn) …. (9) h1= real(Vm1∟Өm)-real(Zm.Im∟δ) h3=-Xm h4=-Rm QDS= (Vm1∟Ө n). (IDS∟(π/2+Ө n)) …. (10) * denotes the complex conjugate.
Where,
QDS= Reactive power by D-STATCOM IDS = Current injected by D-STATCOM Vm1= Sending end voltage (previous bus) Vn1= Receiving end voltage (candidate Bus)
Өm=phase angle of Vm1
Өn=phase angle of Vn1 δ= phase angle of Im 5. PROPOSED METHODOLOGY
Algorithm for radial distribution system is givenbelow:
Step 1: Input line and bus data, and set bus voltage limits. Step 2: Calculate the power loss using backward-forward sweep in distribution system. Step 3: Randomly produces an initial population of particles with random positions and velocities on volume in the solution space. Step 4: For each and every particle if the bus voltage is within the limits in eachparticle, calculate transmission loss or, that particle is infeasible. Step 5: For each particles, analyze its objective value with the individual best. If the objective value is lower than P best, set this value as the current P best, and note the corresponding particle position. Step 6: Update the velocity and position of particle respectively. Step 7: If the iteration number attain the maximum limit,go to Step8Or set iteration i = i+ 1, and go back to Step 4. Step 8: Print the optimal solution to the target problem. The best position includes the optimal locations and size of DSTATCOM, and the corresponding fitness value representing the minimum power loss.
6. TEST SYSTEM
The test system considered in this paper is a stepdown substation with the rating of 110/11kV. The substation has two common buses and six outgoing feeders. Bus1 is connected to station transformer and Bus2 is connected to potential transformer. These buses are interconnected through common switch. Each bus consists of three feeders i.e., Bus1is connected to Power grid, Thenpalanji and Kannanur. Bus2 is connected to University, Gandhi Nagar and Karumathur. The feeders are interconnected through common switch. Totally the test system consists of six feeders.
Fig 3: Single line diagram of Checkanurani Substation
Karumathur, Gandhinagar, Kannanur and Thenpalanji feeders consist of twenty, twenty two, forty and seventeen distribution transformers with the total rating of 2479 KVA, 2763 KVA,5877 KVA, and 2075 KVA respectively. The power grid and university feeders consist of one and three distribution transformers with the rating of 250 KVA and 100 KVA. The total load for the test systemis 22202.15 KW. The total capacities of the distribution transformers are 13444KVA.

7. PARTICLE SWARM OPTIMIZATION
Particle swarm optimization is a computational method that optimizes a problem by iteratively trying to improve a candidate solution with regard a given measure of quality.
Update velocity:
Vik+1=c*[wvik+c1r1*(Pbest- Sik)+c2r2*(Gbest- Sik)]
Update position:
Sik+1=Sik+ Vik+1
Where, w= weighting coefficient c1, c2= acceleration coefficient