2Professor, Department of Statistics, Annamalai University, Annamalai Nagar 608 002 Chidambaram, Tamil Nadu, India ***
Abstract This paper deals with a new version of Sujatha distribution, and we refer to the new distribution as alpha power transformed Sujatha distribution. For various parametric values, different shapes of the probability density function and hazard function have been provided. Some structural properties of the model have been derived and illustrateAtdiscussed.Theestimationoftheparametersisalsocarriedout.theendofthestudy,twodatasetsareexaminedtotheusefulnessandflexibilityoftheproposedmodel.
Characterization and Estimation of Alpha Power Sujatha Distribution with Applications to Engineering Data
Distribution fitting has played a significant role in many fieldsofscience.Itisusedtochooseamodelwhichdefines thestructureofdataresultingfromarandomprocess.The benefitoffittingdistributionstoreal lifedataisthatmore appropriate models for the random process can be developed. In statistical theory, extensions over the distributionshavebecomeaprominentmethod.Generally, new distributions with the addition of parameters can be obtainedeitherbycombiningtheexistingdistributionsorby the use of generators. The objective of adding new parameterstothedistributionprovidesmoreflexibilityto the standard distributions for valuable analyses of complicated data structures Sujatha distribution was suggested by Shanker [1] is a one parameter continuous distributionwithanincreasingfailurerate.Thisdistribution isamixtureofthreecomponents,exponentialdistribution (θ), a gamma distribution (3,θ) and a gamma distribution (2,θ)withdifferentmixingproportions.
sectionbeensectionhasReliabilitypowerdistributionsthatIninvestigatedmodelingintroduceddistribution,andAlphaPowerRamadistributionwasbyMaryamandKannan[10,11,12,and13]forreallifedata.Somepropertiesofthemodelwereandalsoillustratetheimportanceofthemodel.thisstudy,anewdistributionformodelingreallifedataprovidesmoreflexibilityindatafittingthantheexistinghasbeendeveloped.Insection2,theAlphatransformedSujathadistributionhasbeenpresented.propertiesofthenewlygenerateddistributionbeenobtainedinsection3andstatisticalpropertiesin4.Insection5and6,entropy,orderstatisticshasstudied.BonferroniandLorenzcurvesarediscussedin7.Themethodofmaximumlikelihoodandleast


1. INTRODUCTION
developedbyShanker,Shukla et al. [4]inadditiontosome characteristicsanditalsoillustratesitsimportance.Shanker, Shukla et al. [5] provided a new two parameter Poisson Sujatha (NTPPS) distribution. They investigated different modelpropertiesaswellastheirusefulnessindiscretedata. A new two parameter Poisson Sujatha distribution is a mixture of Poisson distribution which includes Poisson Sujatha distribution and Poisson Akash distribution as specialcases.Atwo parameterPoisson Sujathadistribution was proposed by Shanker, Leonida et al. [6] with its characteristicsalongwiththeestimationoftheparameters and demonstrate its usefulness by using real life data. Shankar [7] introduced another two parameter Sujatha distribution having a shape and scale parameters and studieditsdifferentproperties.Thisdistributionisamixture of three components, a gamma distribution , exponential distribution gamma distribution.NewQuasiSujathadistributionwasproposed by Shanker and Shukla [8] and discussed its statistical characteristics, estimation and applicability is also determinedbyusingreal lifedata.
Maryam Mohiuddin , Kannan
Keywords Alpha Power Transformation, Sujatha Distribution,ReliabilityMeasures, Moments,Maximum Likelihood Estimation
2
1
MahdaviandKundu[9]suggestedamodeltodevelopanew familyofdistributionsbyincorporatingashapeparameter usingAlphaPowerTransformation(APT)approachtobring more flexibility to the model. The model has the characteristic that it provides an upside down bathtub hazardfunctiondependingonitsparameters.Alphapower transformed Aradhana distribution, Alpha power transformed Quasi Aradhana distribution, Alpha Power Garima
International Research Journal of Engineering and Technology (IRJET) e ISSN: 2395 0056 Volume: 09 Issue: 03 | Mar 2022 www.irjet.net p ISSN: 2395 0072 © 2022, IRJET | Impact Factor value: 7.529 | ISO 9001:2008 Certified Journal | Page1421

1Research Scholar, Department of Statistics, Annamalai University, Annamalai Nagar 608 002 Chidambaram, Tamil Nadu, India
To overcome the inadequacy of the existing distributions, several researchers introduced many generalizations and extensions of the Sujatha distribution. A two parameter SujathadistributionwaspresentedbyTesfayandShanker [2]andalsodiscussedthedifferentpropertiesofthemodel. SizebiasedLindleydistributionandSujathadistributionisa particular case of two parameter Sujatha distribution. ShankerandHagos[3]studiedsize biasedPoisson Sujatha distributionanditsapplicationstocountdataexcludingzero counts. AgeneralizationofSujatha (AGS)distributionwas
R.
1;0,,0,1(6) 1
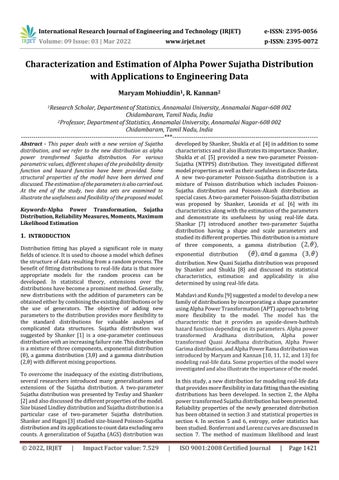
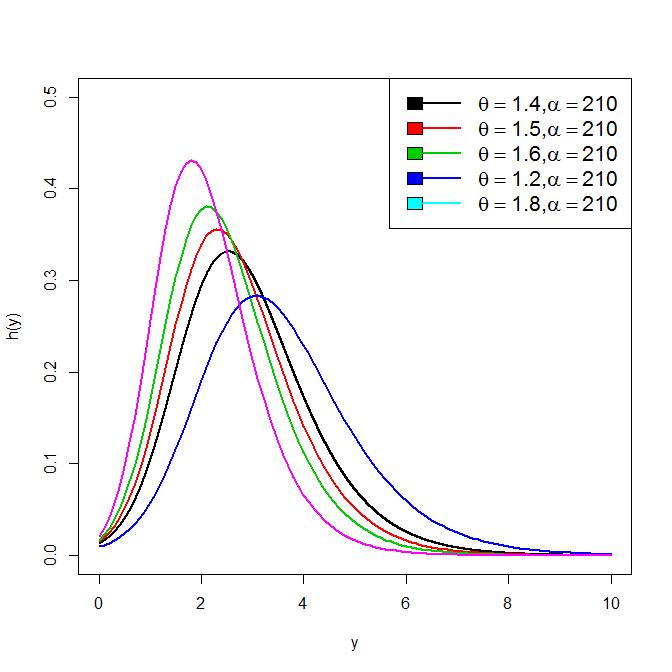
Fig- 1: PdfplotsofAlphaPowerSujathadistribution
();1,0, log1();1,0, (;) () gyifyR gyifyR fy Gy APT
squareisemployedfortheparameterestimationinsection 8. Finally,thenewmodelisanalyzedusingthetwodatasets andaconclusionispresentedinsections9and10.
Mahdavi and Kundu proposed the Alpha power transformationmethod(APT)toincorporatetheadditional (shape)parametertothecontinuousdistributionsinorder to increase their flexibility. For a given cumulative distributionfunction(cdf)andprobabilitydensityfunction (pdf)ofabaselinedistribution,MahdaviandKundudefined the cumulative distribution function (cdf) of Alpha power transformationfamilyofdistributionsasfollows (3)
Substitutingequation(2)intoequation(3), thecumulative distributionfunctionofAlphaPowerTransformedSujatha (APS)distributionisgivenby (;,)
where, and arethecdfandpdfofthebaseline distribution and the corresponding probability density functionisgivenby (4)

2. ALPHA POWER TRANSFORMED SUJATHA DISTRIBUTION
The probability density function of the Alpha Power TransformedSujatha(APS)distributionisdefinedfrom(4) bytaking(1)and(2)andisgivenby
International Research Journal of Engineering and Technology (IRJET) e ISSN: 2395 0056 Volume: 09 Issue: 03 | Mar 2022 www.irjet.net p ISSN: 2395 0072 © 2022, IRJET | Impact Factor value: 7.529 | ISO 9001:2008 Certified Journal | Page1422
2;0,0(2) 2 (;)11 2 ey yyGy y
GyifyR ifyR Fy Gy APT ();1,0, ;1,0, 1 1 (;) ()


2 2 11 2 Fyy ye yy APS
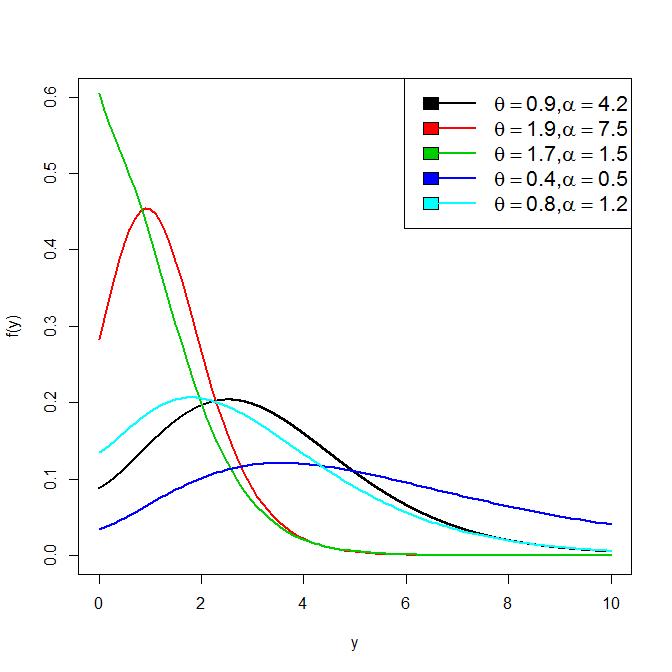
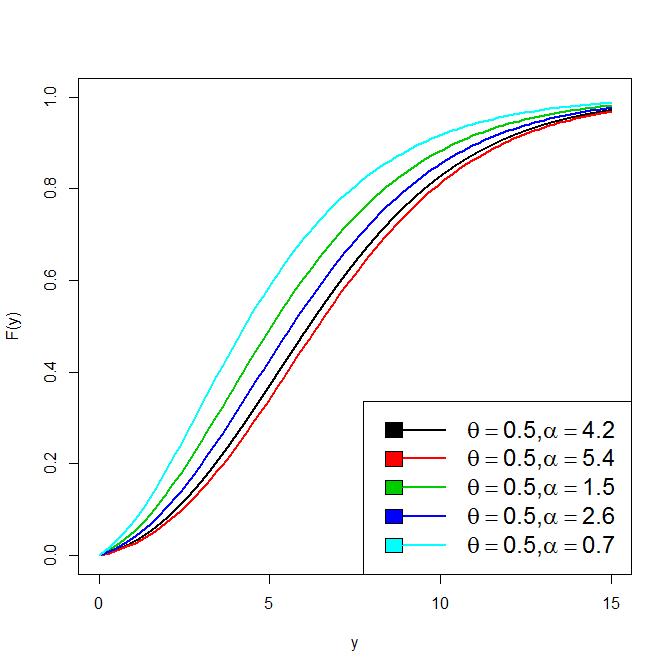
The density function of the proposed distribution provide thedesiredshapesfordifferentsetsofparameters.Theplots forpdfandcdfofthedistributionfordifferentvaluesofthe parameter isshowninfigures1and2.
;0,,0,1(5) 1 12(;,)log 2 2 11 2 2 3 2 y fyyye ye yy y APS
1;0,0 2 (;) 2 2 3 gyyyey y (1) and
A random variable is said to have Sujatha distribution withparameter ifitsprobabilitydensityfunctionisgiven by itscumulativedistributionfunction(cdf)isgivenby
3. RELIABILITY PROPERTIES
This section is devoted to obtain the expression for reliabilitymeasuresofthemodelthatincludethereliability function, hazard function, mean residual life and mean waiting time of the Alpha power transformed Sujatha (APTS)distribution.
3.1 Reliability Function


The expression for reliability function of the Alpha power transformedSujatha(APTS)distributionisexpressedas Ry (7)
plotofAlpha
TheexpressionforthehazardfunctionoftheAlphapower transformedSujathadistributionisdefinedas
3.2 Hazard Function
;1(;,)1 2 2 11 2 ye yy
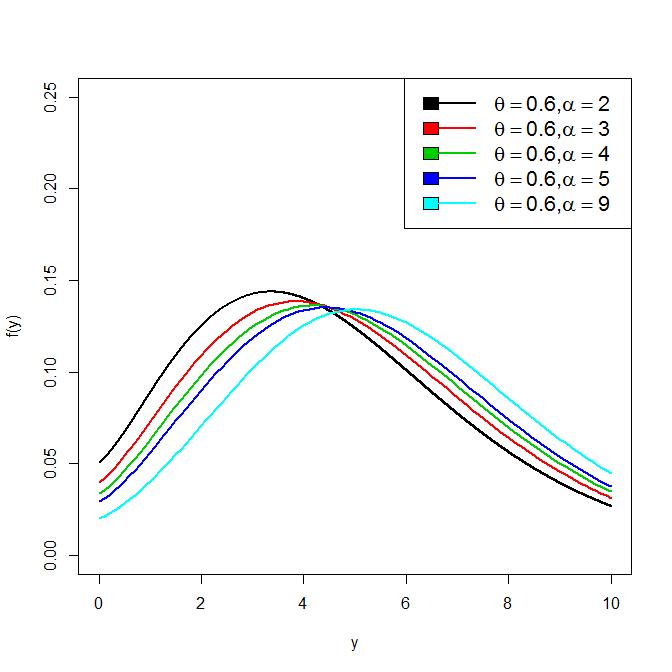
Fig- 4: HazardplotsofAlphaPowerSujathaDistribution
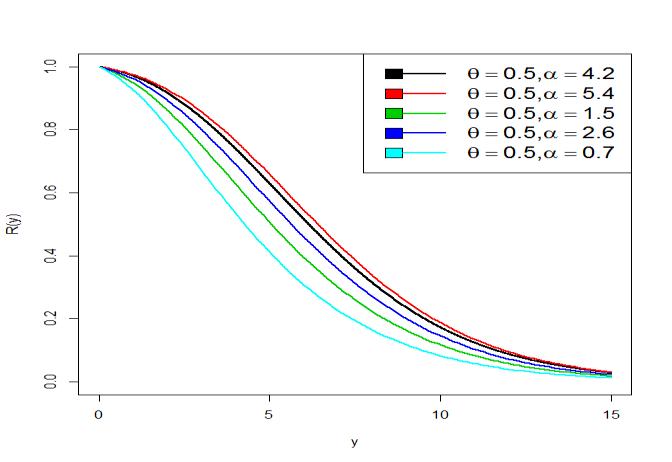
Theplotsofreliabilityfunctionandhazardfunctionofthe distribution for different values of the parameter (θ, α) is presentedinfigure3andfigure4.
Figure1revealsthatthedensityfunctionoftheAlphaPower Transformed Sujatha distribution tends to the normal distribution when and . The pdf is decreasing, left skewed and uni model for the parameter value and .
2:
International Research Journal of Engineering and Technology (IRJET) e ISSN: 2395 0056 Volume: 09 Issue: 03 | Mar 2022 www.irjet.net p ISSN: 2395 0072 © 2022, IRJET | Impact Factor value: 7.529 | ISO 9001:2008 Certified Journal | Page1423
Fig cdf PowerSujathaDistribution
1log;0,1 2 1 (;,) 2 2 3 2 2 1 2 2 1 2 2 y e yy e yy yye hy y y (8)
Fig 3: ReliabilityplotofAlphaPowerSujatha Distribution
Dyfydy t (;,) 0 yyyedy D ye yy y t 2 2 11 2 0 2 3 2 1 12 log (10) Usingthepowerseriesexpansionto(10), r r r y y r 0 ! log
becomes, yyyeyyedy r D ry r y t r r 2 2 11 ! (log) 12 log 2 2 0 0 2 3
International Research Journal of Engineering and Technology (IRJET) e ISSN: 2395 0056 Volume: 09 Issue: 03 | Mar 2022 www.irjet.net p ISSN: 2395 0072 © 2022, IRJET | Impact Factor value: 7.529 | ISO 9001:2008 Certified Journal | Page1424
3.3 Mean residual life
Thegraphdisplaysvariousshapesforthehazardfunctionof AlphapowertransformedSujathadistributionfordifferent arbitraryparametervalues.Fordifferentparametervalues, thefailureplotisleft skewed,uni modalanditcontinuesto decreasefor, and
3.4 Mean waiting time meanwaitingtimeofrandomvariable isdefinedby (14). (14)


Substituting equation (4) and equation (5) into equation (14),weobtainthemeanwaitingtimeoftheAlphapower transformedSujathadistributionas
(1)(1),(24) 1 (1)(1),(23) 1 (1),(22) 1 21 ! (log) 1 log 2 1 1 1 () 2 122 2 0 0 0 20 2 11 2 rtst r rtst r rtst rr u t t s s r tt st t sru r r s s t t u e yy y
expansion
4.1 Moments
2 2 11 2 0 122 2 0 0 0 2 (1)(1)(24) 1 (1)(1),(23)(1),(22)1 1 21 ! (log) 1 log 2 ()1 1 ()
n s ns y s n y 0 (1) (13) Theequation(12)takestheform, yyyyyedy sr r D ry ts r rr s (1) 2 2 0 0 0 2 3 2 2 1 ! (log) 12 log On
Moments are of great importance to understand the most importantcharacteristicofthedistribution.Theyarehelpful
Inthissection,somecharacteristicsofthedistribution,such as moments, moment generating function, characteristic function, order statistics, renyi entropy, tsallis entropy, BonferroniandLorenzcurvehavebeeninvestigated.
The
4. STATISTICAL PROPERTIES
EtyfydytSt t t ()()(;,) 1 () 0
Usingthebinomial (13)to(12),wehave simplification,theresultingequationbecomes
t rtst r rtst r rtst urr t t s s r Et t e yy r t rsust s s t u
The
t yfydyFt tt 0 ()(;,) 1 ()
Let is a continuous random variable with reliability function(7).Then,themeanresiduallifeoftheAlphapower transformedSujathadistributionisgivenby (9) (11) equation(10) (12)
0 ! () p p ty p ty e ,
rewrittenas yfydy p t Mt APS p p p Y ()!() 0 0

MtEeefydy APS tyty Y ()()() 0 Using

International Research Journal of Engineering and Technology (IRJET) e ISSN: 2395 0056 Volume: 09 Issue: 03 | Mar 2022 www.irjet.net p ISSN: 2395 0072 © 2022, IRJET | Impact Factor value: 7.529 | ISO 9001:2008 Certified Journal | Page1425 togetanideaaboutmean,variance,kurtosisandskewness ofthelifetimedata. Let denotesarandomvariablewithpdf(5)thenthe ordermoment ofAPSdistributionisdefinedas EYyfydy n n n ()() 0 EYyyyedy ye yy nny 2 2 11 2 0 2 3 2 1 12()log Applying(15) power series expansion (11) and binomial expansion(13)toequation(15),weget yyyyyedy r Ey ry r n r r n (1) 2 2 0 0 2 3 2 2 11 ! (log) 12()log (16) yyyedy ur t t s s r EY sntry u s sr r r s s t t u n 2(1) 0 2 2 0 0 0 0 2 3 1 2 ! (log) 2 12()log (17) Byusingthegammafunction yedy y 0 1(,) to equation (17), and we obtain expression for the moment of the Alpha power transformed Sujatha distribution. ()23 2 1 2 0 0 0 0 1 2!121!122! 2 2 1 1 log !!!!()log ntnst su r r s s t t u r n r nstrnstrnst rssttuu EY Takin(18)gthevaluefor inequation(18),weobtainthe meanofAPSdistributionwhichisgivenby (1)24 2 1 2 0 0 0 0 1 21!122!123! 2 2 1 1 log !!!!()log tst su r r s s t t u r r snrstrst rssttuu EY WegetthesecondmomentofAPSdistributionbyplugging n=2intoequation(18). (2)25 2 1 2 0 0 0 0 2 1 22!123!124! 2 2 1 1 log !!!!()log tst su r r s s t t u r r snrstrst rssttuu EY By plugging , we get the third moment of the APS distribution. (3)26 2 1 2 0 0 0 0 3 1 23!124!125! 1 2log 2 1 !!!!()log tst su r r s s t t u r r snrstrst rssttuu EY
4.2 Moment Generating Function of APS Distribution bearandomvariablewithcdfandpdfofAlphapower transformed Sujatha distribution, then the moment generatingfunctionof isdefinedby theexpansion, theaboveexpression be


If
can
weget, 0 2 2 0 2 3 2 2 1 1 ! (log) 12 log 1log 1 yyedy yye r R ry r y r r (21) Onsimplification,weobtaintheresultingequationas 0 (21)1() 2 0 0 0 0 0 0 2 3 2 !2 (log) 12 log 1log 1 yedy r n m um t t s s r R sstmnry u rs t u m m n r r s s t (22) Aftersimplifyingtheexpression(22),theRenyientropyof thedistributionisobtainedas

5.1 Renyi Entropy
0 2 2 1 2 2 3 2 1 12 log 1log 1 yyedy R ye yy y
and
International Research Journal of Engineering and Technology (IRJET) e ISSN: 2395 0056 Volume: 09 Issue: 03 | Mar 2022 www.irjet.net p ISSN: 2395 0072 © 2022, IRJET | Impact Factor value: 7.529 | ISO 9001:2008 Certified Journal | Page1426 ()23 2 1 2 0 0 0 0 0 1 2!121!122! 2 2 1 1 log !!!! log()! ptpst su r r s s t t u r p p Y r pstrpstrpst prssttuu t Mt 4.3 Characteristic Function of APS distribution If thenthecharacteristicfunctionisobtainedby usingtherelation. ()() tMitYY ()23 2 1 2 0 0 0 0 0 1 22! 2!121!1 2 2 1 1 log !!!! log !()() ptpst su r r s s t t u r p p Y r pst pstrpstr prssttuu it t
Using
to
5. ENTROPY MEASURES
LetYbearandomvariablewithcdf(4)andpdf(5)ofAlpha power transformed Sujatha distribution, then the renyi entropy[16]oftheproposeddistributionisdefinedby , 1(19)
Clausius [14] provides an idea of entropy to measure the quantity of energy that does not generate energy in the system. Entropy has played an important role in many practiceslikephysics,non equilibriumprocesses,principle of thermodynamics and principle of maximum entropy production etc. Moreover, Shannon made of cornerstone upon which he laid out his theory of information and information.transmission,Entropyintellacommunication.Entropyandotherassociatedmeasuresplayvitalroleincurrentinnovativeapproachestoartificialigenceandcollectivebehaviour.orinformationtheoryisthestudyofthehandling,utilization,andretrievalofShannon[15]originallyintroducedtheconcept of entropy in his article, “Mathematical theory of communication”afterviewinginformationastheresolution of uncertainty. Information is a collection of possible messageswiththeaimofsendingthemoveranoisychannel andthenhavingareceiverreconstructthemessagewitha low chance of error despite the noise. Entropy is an importantmeasureusedinthequantification,storageand transmission of information. There exist various entropy measuresinliteraturebutthemostpopularandwidelyused aregivenas
Substituting equation (5) into equation (19), (19) is rewrittenas (20) theexpansions(11) (13) equation(20),

dy yye S ye yy y 0 2 2 11 2 2 3 2 1 12 log 1 1 1 () Aftersimplification,weget 221 2 0 0 0 0 0 0 () 2(21) 2 ! (log) 1 1log 1 1 () stmn su s rr r r s s t t u m m n r stmn nr m um t t s s r S
nk e yy k e yy e yy y Yk y y y knkyye nfy 1 1 1 1 1 1 12 log 1!!()! 2 2 11 1 2 2 11 2 2 11 2 2 3 () 2 2 2 The expression for the largest order statistic of the Alpha puttingpowertransformedSujathadistributionisobtainedbyinequation(24)andisgivenby 1 2 2 11 2 2 11 2 2 3 () 1 1 1 12 log () 2 2 n e yy e yy y Yn y y e yy fyn The expression for the smallest order statistic of the
compel the distribution to be symmetric, which might be problematic when dealing with extremes where distributionsareasymmetric.Thehighestorderstatisticsis useful in studying floods and meteorological phenomena. Order statistics are more applicable in engineering fields. Lifetestingprovidesanidealillustrationoftheadvantagesof orderstatisticsinthecaseofcensoredsamples.
5.2 Tsallis Entropy
The literature on order statistics is very extensive. Order statistics is regarded as one of the most essential tools in non parametric and inferential statistics. It describes random variables arranged in ascending order of their magnitude. They play important role in many statistical applications including modeling auctions, car races, estimatingparameters,optimizingtheproductionprocess, risk management, reliability of systems, quality control, outlier detection, and many other applied areas. This techniqueisapplicableevenforsmallsamplesbecauseitis notbasedonasymptotictheory.Thedistributiondoesnot
Considerasetofrandomvariables ... whichare independent and identically distributed. The probability densityfunction(pdf)oftherandomvariablesprovidesthe distribution of the order statistics. The st1 order statistic isthesetoftheminimumvaluesfromthesetof randomvariables.The orderstatistic isthesetof themaximumvaluesfromthesetof randomvariables.

nk Y k YkYYknkfyFyFy nfy 1!!()()1()()! 1 ()
Substitutingequations(5)and(6)intoequation(24),thepdf of orderstatistic oftheAPSdistributionisgivenby


Sfydy 11() 1 () 0
International Research Journal of Engineering and Technology (IRJET) e ISSN: 2395 0056 Volume: 09 Issue: 03 | Mar 2022 www.irjet.net p ISSN: 2395 0072 © 2022, IRJET | Impact Factor value: 7.529 | ISO 9001:2008 Certified Journal | Page1427 21 2 2 0 0 0 0 0 0 () (21) 2 !2 (log) 1 log 1log 1 stmn s rsu r r s s t t u m m n r stmn r n m m u t t s s r R
When equation (5) is substituted into equation (23), the equation(23)becomes


Suppose (1)(2)(3)() ,,,..., nYYYY be the order statistics of a random sample nYYYY ,,,,123 obtained from Alpha power transformed Sujatha distribution with pdf and cdf Then the probability density function of order statistic can be expressedas (24)
Tsallisentropy[17]ofarandomvariable oforder with pdf isdefinedby (23)


6. ORDER STATISTICS

This section is devoted to the estimation of parameters based on ordinary least square and maximum likelihood estimation for estimating the unknown parameters of the proposed model. In order to make the inference using parametric estimating techniques, the assumption of the density function must be known. However, in the case of real lifedatafitting,thetruedistributionisnotknownand prior knowledge is required the approximate the gap between the model and true distribution. Maximum likelihood estimation is one of the most powerful and acceptedapproachesformakinginferences.MLestimateis
TheLorenzcurveisagraphicalrepresentationofthedegree of inequality of income in a country. It was an American economist Max O. Lorenz [18] who proposed the Lorenz curveasa method for makingthecomparison between in income distribution of the population at different time points.TheLorenzcurveisrepresentedbyafunction , where is the cumulative proportion of income units represented by the horizontal axis. The vertical axis represents the cumulative proportion of the total income receivedbyunits,organizedfromlowtohighincomewhich isdenotedby .TheBonferronicurve[19]isoneofthe metricsthatcanberelatedtotheLorenzcurveandhasthe advantageofbeinggraphicallydepictedintheunit square (Giorgi and Mondani, [20]). The Bonferroni and Lorenz curves are not just to analyse the relationship between incomeandpovertyineconomics.Itisalsoemployedinthe areasofreliability,medicine,insuranceanddemography
The Bonferroni and Lorenz curves for a non negative randomvariable withdensityfunction isgivenby equations(25)and(26)asfollows yfydy p Bp 0 () 1 () (25)


TheexpressionfortheLorenzcurveisdefinedby q Lpyfydy 0 () 1 () (26) where, and ()Ey

(1)(1),(24) 1 (1),(23) (1) 1 (1),(22) 1 21 ! (log) 1 log 2 11 () 2 22 0 1 2 0 0 10 rqst r rqst r rqst r ur t t s s r p Bp st t u r rsr s s t t u TheLorenzcurveoftheAlphapowertransformedSujatha distributionisgivenby (1)(1),(24) 1 (1),(23) (1) 1 (1),(22) 1 21 ! (log) 1 log 2 11 () 2 22 0 1 2 0 0 10 rqst r rqst r rqst r ur t t s s r Lp st t u r rsr s s t t u

International Research Journal of Engineering and Technology (IRJET) e ISSN: 2395 0056 Volume: 09 Issue: 03 | Mar 2022 www.irjet.net p ISSN: 2395 0072 © 2022, IRJET | Impact Factor value: 7.529 | ISO 9001:2008 Certified Journal | Page1428 Alpha puttingpowertransformedSujathadistributionisobtainedbyinequation(24)andisgivenas 1 2 2 11 2 2 11 2 2 3 (1) 1 1 1 1 12 log () 2 2 n e yy e yy y Y y y yye fyn
Measure of inequality describes the extent to which a wellthatinequality.standardinequalityanalyzingeconomics.curveextentattemptstheaSimilarly,suchpopulationproportionsvariableunderstudyisdistributedunevenlyamongdifferentofthepopulation.Ifeveryproportionofthereceivesthesameproportionofavariablethenacaseisknownasthecaseofperfectequality.perfectinequalityisdefinedasasituationwhereinsingleunitofthepopulationreceivestheentireamountofvariableunderconsideration.Althoughtherehavebeentodevelopamathematicaltoolformeasuringtheofinequality.ThefirstmajorsuccesswastheLorenzduetoAmericaneconomistLorenz,inthefieldofSince1905,theLorenzcurveisapopulartoolforthedistributionofincome.ItisimperativetostudybecauseofthefactthatdisparityinthelivingofthepopulationistheoutcomeofincomeThereexistvarioustoolsinstatisticalliteratureareusedtostudythedisparity,wediscusssomeoftheknownandwidelyusedmeasuresofinequality.
The Bonferroni curve of the Alpha power transformed Sujathadistributionisgivenby
8. METHODS OF ESTIMATION
q
7 MEASURES OF INEQUALITY
7.1 Lorenz and Bonferroni Curves
9.1 DataSetI:Thedatasetprovidesthestrength(measured inGPA)of69singlefiberof20mmofgaugelengthreported byBadarandPriest[26].


8.2 Ordinary Least Square Estimation
8.1 Least Square Estimation: Leastsquareestimateisone of the approaches for estimating the parameters of the model inthecaseofregressiontheory.LSEisobtained by minimizingthesumofsquarederrorsbetweenthesample data and the fitted distribution function. Least square estimateoftheparameter istheestimate thatminimizes theleastsquarelossfunctionoftheform. Adisadvantageof theordinaryLSEisthattheestimationerrorisoftenlarger than that of MLE. To reduce the error, weighted LSE is designed.
2 1 () (,)1 n i i n i SEFY
analyticallybyusingRSoftwareandMathematica. 8.2
ML
where, () iFY isthecdfofAPSDistributionwith () iY being the thi order statistic. LSE of the population parameters can be obtained by minimizing the resulting equations, can be computed Maximum Likelihood Estimation obtain estimates the distributionwithsetof valuesfromthe thelikelihoodfunctionis givenby
n i e yy n Ei yyieyiyi 1 2 2 11 11log 1 1 , 222 2 11 (27) n i e yy n Ei yyieyiiy 1 2 2 11 2 11 1 1 , 222 2 1 Equating(28) equation (27) and (28) to zero and

To
n i e yy y ii iiy iLyyye 1 2 2 11 2 2 3 2 1 12(;,)log
9.2 DataSetII: Thedatasetrepresentsthefailuretimes(in hours) of 59 conductors, observed from conducting the acceleratedlifetestandtherearenotcensoredobservations inthesetofitemsobtainedfromLawless[27].
International Research Journal of Engineering and Technology (IRJET) e ISSN: 2395 0056 Volume: 09 Issue: 03 | Mar 2022 www.irjet.net p ISSN: 2395 0072 © 2022, IRJET | Impact Factor value: 7.529 | ISO 9001:2008 Certified Journal | Page1429
parameters and .Let nyyyy ,,,...,123 betheobserved


n i iiy n i i ie yy y Lnn 1 2 1 2 2 2 log11 2 log321
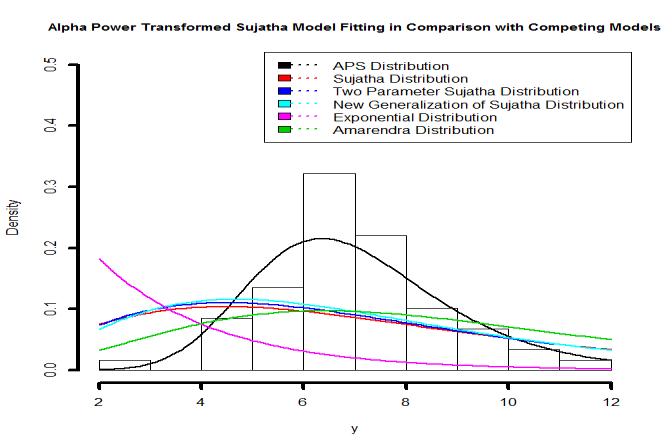
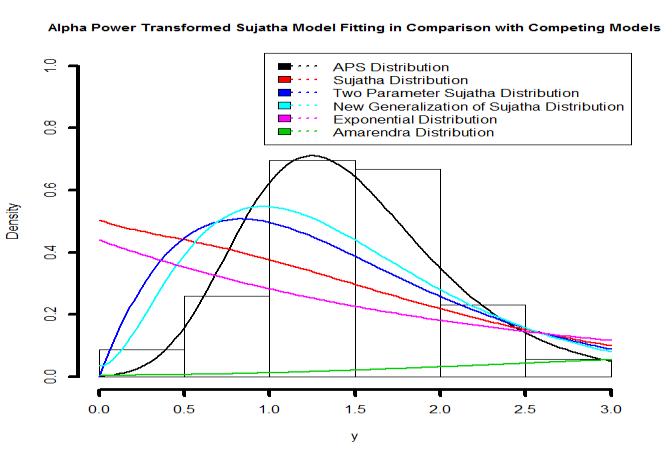
Inthissection,thetworealdatasetsarepresentedandused to examine the flexibility of Alpha Power Transformed Sujatha(APS)distributionandhasbeencomparedwiththe Two parameter Sujatha distribution, A new generalized Sujatha (ANGS) distribution, exponential, Amarendra distribution and Sujatha distribution. The goodness of fit statistic is used to know the better model for the fit. The modelwithlowest and considersthebest modelforthesaiddata.
n i iiy e yy Lnn 1 2 2 2 11 1 log1 log
9. APPLICATIONS
of
consideredasaconsistentestimatorthatisasymptotically efficient under broad conditions. It was observed to be inefficient in the situation of a mixture of continuous distributions, J shaped distributions and heavy tailed distributions(Pitman,[21],Renneby,[22],Cheng,[23])
APS
n i iiy n i i n i ii ie yy yyy Ln 1 2 11 2 2 2 2 log1log11 loglogloglog13loglog2 (29)
distribution,then
Thelog likelihoodfunctionisobtainedas
Swain et al. [24] introduced the ordinary least square estimators and weighted least square estimators for the parameterestimationinabetadistribution.Theleast square estimators of the distribution with unknown parameterscanbeobtainedbyminimizing(A). (A)
Itisquitedifficulttosolvesystemofnon linearequations algebraically because of the intricate form of likelihood equations,(30)and(31).Theparameterscanbeestimated usingNewtonRaphsoninRStatisticalsoftware[25].
The MLE’s of can be obtained by differentiating the equation(29)withrespecttotheestimators and toget theresultingnormalequations. (30) (31)
To compare the distributions, we use criteria like (Akaike Information Criterion), (Corrected Akaike Information Criterion) and (Bayesian Information
In this study, a new two parameter distribution has been developedbyusingtheAPTtechniquesuggestedbyMahdavi and Kundu. The technique adds a shape parameter to the existing model so that it becomes more flexible in data fitting.TheproposeddistributioniscalledtheAlphaPower Transformed Sujatha distribution. Various structural properties of the distribution have been obtained such as moments,reliabilityfunction,hazardfunction,meanresidual time, mean waiting time, order statistics, renyi entropy, Tsallis entropy, Bonferroni and Lorenz curves. The parametersofthedistributionareinvestigatedbyusingthe methodofmaximumlikelihoodtechnique.Theapplicability of the new distribution has been demonstrated with two suitable real life data sets over one and two parameter distribution.Ithasbeenobservedfromcomparativetable3 that Alpha Power Transformed Sujatha distribution outperforms the other competing distributions for considereddatasetsintermsof , , and
5.640
Table 2:DataSetII
5: Graphicaldataset1and2fittedbyproposedmodel andrelatedmodels
6.522 6.538 6.545
where,‘ ’isthenumberofestimatedparameters,‘ ’isthe samplesizeand isthemaximizedvalueofthelog likelihoodfunctionandareshownintable1.


2.997 4.137 4.288 4.531 4.700 4.706 5.009 5.381 5.434 5.807 5.589 5.459 6.033 6.071 6.087 6.129 6.352 6.369 6.492 6.515 6.573 6.725 6.869 6.923 6.948 6.956 7.398 7.459 7.489 7.495 7.496 7.543
6.958 7.024 7.224 7.365
International Research Journal of Engineering and Technology (IRJET) e ISSN: 2395 0056 Volume: 09 Issue: 03 | Mar 2022 www.irjet.net p ISSN: 2395 0072 © 2022, IRJET | Impact Factor value: 7.529 | ISO 9001:2008 Certified Journal | Page1430 Criterion).Thebestdistributionwouldbedeterminedbylog valueand and values. AICsL 22log , BICsnL log()2log , 1 2(1) ns AICcAICss
Sujatha distribution, a new generalized Sujatha (ANGSD) distribution, exponential distribution, amarendra distribution and Sujatha distribution. As a result, we conclude that the Alpha power transformed Sujatha distribution(APS)fitsbettertheconsidereddata thanthe otherdistributions
log likelihoodfittedcriteria.
0.977 1.006 1.021 1.027 1.055 1.063 1.098 1.140 1.179 1.224 1.253 1.270 1.272 1.274 1.301 1.301 1.359 1.478 1.490 1.511 1.382 1.382 1.426 1.434 1.435 1.535 1.554 1.566 1.570 1.586 1.633 1.642 1.648 1.684 1.697 1.726 1.770 1.773 1.800 1.809 1.821 1.848 1.880 1.954 2.012 2.067 2.084 2.090 2.128 2.096 2.233 2.433 2.585 2.585 0.966 1.240 1.514 1.629 1.818
10. CONCLUSION
Table-1:DataSetI
From table 3, the APS distribution has lower values as compared Two parameter
0.031 0.314 0.479 0.5520 0.700 0.803 0.861 0.865 0.944 0.958
Fig
[5]R. Shanker, K. K. Shukla and Tekie Asehun Leonida, “A New Two parameter Poisson Sujatha Distribution” , InternationalJournalofProbabilityandStatistics,9(2), 2020, pp.21 32.
[2]T. Mussie and R. Shanker, “A Two Parameter Sujatha Distribution” ,Biometrics & Biostatistics International Journal,7(3),2018,pp.188 197.
SujathaParameterTwo 1.7499 0.0010 147.2565 151.7247 147.6257 143.2277
[1]R. Shanker, “Sujatha Distribution and its Applications”, StatisticsinTransitionNewSeries,17(3),2017,pp.391 410.
Exponential 0.1433 349.2809 351.3585 349.3511 347.2809
ANGS 0.4297 6.1395 286.7689 290.9240 287.2052 282.7689
[8]K. K. Shukla and R. Shanker, “A New Quasi Sujatha Distribution”,StatisticsinTransitionnewseries,21(3), 2020,pp.53 71.
SujathaParameterTwo 0.4056 0.0010 292.5018 296.6569 292.9382 288.4718
[4]R.Shanker,K.K.ShuklaandF.Hagos,“AGeneralizationof SujathaDistributionanditsApplicationstoReallifetime data” , Journal of Institute of Science and Technology, 22(1),2017,pp.77 94.
7.683 7.937 7.945 7.974 8.120 8.336 8.532 8.591 8.687 8.799 9.218 9.254 9.289 9.663 10.092 10.491 11.038
[12] M. Maryam and R. Kannan, “A New Generalization of RamaDistributionwithApplicationtoMachineryData,” International Journal of Emerging Technologies in EngineeringResearch,9(9),2021,pp.1 13.
APS 2.7259 5.2008 115.4806 119.9489 115.8499 111.4519
[6]T.MussieandR.Shanker,“ANew TwoParameterSujatha DistributionwithPropertiesandApplications” ,Turkiye KlinikleriJournalofBiostatistics,10(2),2018,pp.96 113.
[13] M.Maryamand R.Kannan, “OntheAlpha powerQuasi Aradhana Distribution: properties and applications” , AppliedMathematicsandInformationSciencesLetters, 16(2),2022,pp.197 211.
2
Amarendra 0.5332 278.3213 280.3988 278.3915 276.3213
[7]R.Shanker,AnotherTwo ParameterSujathaDistribution with Properties and Applications, Journal of MathematicalSciencesandModelling,2(1),2019,pp.1 13.
REFERENCES
APS 0.8282 7.3327 232.1189 236.2740 232.5552 228.1189
Data Model ML Estimates AIC BIC AICc 2lnL
ANGS 2.0428 114.5234 135.6919 140.1601 136.0611 131.6631
Amarendra 1.7646 167.0082 169.2423 167.0670 165.0082
[10] M. Maryam and R. Kannan, “A New Generalization of GarimaDistributionwithApplicationtoRealLifedata” , AppliedMathematicsandInformationSciencesLetters, 15(5),2021,pp.577 592.
[9]A.MahdaviandD.Kundu,“ANewMethodforGenerating Distributions with an Application to Exponential Distribution”, Communication in Statistics Theory Methods,46(13),2017,pp.6543 6557.
[11] M.MaryamandR.Kannan,“AlphaPowerTransformed Aradhana Distribution,itsPropertiesandApplication” , IndianJournalofScienceandTechnology,14(30),2021, pp.2483 2493.
Sujatha 1.3907 170.0589 172.2931 170.4282 168.0446
Sujatha 0.3906 295.5905 297.6680 296.0268 293.5905
1
International Research Journal of Engineering and Technology (IRJET) e ISSN: 2395 0056 Volume: 09 Issue: 03 | Mar 2022 www.irjet.net p ISSN: 2395 0072 © 2022, IRJET | Impact Factor value: 7.529 | ISO 9001:2008 Certified Journal | Page1431 Table 3:Summaryoffitteddistributionsfordataset1and2
[3]R. Shanker,K. K. Shukla and F. Hagos, “Size Biased Poisson Sujatha Distribution with its Applications” , American Journal of Mathematics and Statistics, 6(4), 2016,pp.145 154.
Exponential 0.6911 190.9872 193.2213 191.0460 188.9872
[20] M.O.Lorenz,“MethodsofMeasuringtheConcentrationof Wealth”, Journal of American Statistical Association, 9, 1905,pp.209 219.
[18] G.M.Giorgi,andR. Mondani,“SamplingDistributionof the Bonferroni inequality index from Exponential Population”,Sankhya,TheIndianJournalofStatistics,57, SeriesB,1995,pp.10 18.
[22] B. Renneby, “The Maximum Spacing Method. An EstimationMethodRelatedtotheMaximumLikelihood Method”,ScandinavianJournalofStatistics,1984,pp.93 11.
[26] M.G.BadarandA.MPriest,“StatisticalAspectsofFibre andBundleStrengthinHybrid Composites”, Progress in Science and Engineering Composites, Hayashi, T., Kawata, K. and Umekawa, S. (eds.), ICCM IV, Tokyo, 1982,pp.1129 1136.
[21] E. J. G. Pitman, “Some Basic Theory for Statistical Inference”,Chapman&Hall,1979.
[27] J.F.Lawless,“StatisticalModelandMethodsforLifetime data”,WileySeriesinProbabilityandStatistics,2003.
[28] R. A. Fisher, “On the mathematical foundations of theoreticalstatistics”,PhilosophicalTransactionsofthe Royal SocietyofLondon,222,SeriesA,1920, pp.309 368.
[23] R.C.H.ChengandN.A.K.Amin,“EstimatingParameters in Continuous univariate Distributions with a Shifted Origin”,JournaloftheRoyalStatisticalSociety,1983,pp. 394 403.
[14] R. Clausius, “On Different forms of the Fundamental Equations of the Mechanical Theory of Heat and their ConvenienceforApplication”,ProceedingsoftheZurichet naturforschendeGesellschaft,April,1865
[25] R Core Team, R. version 3.6.1, “A Language and EnvironmentforStatisticalComputing”,RFoundationfor StatisticalComputing,Vienna,Austria,2019.
International Research Journal of Engineering and Technology (IRJET) e ISSN: 2395 0056 Volume: 09 Issue: 03 | Mar 2022 www.irjet.net p ISSN: 2395 0072 © 2022, IRJET | Impact Factor value: 7.529 | ISO 9001:2008 Certified Journal | Page1432
[16] A. Rényi, “On Measures of Entropy and Information, ProceedingsoffourthBerkeleySymposiumMathematics StatisticsandProbability”,UniversityofCaliforniaPress, Berkeley,1961,pp.547 561.
[24] J. Swain, S. Venkatraman, and J. Wilson, “Least Square Estimation of Distribution Function in Johnson’s TranslationSystem”,JournalStatisticalComputationand Simulation,29,1988,pp.271 297.
[15] C. E. Shannon, “A Mathematical Theory of Communication”,BellSystemTechnicalJournal,27,1948, pp.379 423.
[19] E. Bonferroni, “Elmenti di statistic a generale, Libreria Seber”,Firen,1930.
[17] C. Tsallis, “Possible Generalization of Boltzmann Gibbs Statistics,” Journal of Statistical Physics, 52, 1988, pp. 479 487.