Analysis and Reduction of Production Waste in the Process of Production of Fruit Beverages in Beverage Industries using Value Stream Mapping and Pareto Principle
1Assistant Professor, Department of Industrial Engineering and management, Dr. Ambedkar Institute of Technology, Mallathhalli, Bangalore, Karnataka, India.
2,3,4Student, Department of Industrial Engineering and Management, Dr. Ambedkar Institute of Technology, Mallathhalli, Bangalore, Karnataka, India
© 2022, IRJET | Impact Factor value: 7.529 | ISO 9001:2008 Certified Journal | Page797

Setting up an objective and implementing a thought to visualize using value stream symbols. There are many symbols for each and every process flow, material flow, transportation,inventoryetc.….,
Volume: 09 Issue: 03 | Mar 2022 www.irjet.net
p ISSN: 2395 0072
International Research Journal of Engineering and Technology (IRJET) e ISSN: 2395 0056
Key Words: Waste reduction, Beverages, Quality, Value Stream Mapping (VSM), Pareto Principle, Production
Chetan N1, Harish D2, Nuthan Raj B M3 , Nikhileshwari B K4
Abstract The project entitled as “analysis of wastes and reduction of the same in the process of production of fruit beverages using value stream mapping and Pareto principle was carried out at KTR beverage Industry, Bengaluru. Leading manufacturers of Fruit Beverages.
TheParetoprinciple,statesthat80%ofwastecomesfrom 20%ofthecausesorreasons.Inotherwords,mostofthe activitieshavenoorlittleeffect.Italsomeansthat80%of theindustrialoutputisproducedby20%ofthelabors.The Paretoanalysisisthattechnique,whereaplentyofpossible
Value Stream mapping steps
Step 1:Creatingthepresentstatemap
Value Stream Mapping (VSM)
Avaluestreammap(VSM)isaflowchartthatillustratesand analyzes the steps involved in producing a product or deliveringaservice.Oncesomeonemapsthiscurrentstate oftheprocessfromstarttoend,heorsheshouldfindareas that don’t add value to the process methods and reduce those areas. Value stream mapping started with Lean methodologybecauseitisastrongwaytovisualizethekey objectivesofLeanmethodology:tocontrolandmonitorand to manage all waste, including overproduction, defective parts, and transportation of individual or group of people andproducts.
Step 2: Draw the flow of information and products, materials, people in the second step, we add information abouthowmaterials,peopleandproductinformationflow throughthevaluestream.Visualizingwherethematerials arestored.Informationaboutshipmentisadditionaltothe process
coursesofeventsarecompetingforaction.Ithelpstospot the highest portion of causes that has to be addressed to propersolutiontomajorityoftheproblems
Step 3:Addprocessdata
When adding process data, it’s important to acknowledge what’susefulforthegivensituationandpurpose.Insome cases,theaimmightnotbeentirelyclearbeforetheanalysis iscompleted,whichresultsinadditionofalltheknowndata about the process or method. The list below gives an overviewofprocessdataandabbreviationswillbeofusefor aVSM.
Production control has been extensively distributed usingValuesStreamMapping(VSM)andstatisticalanalysis inseveralmanufacturingoutfitsinrecenttime.Thesehelped togaugeandimprovetheproceduresrequiredtoeffectively deliverproductsorserviceswithminimalitchesandwastes. TheVSMmaybeapotentmethodforexposingthesection where waste is predominant in any process, not just production.Thestep by stepanalysisofproductionstages using the Value Stream Mapping provides an outcome of whether any stage is value added or not. Value Stream Mappingispreferredtoothermethodsbecauseitshowsthe flowsfromthepositionofdemandstothetopofallactivities afterproductsandservicesmustbemadeavailable.
INTRODUCTIONWastes
The organization aims to achieve excellence in manufacturing by continuous maintenance of their best quality and to be cost competitive in the market but unable to meet these objectives due to the presence of some wastes in their production unit. Hence, one of the lean quality tool Value Stream Mapping (VSM) and Pareto principle is introduced in order to identify and analyze in detail about wastes produced and reduction techniques are suggested.
The overall objective of the project was to study the waste produced in the production unit that to in processing and distribution units. In order to improve and increase the production and for betterment for the industry.
***
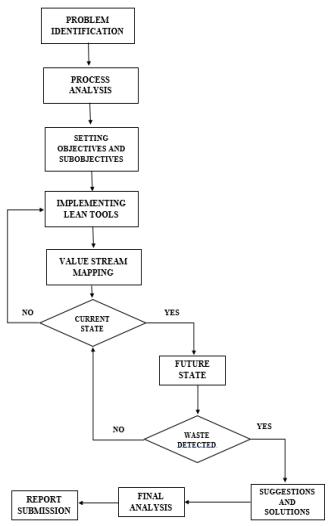
• The uptime of filtering, mixing, filling, labeling, and packaging was observed 72%, 65%, 76%, 62%, and 68%respectively.Thedailydemandis6000bottles.
In this final step, we want to calculate the takt time, the processtimesandwaitingtimes(inventoryleadtimes)and addthesetoVSM.Thesearegoingtobeusefulforestimating the total lead or interval time, process time and process
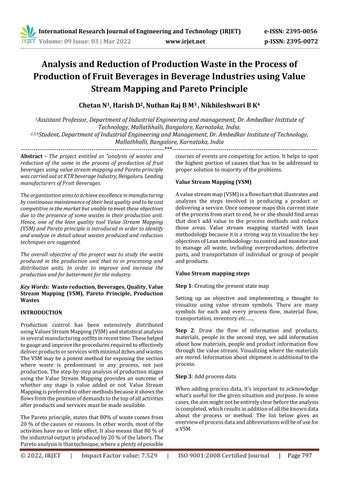
Step 7:IfwastesareidentifiedimplementParetoprinciple toanalyzetheCausesoftheWastesproduced.
III. Data collection and Data Analysis
• From the present VSM, total Value Adding & Non Value Addingtimewereobservedrespectively5429secand35716 secfromthebottomlineoffigure1
Step 2: The outsight process is analyzed for defined problem.
•The lead timeis the time interval between theinitiation andthecompletionofaproductionprocess.
I. Objectives :
Step 4:Addtimelineandcalculations
Step 1:Theinputrequirementsareidentifiedinproduction anddistributionunitinKTRbeverages.Problemisdefined foreasyandclearunderstanding.
Step 5:Currentstatemappingisdonewheresortingofvalue added(VA),non valueadded(NVA),varioustypes oftime dataaremapped.
b) In house leakages:Disposablenon hazardousdomestic wastesincludingrawmaterials,defectivetetrapacks,bottles etc.…,
© 2022, IRJET | Impact Factor value: 7.529 | ISO 9001:2008 Certified Journal | Page798
Step 4:Analyzingandselectingbestfitleanmanufacturing toolsaredoneinthisstep.Valuestreammappingwasbest fittingtool.
II. Methodology Block Diagram
Theefficiencywastes
c) Production or assembly line wastes:Thebottleswhich areoverfilled,underfilled,missingcrownandbreakages
p ISSN: 2395 0072
•Thein processinventorywasobservedbetweeneachtwo processing stages, which could be reduced using lean manufacturingtools
International Research Journal of Engineering and Technology (IRJET) e ISSN: 2395 0056
Step 3:Objectivesandsubobjectivesaresetinthisstage.
ToAnalyzetheWastesandReducethembyconsideringthe production or assembly line and distribution unit of fruit beverages in KTR Beverages Industry Using Value Stream MappingandParetoPrinciple.
a) Transit leakages: The waste produced during transportationorcarryingtheproductorrawmaterialsfrom oneplacetodifferentplaces.
•TheVSMwasusedtoevaluatethevalueadded(VA)and non valueadded(NVA)timeofbeverageindustry.
Volume: 09 Issue: 03 | Mar 2022 www.irjet.net
Step 6: Future state mapping is drawn, all wastes are identified,checkforimprovementsfromcurrentstate.
identifiedwithintheindustryinclude:
Step 8:Suggestionsandsolutionsareimplemented,afinal analysisiscarriedout,andstudyreportisprepared.
a. The Current State Value Stream Map
Theprojectmethodologyisasfollows:
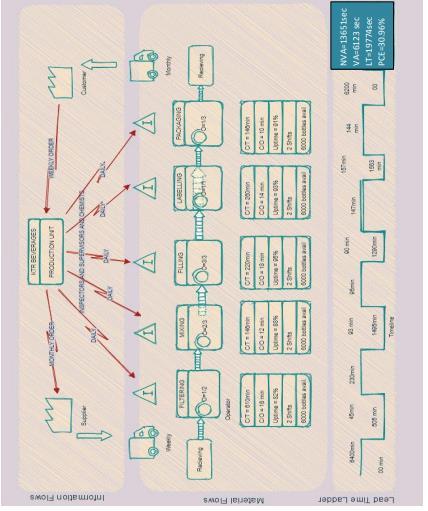
Fig1.ShowspresentStateVSM.
• Lead time= Value Added time (VA) + Non Value Added time (NVA)
• Non-Value-Added time =13651sec=227.516min
b. Future State Value Stream Map
• Lead time= Value Added time (VA) + Non Value Added time(NVA)
=15.817sec/Bottle= 0.3843 min/Bottle
Present Process Cycle Efficiency
✓ theleadtimewasobservedas19774sec
• Value Added time=5429sec=87.65min
Figure 1: PresentvalueStreammapping
✓ Net available time per day = Two shift time (Total changeovertime+Lunchtime)=71652sec 5400sec = 66252sec=1104.2min
Volume: 09 Issue: 03 | Mar 2022 www.irjet.net
Takt Time Calculation Present State VSM
✓ Lunchtime=30minutes=1800sec
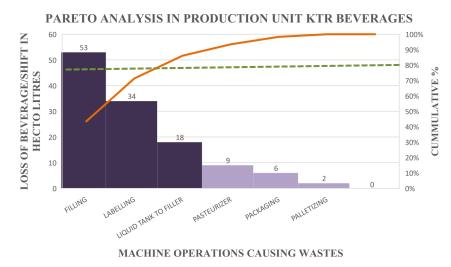
✓ TheVA&NVAtimewereobservedrespectively6123sec and13651secfromthebottomlineoffigure2.
International Research Journal of Engineering and Technology (IRJET) e ISSN: 2395 0056
Takt time =machineavailabletime/therequirednumberof units=66252/6000
p ISSN: 2395 0072
Process cycle efficiency =Valueaddedtime/leadtime*100 =12.1806%
© 2022, IRJET | Impact Factor value: 7.529 | ISO 9001:2008 Certified Journal | Page799
Takt time is the average time allowed to produce unit production of product to meet customer demand, and the processingtimeshouldbelessthanorequaltothetaketime.
✓ Twoshifttime=19hoursand5minutes=1194.2min= 71652sec
✓ Workingshiftperday=2shifts
✓ the uptime of filtering, mixing, filling, labeling, and packaging was observed 82%, 88%, 95%, 93%, and 91%respectively.
Atpresent,VSM,inthereducedNVAtimeandVAtime,were observed;therefore,
✓ Totalchangeovertime=1hour=60min=3600sec
✓ Dailysaleabledemand=6000bottles
✓ One shift time = 9 hours and 7 minutes = 597.1 min = 35826sec
Lead time =5439sec+35826sec=41265sec=687.75min= 11hours46min25sec
✓ InfutureVSM,asshowninFig2FutureStateVSM,itis observedthatNVAtimeandthetotalnumberoflaborsare reduced, VA and uptime is increased, and an in process inventorydelaytimeisalsoreduced.
Future Process Cycle Efficiency
• Value Added time=6123sec=102.05min
• Non Value Added time =35716sec=597.1min
Atpresent,VSM,inthereducedNVAtimeandVAtime,were observed;therefore,ProcessCycleefficiencywascalculated.
✓ Workingshiftperday=2shifts
Process cycle efficiency =Valueaddedtime/leadtime*100 =102.05/329.567
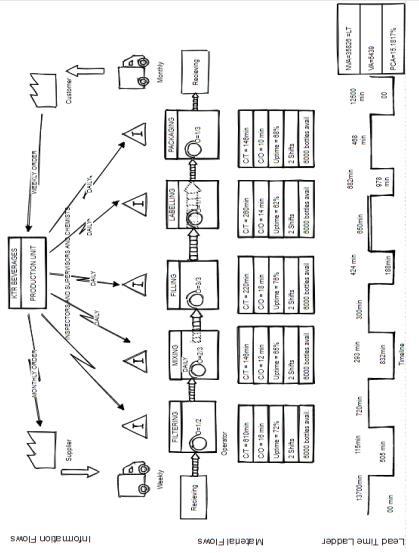
✓The result is filler/crowner contributes a cumulative percentage cutoff of 53 defects. Labelling contributes 34 defects,andLiquidtanktofillercontributes18defects.The firstthreefactorscause86.06%oftotaldefects.
Lead time =6123sec+13651sec=19774sec=329.567min =5hours49min27sec
✓ Dailysaleabledemand=6000bottles
3 ToFiller 18 86.06%
International Research Journal of Engineering and Technology (IRJET)
✓ Twoshifttime=10hoursand8minutes=659.13min= 39548sec
Takt Time Calculation Future State VSM
4 Pasteurizer 09 93.44%
c. Pareto Analysis on Production Unit Where production wastes are produced.
2 Labelling 34 71.31%
Figure 2 FuturestateMapping
5 Packaging 06 98.36%
✓with the use of Pareto, scarce resources are efficiently allocated.
Figure 3: ParetoAnalysisinProductionunit
✓ Oneshifttime=5hoursand4minutes=329.56min= 19774sec
p ISSN: 2395 0072
e ISSN: 2395 0056
✓ HereFig3Paretochartdisplaysmachineparameterslike filler/ crowner, liquid tank pasteurizer, packer, and palletizeragainstmachineoperations.
✓theprincipledictatesthat80%ofthefailuresarecoming from20%ofthecauses.Itisimportanttonotethatthistool whollybasesrecommendedactionsonpresentdata.Itdoes not consider probable increase or decrease and projected movementsofanyonecontributingfactor.
6 Palletizing 02 100%
ParetoData
Process cycle efficiency = 25.16%
✓ Totalchangeovertime=1hour=60min=3600sec ✓ Lunchtime=30minutes=1800sec
© 2022, IRJET | Impact Factor value: 7.529 | ISO 9001:2008 Certified Journal | Page800
1 Filling 53 43.44%
ProcessCycleefficiencywascalculated.
SlNo. Causes Defects Cum%
Takt time =machineavailabletime/therequirednumberof units=3418/6000=6.82sec/Bottle= 0.213 min/Bottle
✓Tofurtherillustrate,theParetocharthasbeendesignedto representthevitalfew(onewhichareindarkcolorinfigure 3)againstthetrivialmany(lightcolorgraphsinfigure3). Withthechart'shelp,itiseasytoidentifythecausesofmost oftheproblems.
✓ Pasteurizer,packer,andpalletizercontribute9,6and2 defects, these 3 factors contribute 13.94% of total cumulativedefects.
Table 1: InputsToParetochart
Volume: 09 Issue: 03 | Mar 2022 www.irjet.net
✓ Net available time per day = Two shift time (Total changeovertime+Lunchtime)=39548sec 5400sec = 3418sec=56.96min
1.VSMandParetoprincipalpracticesofleanmanufacturing applications are utilized for removing the waste from the beverageindustry.
2. Pareto analysis can be used to identify key areas in the process that could benefit from a focus improvement initiative,therebybenefitingtheoverallindustry.
5. Understanding various symbols used in value stream mapping
V. Conclusions:
© 2022, IRJET | Impact Factor
3.Recommendedsolutionswereidentifiedandimplemented to reduce the wastes of these critical process inputs. It is crucialtoensurethattheworkerscomplywiththestandard operatingproceduresforwastetobereduced.
[4] Serrano I, Ochoa C, de Castro R, "Evaluation of value streammappinginmanufacturingsystemredesign."IntJ ProdRes,4409 4430,2008.
4. Pareto chart analysis, understanding 80:20 rule and applyingthesame.
[5] Sahoo AK, Singh NK, Shankar R, Tiwari MK, "Lean philosophy:implementationinaforgingcompany,"IntJ AdvManufTechnol,451 462,2008.
VI. Key Learnings
[3] Shingo, S. "Study of Toyota Production System from IndustrialEngineeringViewpoint,"JapanManagement Association,Tokyo.(1981).
p ISSN: 2395 0072 value:
IV. Results:
[2] WomackJP,JonesDT,"Leanthinking:banishwasteand createwealthforyourcorporation,"Simon&Schuster, NewYork,1996.
2.maps.Analyzing various parameters considered for value
REFERENCES
[1] Role of Lean Manufacturing Tools in Soft Drink Company,ShaikdawoodAK,ElsayedAElsayed,Abdul Rahaman,Rkarthikeyan.
Volume: 09 Issue: 03 | Mar 2022 www.irjet.net
7.529 | ISO 9001:2008 Certified Journal | Page801
International Research Journal of Engineering and Technology (IRJET) e ISSN: 2395 0056
Afterimplementationofqualitytoolsandtechniquesitseen fromcurrentstateleadtimewas693.75minto329.567in futurestatemap.Itisnoticedthat0.17minreductionfrom presentandfuturemapping.Theefficiencyisincreasedfrom 12.1806%to25.16%.
3.stream.DocumentnumberingforeasyAccess.
1.ValueStreammappingplottingcurrentandfuturestate