Support Vector Machine Optimal Kernel Selection
Volume: 09 Issue: 03 | Mar 2022 www.irjet.net p-ISSN: 2395-0072
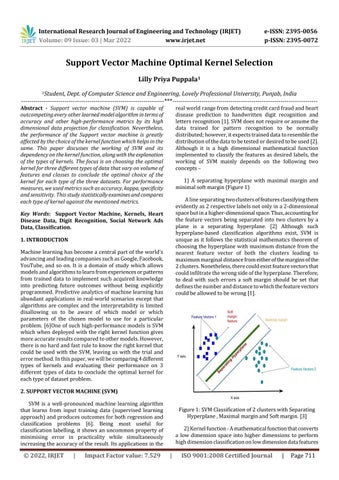
Figure1:SVMClassificationof2clusterswithSeparating Hyperplane,MaximalmarginandSoftmargin.[3]
2)Kernelfunction Amathematicalfunctionthatconverts a low dimension space into higher dimensions to perform highdimensionclassificationonlowdimensiondatafeatures
Abstract Support vector machine (SVM) is capable of outcompeting every other learned model algorithm interms of accuracy and other high performance metrics by its high dimensional data projection for classification. Nevertheless, the performance of the Support vector machine is greatly affected by the choice of the kernel function which helps in the same. This paper discusses the working of SVM and its dependency on the kernel function, alongwith the explanation of the types of kernels. The focus is on choosing the optimal kernel for three different types of data that vary on volume of features and classes to conclude the optimal choice of the kernel for each type of the three datasets. For performance measures, we used metrics such as accuracy, kappa, specificity and sensitivity. This study statistically examines andcompares each type of kernel against the mentioned metrics.
1. INTRODUCTION
realworldrangefromdetectingcreditcardfraudandheart disease prediction to handwritten digit recognition and lettersrecognition[1].SVMdoesnotrequireorassumethe data trained for pattern recognition to be normally distributed;however,itexpectstraineddatatoresemblethe distributionofthedatatobetestedordesiredtobeused[2] Although it is a high dimensional mathematical function implemented to classify the features as desired labels, the working of SVM mainly depends on the following two concepts1)Aseparating
International Research Journal of Engineering and Technology (IRJET) e ISSN: 2395 0056
Alineseparatingtwoclustersoffeaturesclassifyingthem evidentlyas2respectivelabelsnotonlyina2 dimensional spacebutinahigher dimensionalspace.Thus,accountingfor the feature vectors being separated into two clusters by a plane is a separating hyperplane. [2] Although such hyperplane based classification algorithms exist, SVM is uniqueasitfollowsthestatisticalmathematicstheoremof choosingthehyperplanewithmaximumdistancefromthe nearest feature vector of both the clusters leading to maximummarginaldistancefromeitherofthemarginsofthe 2clusters.Nonetheless,therecouldexistfeaturevectorsthat couldinfiltratethewrongsideofthehyperplane.Therefore, to deal with such errors a soft margin should be set that definesthenumberanddistancetowhichthefeaturevectors couldbeallowedtobewrong[1]
© 2022, IRJET | Impact Factor value: 7.529 | ISO 9001:2008 Certified Journal | Page711

1Student, Dept. of Computer Science and Engineering, Lovely Professional University, Punjab, India ***
Lilly Priya Puppala1
Machinelearninghasbecomeacentralpartoftheworld’s advancingandleadingcompaniessuchasGoogle,Facebook, YouTube, and so on. It is a domain of study which allows modelsandalgorithmstolearnfromexperiencesorpatterns from trained data to implement such acquired knowledge into predicting future outcomes without being explicitly programmed.Predictiveanalyticsofmachinelearninghas abundant applications in real world scenarios except that algorithms are complex and the interpretability is limited disallowing us to be aware of which model or which parameters of the chosen model to use for a particular problem. [6]Oneof suchhigh performance modelsisSVM whichwhendeployedwith therightkernel functiongives moreaccurateresultscomparedtoothermodels.However, thereisnohardandfastruletoknowtherightkernelthat could be used with the SVM, leaving us with the trial and errormethod.Inthispaper,wewillbecomparing4different types of kernels and evaluating their performance on 3 different types of data to conclude the optimal kernel for eachtypeofdatasetproblem.
2. SUPPORT VECTOR MACHINE (SVM)
hyperplane with maximal margin and minimalsoftmargin(Figure1)
SVM is a well pronounced machine learning algorithm that learns from input training data (supervised learning approach)andproducesoutcomesforbothregressionand classification problems [6]. Being most useful for classificationlabelling,itshowsan uncommon propertyof minimising error in practicality while simultaneously increasingtheaccuracyoftheresult.Itsapplicationsinthe
Key Words: Support Vector Machine, Kernels, Heart Disease Data, Digit Recognition, Social Network Ads Data, Classification.
Formula:F(X,XJ)=(X.XJ+1)^d
Volume: 09 Issue: 03 | Mar 2022 www.irjet.net
Figure3:Case2[2]
International Research Journal of Engineering and Technology (IRJET) e ISSN: 2395 0056
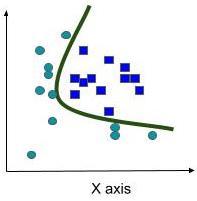
Figure4:Case3[2]
Unfortunately,pastresearchdictatesthattheoptimalwayto choosetherightkernelfunctionisatrialanderrormethodas eachdatawoulddifferindistribution,featuresanddesired classification. However, this process is time consuming. Therefore,wearediscussingeachtypeofkernelfunctionand their application to respective cases for better interpretabilityofwhichkernelfunctiontodeploytoourSVM model[1]
p-ISSN: 2395-0072
Formula:F(X,XJ)=SUM(X.XJ)
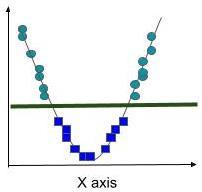
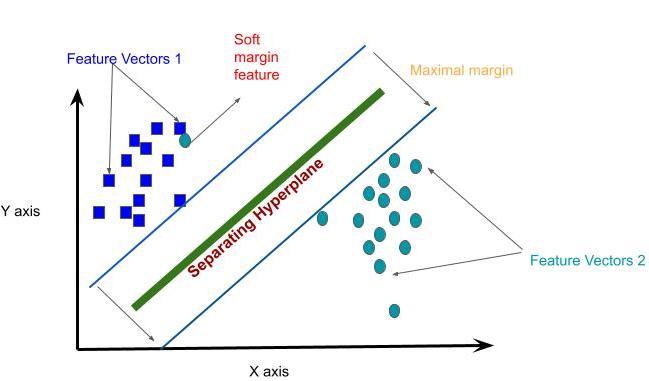
Figure2:Case1[2]
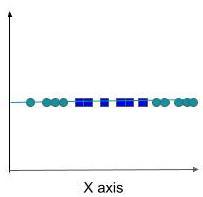
isakernelfunction.Thisisimportantincasesinwhichthe dataisinseparablewithonelabelledgroupbeingnearzero, while the other has large absolute values, making it impossibleforasinglepointtoseparatethe2labels.Insuch cases, a soft margin would be exponentially large. The essence, working and types of kernel functions will be discussedfurtherindetailbelow.
Asdiscussedearlier,thekernelfunctionhelpstolinearly separate unambiguous data by changing it into high dimensional space. To know the essence of using kernel functions, let’s see the following cases. (Figure 2) Here, features are dispersed in a way that a straight line (hyperplaneintermsofSVM)cannotbeusedtoseparatethe 2groups.However,employingakernelfunctionthatsquares the features’ values change the space from 2 dimensional into 4 dimensional space, thus allowing linear separation using a hyperplane (Figure 3). [2] As we cannot draw featuresin4dimensions,weprojectthehyperplanebackin 2dimensions,thusmakingitacurvedline(Figure4).Based onthenecessityandtypechosen,respectivemathematical functions would be applied to the data space. The most commonissueiswhenandwhichkernelfunctiontoemploy to our SVM model as projecting low dimension to high dimensional data spacewouldalsoexponentiallyincrease thepossiblesolutions.Therebymakingitdifficultandslow forthealgorithmtogeneraliseandgiveanaccuratesolution. Thus,knowingwhichtypeofkernelfunctiontouseonwhich kindofdataisimportantasitiscrucialtoclassifyourdata withoutintroducingirrelevantdimensions.
2.1 Support Vector Machine Kernels
2.2 Types of Kernels
1.Linearkernel Aone dimensionalkernel, beingthemost simpleandcommonkernelismuchfastercomparedtoother kernelsandusesonlytheCparametertooptimise[1].
© 2022, IRJET | Impact Factor value: 7.529 | ISO 9001:2008 Certified Journal | Page712
3.GaussianRadialBasisFunction(RBF) Thisaddsaradial basismethodtoimprovethetransformation.Optimization parametergammahasbeenvoluntarilyaddedtothemodel
2. Polynomial kernel A decision boundary that separates given data by representing the similarity of vectors in the data in a feature space over polynomials of the original variables used in the kernel. It is a more generalized representationofthelinearkernelhoweveritisknowntobe lessefficientandaccurate[3]
International Research Journal of Engineering and Technology (IRJET) e ISSN: 2395 0056
Exercise inducedangina(exang):1=yes;0=no
Purchased whether the target audience has purchasedtheproductornot:0=notpurchased;1= purchased
Slope:PeakexerciseST segment:1=upsloping;2= flat;3=downsloping
1) Heart Disease Data Set The first dataset we use is Cleveland Heart Disease from the UCI Machine Learning Repository.Thisdatasetdescribesarangeofconditionsthat areusedtopredictifapersonissufferingfromheartdisease or not. This is categorical data with 2 classifications of presenceorabsence(1or0)ofheartdisease.Thisdataset consistsof303featurevectorsoutofwhich138absentcases and165arepresentcasesofheartdisease.Wewillbeusing 14featuresforeachfeaturevector.
Togiveabetterconclusiononwhichkerneltypetousefor whichdata,wewillbeusingthreedifferenttypesofdatasets to do three different kinds of analysis. Given is the data definitionandelaborativestructureofeachofthedatasets
Oldpeak:STdepressioninducedbyexerciserelative torest
2)DigitRecognitionDataset Theseconddatasetweusedis theHandwrittenDigitrecognitiondatasetfromKagglewhich containstwoCSVfilesoftrainandtestdata,eachofwhich contains grey scale images of hand written digits ranging from 0 to 9 as feature vectors. This prediction is a classification problem of many features and vectors (in comparison to the other 2 datasets we are using) with its resultbeingclassifiedintooneofthenumbersfrom0to9. WewillbeusingonlythetrainCSVfilewhichcontains42,000 featurevectorseachhaving785featureattributes.
Volume: 09 Issue: 03 | Mar 2022 www.irjet.net
Resting ECG (restecg): displays resting electrocardiographicresults:0=normal;1=having ST T wave abnormality;2 = left ventricular hypertrophy
The14featuresusedare
Age theageofthetargetaudience range(18to 60)
3)SocialMediaAdsDataset Thethirdandfinaldatasetwe willbeusingisSocialMediaAdsDatasetfromKagglewhich hasaproduct’ssocialmediaadvertisingcampaign.Here,we will be analysing the dependency of the purchase of the productoverasmallsetoffeaturesandclassifywhetherthe product is purchased or not by prediction. This dataset consistsof400featurevectorswith257notpurchasedand 143purchasedentriesand5featureattributes,outofwhich wewillbeusingonly3featureattributes.
alpha=slope
EstimatedSalary theestimatedsalaryofthetarget audience range(15000to150000)
© 2022, IRJET | Impact Factor value: 7.529 | ISO 9001:2008 Certified Journal | Page713
The3featureattributesare
4. Sigmoid kernel this is equivalent to a two layer, perceptronmodeloftheneuralnetwork,whichisusedasan activation function for artificial neurons. Also known as Multi layerPerceptronKernelorHyperbolicTangentKernel asgamma,randdareadjustablekernelfunctionswhichare adjustedbasedonthedata[3].
Age:displaystheage
whichrangesfrom0to1.Furthermore,themostpreferred valueforgammais0.1[1]
gamma=optimizationparameter
Formula:F(X,XJ)=exp( gamma*||X XJ||^2)
Ca: Number of major vessels (0 3) colored by fluoroscopy
Thal:displaysthethalassemia
p-ISSN: 2395-0072
c=constant
Resting Blood Pressure (trestbps): displays the restingbloodpressure
Serum Cholesterol (chol): displays the serum cholesterol
Where,X,XJ= thedatawearetryingtoclassify. d=adjustablepower
Sex:displaysthegender:1=male;0=female
presentsufferingDiagnosisofheartdisease(target):Displayswhetherfromheartdiseaseornot:0=absence;1=
Eachofthe785featureattributesisapixeloftheimageinthe dataset (28 height x 28 widths) displaying a pixel value indicatingthedegreeoflightnessordarkness(0to255)of thatpixel.
Formula:F(X,XJ)=tanh(X*alpha*XJ+c)
3.Chest pain type (cp): displays the type of chest pain:1=typicalangina;2=atypicalangina;3=non anginalpain;4=asymptotic
3. DATA DEFINITION AND METHODOLOGY
FastingBloodSugar(fbs):fastingbloodsugarvalue 1= fbs>120mg/dl 0=fbs<120mg/dl
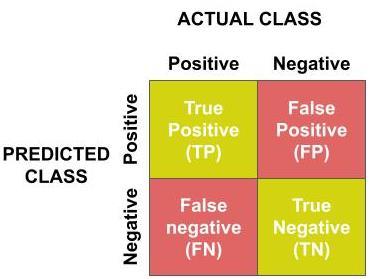
FN=FalseNegative Figure5:ConfusionMatrixforPerformanceEvaluation Table 1: KernelPerformanceofHeartDiseaseandSocial NetworkAdsDatasets[5] HeartDiseaseData SocialNetworkAdsData TypeKernel acyAccur vitySensiti citySpecifi paKap acyAccur vitySensiti citySpecifi paKap Linear 0.76 0.7059 90.804 330.51 0.8 0.8906 90.638 950.54 mialPolyno 30.733 0.5882 30.853 10.45 0.78 [1][1] 375[1][1]0.9 0.5 820.47 RBF 0.76 0.7647 10.756 820.51 0.9 0.9062 90.888 560.78 dSigmoi 0.76 0.6471 70.853 840.50 0.75 0.8281 10.611 740.44 Table 2: KernelPerformanceofDigitRecognition Dataset[5] DigitsRecognitionData Accuracy (mean)Sensitivity (mean)Specificity Kappa Linear 0.9351 0.9342 0.9928 0.9278 Polynomial 0.9746 0.9714 0.9971 0.9717 RBF 0.9797 0.9927 0.9991 0.9774 Sigmoid 0.8377 0.8356 0.9819 0.8196 4.
Afterevaluationofperformance(Table1)(Table2),the resultsofeachdatasetareasfollows Fortheheartdiseasedataset theaccuracyisthesamefor all the kernels used; however, the polynomial kernel has shown relatively low accuracy. Since specificity and
Volume: 09 Issue: 03 | Mar 2022 www.irjet.net
p-ISSN: 2395-0072
© 2022, IRJET | Impact Factor value: 7.529 | ISO 9001:2008 Certified Journal | Page714
International Research Journal of Engineering and Technology (IRJET) e ISSN: 2395 0056
Eachdatasetispreprocessedanddividedintoatrainingset andtestingsetrandomlyintheratio75:25,allowingtheSVM model to learn from the training set and form patterns to predictclassificationforthetestingset.Thetrainingdatais fedtotheSVMmodelwithallfeaturesusingthefunctionSVM of the e1071 package of R programming along with the particular kernel function to use as a parameter and the modelpredictionistestedagainsttheactualvaluesusingthe predictfunction.Themodelisimplementedforall4kernels withtheirrespectivekernelfunctionnamesandtheresults are compared with performance metrics [5] using the confusionMatrixfunction(Figure5).
3.1 METHODOLOGY
The3datasetsdifferwiththevolumeoffeaturesandtypeof classification;however,wewillbeimplementingtheanalysis usingthefollowingmethodologyforallthe3problems.
FPTN[the4)Specificitycompared(Showingnotthatand3Sensitivityaccuracypurchased)occurrencethatand2Accuracysimilapredictions.1ofTheperformancemetrics[4]showthefollowingperformancethemodelusingeachkernelfunction)AccuracytheratioofcorrectpredictionstototalThisismainlyusefulwhentheFNandFPhavercosts[4]=(TP+TN)/(TP+FP+FN+TN))SensitivityThisisalsoknownasthetruepositiverateisusedtomeasuretheproportionofpositivefeatureswerecorrectlyclassified.Thisisusedwhentheoffalsenegatives(Showingpurchasedwhennotisunacceptablecomparedtogettinglow[4].=TP/(TP+FN))SpecificityThisisalsoknownasthetruenegativerateisusedtomeasuretheproportionofnegativeexampleswerecorrectlyclassified.Thisisusedwhenonewantstoraisefalsealarmsbymaximizingthefalsepositivesthepresenceofheartdiseaseinsteadofabsent)toothermetrics[4].=TN/(TN+FP)KappastatisticThisadjustsaccuracybyaccountingforpossibilityofacorrectprediction.Itrangesfrom0to1[3]Pooragreement:<0.20Moderateagreement:0.20to0.80Perfectagreement:0.80to1.004]Where,TP=TruePositive=TrueNegative=FalsePositive RESULTS
for the Digit Recognition dataset problem, RBFhasshownthebestaccuracysensitivityspecificityand thekappastatistic.
© 2022, IRJET | Impact Factor value: 7.529 | ISO 9001:2008 Certified Journal | Page715
[1] L. Bhambhu And D. K. Srivastava, “Data Classification using Support Vector Machine,” Journal of Theoretical andAppliedInformationTechnology.
[6] B.Boser,I.GuyonandV.Vapnik,“ATrainingAlgorithm for Optimal Margin Classifiers,” in 5th Annual ACM WorkshoponCOLT(ed.Haussler,D.),Pittsburgh,1992.
[2] W.S.Noble,“WhatisaSupportVectorMachine?,”Nature PublishingGroup,vol.24,2006.
[3] I. S. Al Mejibli, D. H. Abd, J. K.Alwan and A. J. Rabash, “Performance Evaluation of Kernels in Support Vector Machine,” in 1st Annual International Conference on InformationandSciences(AICIS),2018.
Wehavediscussedandviewedtheresultsofthecomparative study of SVM kernels for 3 different types of datasets namelyHeartDisease,DigitrecognitionandSocial network Ads. We used 4 types of common kernels Linear, Polynomial, Gaussian Radial Basis Function (RBF) and SigmoidkernelsofSupportVectorMachine(SVM)modelto labeltherequiredvariableforclassifyingeachofthedatasets using all the features. We evaluated the Support Vector Machine(SVM)modelperformancewitheachofthekernel types using performance metrics Accuracy, Sensitivity, Specificity,Kappastatistic.Afterevaluation,wecanconclude that the Gaussian Radial Basis Function (RBF) kernel is optimal for datasets having no prior knowledge. However contrarytothepopularbeliefthatlinearkernelworkswell withlargedatasets,ithasshownlessperformancecompared to Gaussian Radial Basis Function (RBF) kernel. Sigmoid Kernel has shown relatively low accuracy for all the three types of dataset problems; however, it has shown optimal performance for modicum volume datasets that need high sensitivity. For future work, investigation can be done on combiningdifferentkernelsforbetterperformance.
Volume: 09 Issue: 03 | Mar 2022 www.irjet.net
[4] M. M. Islam, H. Iqbal, M. R. Haque and M. K. Hasan, “Prediction of Breast Cancer using Support Vector Machineand K Nearest Neighbors,” in IEEE Region 10 HumanitarianTechnologyConference(R10 HTC),Dhaka, 2017.
5. CONCLUSION
REFERENCES
p-ISSN: 2395-0072
sensitivityarealsoimportantforthistypeofdataset,theRBF and Sigmoid kernels have shown good sensitivity and specificity index respectively. The kappa statistic is also maximumfortheRBFkernel.
[5] M. Hussain, S. K. Wajid, A. Elzaart and M. Berbar, “A ComparisonofSVMKernelFunctionsforBreastCancer Detection,”inEighthInternationalConferenceComputer Graphics,ImagingandVisualization,2011.
Furthermore,fortheSocialNetworkAdsDataset While accuracy,specificityandkappastatisticismaximumforRBF kernel,thePolynomialkernelhasshownthebestsensitivity. On the contrary, the Sigmoid kernel has shown the least performance.Meanwhile,
International Research Journal of Engineering and Technology (IRJET) e ISSN: 2395 0056
