Abstract “Uday Engineering and Scaffolding” in Sinnar, Maharashtra. Is a manufacturing company which produces a variety of scaffolding products, including wall forms, centering plates, wheel barrows, etc. Scaffolding is a temporary platform that is used for providing support on height and provides materials during a construction process for constructing or repairing of a structure. These products are used to provide a certain level of support to a standing structure throughout the phase of construction. From which we have chosen “centering plates” to do our study on. The lead time for making one batch of centering plate is two days, where on first day only first half of the factory works and other all machines are kept idle as only cutting of raw material takes place.
Aadish Gandhi, Dept. of Production Engineering, KK Wagh College of Engineering, Maharashtra, India
● Value stream maps can create connections to thecustomer,whichhelpsanorganizationfocus more on the customer’s perspective and deliver morevaluetothecustomer.
On next day workers starts assembly and welding Ourprocesses.project focuses on reducing lead time by creating a current and future state mapping of value stream. Which when implemented not only will reduce lead time but also provide recommendations to improve current operations within the company)
Key Words: Bottleneck,Cycletime,Inventory,Inventory leadtime,Leadtime,Processefficiency,Takttime,Value addingtime,VSM 1.
Certified Journal | Page500
Volume: 09 Issue: 02 | Feb 2022 www.irjet.net p ISSN: 2395 0072 2022, IRJET | Impact Factor value: 7.529 | ISO 9001:2008
Aadish Gandhi1, Tanmay Pawar2, Niraj Ladhe3
International Research Journal of Engineering and Technology (IRJET) e ISSN: 2395 0056
3Niraj Ladhe, Dept. of Mechanical Engineering, Guru Gobind Singh College of Engineering, Maharashtra, India ***
In the book Value Stream Mapping: How to Visualize Work Flow and Align People for Organizational Transformation, Martin and Osterling [8] summarized thebenefitsofvaluestreammappingasthefollowing.
2Tanmay Pawar, Dept. of Production Engineering, KK Wagh College of Engineering, Maharashtra, India
©
1
● Thevisualunificationtoolcanhelpinvisualizing non visible work, such as information exchanges.Visualizingnon visiblework isa key stepinunderstandinghowworkgetsdone.
Value Stream Mapping for Small Scale Industry with Make to Order Manufacturing Strategy
Value stream mapping in the manufacturing environmenthasbeendiscussedsincethetechniquewas used at the Toyota Motor Corporation, and was known as “material and information flows.” Toyota focuses on understanding the flow of material and information across the organization as a way to improve manufacturing performance.
● Value stream mapping can help in visualizing and simplifying the work process at a macro level, which may help in making strategic improvementdecisionsbetterandfaster.
● Valuestreammapscanprovideaholisticsystem view by connecting disparate parts into a more collaborative organization, with the objective of providinghighervaluetocustomers.
Value stream maps are effective means to orient newcomers by helping them understand a holistic view and where they fit in an organization.To sum up, value stream maps provide a visual, full cycle macro view of how work progresses from a customer request to the final fulfilment of that request. The mapping process deepenstheunderstandingofworksystemsthatdeliver value to customers and reflect the work flow from a customer’s perspective. As a result, the process of value stream mapping provides effective ways to establish strategicdirectionsforbetterdecisionmakingandwork design.
INTRODUCTION
Pictorial representations with process maps are ways to communicate with different parties in an organization. In this way, value streammapscanprovidea wholeviewofhowworkare donethroughtheentiresystems.

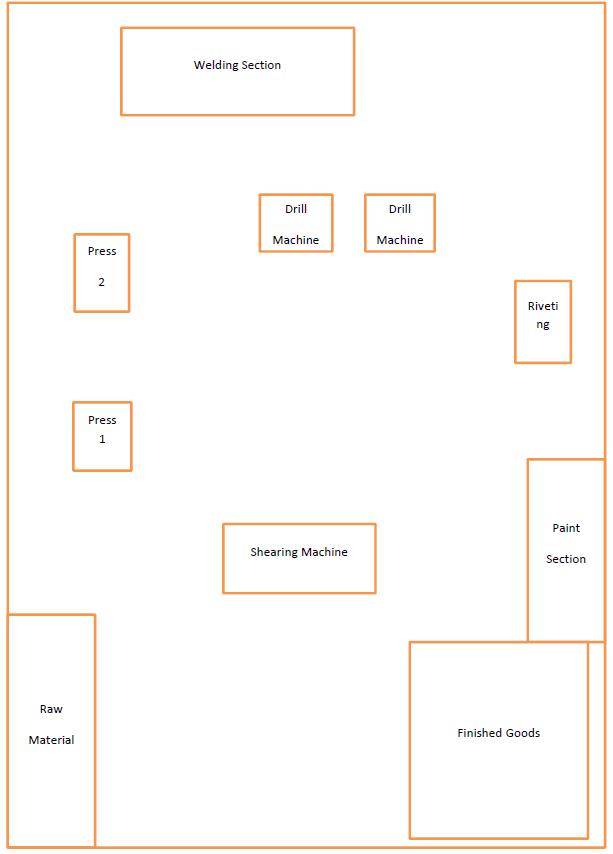
Table 1:SheetCutting
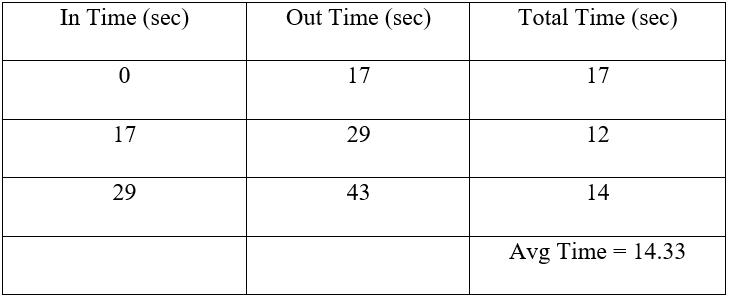
3. ANGLE STRAIGHTENING:
Problem: In angle straightening operation two workers are needed. One to check the bend and other one to straighten the angle by hammering. This operation is carried out manually where both workers have to sit uncomfortablyonthegroundand carryout the process. This causes too much fatigue and the process consumes lotoftime.
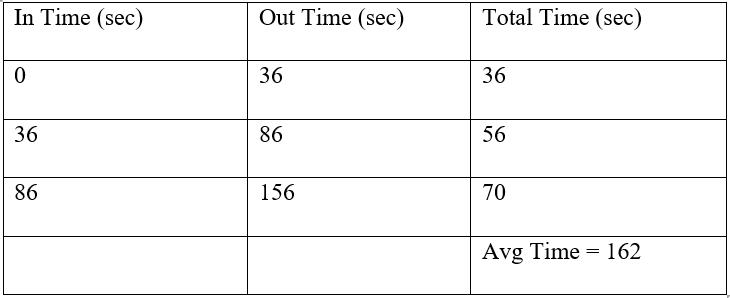
International Research Journal of Engineering and Technology (IRJET) e ISSN: 2395 0056 Volume: 09 Issue: 02 | Feb 2022 www.irjet.net p-ISSN: 2395-0072 © 2022, IRJET | Impact Factor value: 7.529 | ISO 9001:2008 Certified Journal | Page501 Fig.1 RoadmapforValueStreamMapping 2. Layout: Fig.2 Layout of Plant 3. Problems Identified:
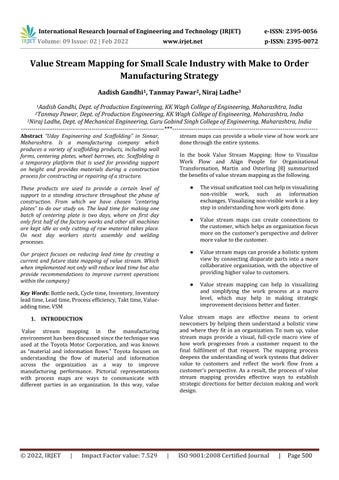
2. ANGLE CUTTING:
Problem: Whileobservinganglecutting,wenoticedthat three workers were working. One was providing the angletotheoperatorcuttingtheangleandthethirdone wasaligningandreleasingtheangle. Table 2:Anglecutting
1. SHEET CUTTING:
Problem: During sheet cutting operation five to six workers are required. Three people to handle the sheet on one side of the machine and other two on the other sidetoalignthesheetandrotateittogivemultiplecuts. Table1showsthetimetakenforsheetcuttingoperation.
Table 3:AngleStraightening


International Research Journal of Engineering and Technology (IRJET) e ISSN: 2395 0056 Volume: 09 Issue: 02 | Feb 2022 www.irjet.net p-ISSN: 2395-0072
4. Methodology:
Table 4:FrameBending
5. PRODUCTION FLOW:
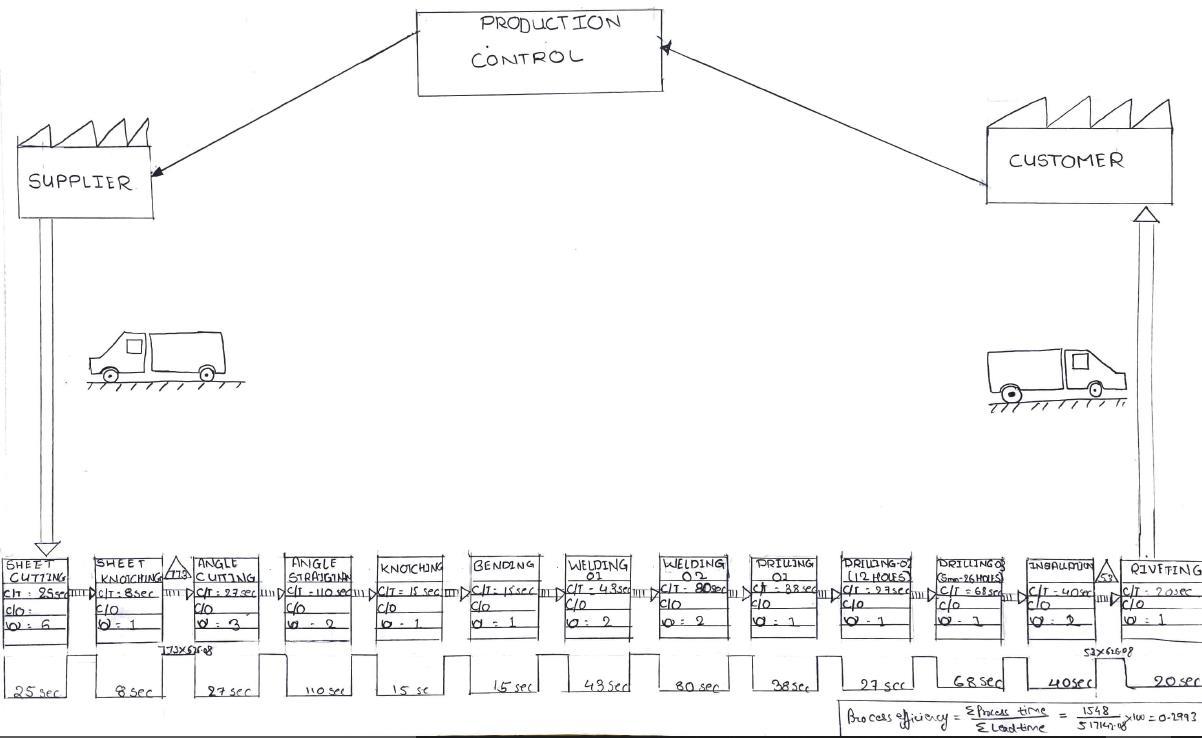
Fig.3 Currentstatemap
No. of Sheets manufactured is 28800/33 =872.72 i.e872 units.
Current state Takt time = (Available time/customer Demand) 86400/138=626.08s
Process=Anglecutting(27)+AngleStraightening(110)+ Notching(15)+Bending(15)+Welding 1(43)+welding 2(80)=Processtime(290s)
4. BENDING:
• Day 1 Time=28800s Process = Sheet cutting (25s) + Sheet Notching (8s) = ProcessTime(33s)
© 2022, IRJET | Impact Factor value: 7.529 | ISO 9001:2008 Certified Journal | Page502
• Day-2 Time=28800s
Problem: After observing the complete production, we observed that the making of complete product requires threedayswhichcouldbereducedbymakingnecessary changes
Problem: Thisprocessiscarriedoutbyoneworkerand takes usual time but this process causes lot of fatigue andalsosometimesleadstomisalignmentoftheangle.
No. of Frames manufactured 28800/290 = 99.31 i.e., 99 units. • Day-3 Time=28800s Process = Drill 1 (38) + Drill 2 (23) + Drill 3 (68) + Installation(40)+Riveting(20)=ProcessTime(189s)
For Day 1 (773 Sheets) are WIP 773 X 626.08 = 483959.84sleadtime For Day 3 (53 Sheets) are WIP 53 X 626.08= 33182,24s lead Nowtime.process
International Research Journal of Engineering and Technology (IRJET) e ISSN: 2395 0056
Now using various VSM methods like Kaizen, FIFO, Pull, Supermarket, streamline flow process, time is brought downby73secondsthatis441secondsisanewtime.
Sototalprocesstime=441x3=1323
TotalLeadtime sonowinthefuturestatewhenthemock test was done it was observed that including all the process 20 work in progress inventory was observed in totalcycletime
So, during 3 days of manufacturing (Day 2) is the bottleneck 99 plates are produced on that day, so during the 3 days of manufacturing in total only 99 complete finishedproducts.
Volume: 09 Issue: 02 | Feb 2022 www.irjet.net p ISSN: 2395 0072 © 2022, IRJET | Impact Factor value: 7.529 | ISO 9001:2008 Certified Journal | Page503
Nowprocesstimeforallthreedaysis516sX3=1548s Processefficiency%=(1548)/(517142.08)X100 Processefficiencyforcurrentstate=0.2993% Future State Map: Fig.4 FutureStateMap. In future state mapping, we have introduced continuous streamlineproductionflow Timeavailable=8hrsx60mx60sec =28800 For 3 days so as to compare it with Current state ratio mustremainsame=28800x3 So3daysaretakenintoaccount=86400seconds.
No.ofprocessedunits28800/189=152.38i.e., 152 units.
efficiency%=processtime/Leadtime
Here,fortheleadtime,wehaveonlyconsideredleadtime inventorywhichis483959.84s+33182.24s=517142.08s

International Research Journal of Engineering and Technology (IRJET) e ISSN: 2395 0056 Volume: 09 Issue: 02 | Feb 2022 www.irjet.net p ISSN: 2395 0072 © 2022, IRJET | Impact Factor value: 7.529 | ISO 9001:2008 Certified Journal | Page504 So,20x3=60 leadtime=60xtakentime=37564.8
So, process efficiency = process time/lead time x100= 1323/37564.8x100
Process efficiency of future state = 3.5219% Now, customerdemandwas138platesin3days.
In the future state map, the available time is 86400 sec, andtheprocessingtimeis441 i.e., 86400/441=195.91, Therefore 195 plates can be So,manufactured.usingfuture state maps manufactured is able to cater tothedemandandhasthe capabilityto provideover 195 plates which are 96 plates more than current state mapping. Capacity analysis for production of centring plate (Before andFig.5After):
In the current state map, it was only able to provide 99 plates and was deficient by 39 plates so during this time company either had to outsource the required amount or theyhadtodelaytheshipping.
CapacityanalysisforCurrentstate Fig.6 capacityanalysisfuturestate Time analysis (Before and After): Fig.7 TimeanalysisCurrentstate Fig.8 Timeanalysisfuturestate
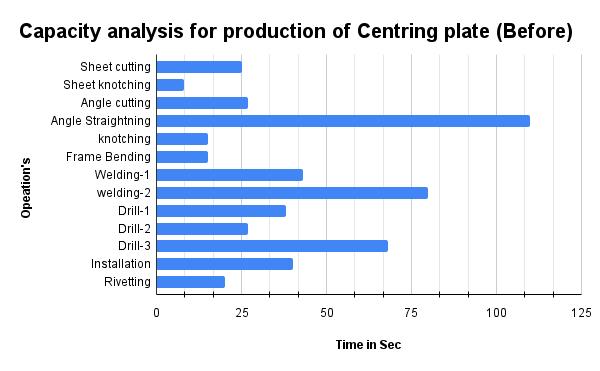

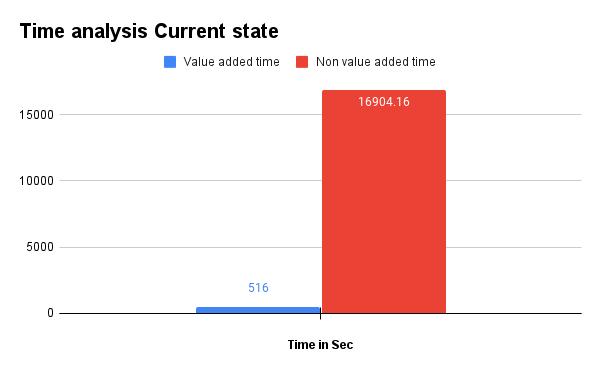
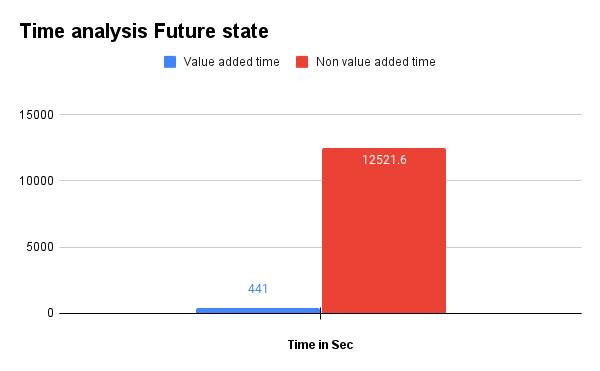
Fig.10 FlowofMaterialFuturestate
[7] Jones, Dan & Womack, Jim & Shook, John. (2021). SeeingtheWholeMappingtheExtendedValueStream.
[3] Gurumurthy Anand, Kodali Rambabu, (2011) “Design of lean manufacturing systems using value stream mapping with simulation: A case study”, Journal of ManufacturingTechnologyManagement,22,4,444 473.
[8] Karen Martin and Mike Osterling "McGraw Hill Education", Dec 16, 2013 Business & Economics 224 [9]pages.Rother, M., Shook, J., & Lean Enterprise Institute. (2003).Learning to see: Value stream mapping to create valueandeliminatemuda.Brookline,MA:LeanEnterprise.
● Main purpose is to establish continuous flow of material/product through entire supply chain process.
2. Total process efficiency of the plant is increased by 3.22% by application of lean principles like Pull,FIFO,Kaizen.
[2] DTI Manufacturing Advisory Service, 2005, "Manufacturing Management, Lean Manufacturing." 2007(07/19)pp.2.
International Research Journal of Engineering and Technology (IRJET) e ISSN: 2395 0056 Volume: 09 Issue: 02 | Feb 2022 www.irjet.net p ISSN: 2395 0072
5. Results and Conclusions:
● VSM is utilized to identify and then eliminate sourcesofwasteapplyingvarietyofleantools.
Fig.9 FlowofMaterialCurrentstate
3. Process efficiency of future state > process efficiencyofthecurrentstate (3.5219%)>(0.2993%)
Recommended New Flow of Material and Process, Complete Finished Product is made in a shift as pull systemisimplemented.
[6] Hines Peter, Rich Nick, “The seven value stream mapping tools”, International Journal of Operations & ProductionManagement,(1997b)17146 64.
[10] Manos, Tony (June 2006). "Value Stream Mapping an Introduction" (PDF). Quality Progress. American SocietyforQuality.p.64 viaUniversityofWashington.
1. By controlling WIP inventory, reduction in production lead time by 92.73% is achieved. we can say VSM is effective way to control the inventory and reduce lead time by implementing modifications in the existing manufacturing conditions. VSM deals with overall, integrated optimization of enterprise processes at every level.VSMcanbeutilizedinfollowingmanner.
● Goals for VSM are shortest lead time, zero inventorieswithlowestcostandhighestqualityof product. Addressing enterprise level VSM with Extended “Value StreamMapping”isfuturescopeforthestudy.
© 2022, IRJET | Impact Factor value: 7.529 | ISO 9001:2008 Certified Journal | Page505
References: [1] Abdulmalek Fawaz A., Jayant Rajgopal, (2007) “Analyzing the benefits of lean manufacturing and value stream mapping via simulation: A process sector case study,”Int.J.ProductionEconomics,107,223 236
[4] Hines, P., and Rich, N., "The Seven Value Stream MappingTools,"(0144).
[5] Hines Peter, Jones Daniel T., Rich Nick, “Lean logistics”, International Journal of Physical Distribution &Logistics Management,(1997a)27 3/4153 173.


[13] Wilson, J. (2009). Directions to discovery value stream maps start and end at customer satisfaction.
[14] Womack, J.P. and Jones D.T., (1994) “From lean production to lean enterprise”, Harvard Business Review, March April,93 103.
IndustrialEngineer,41(4),38 42.
© 2022, IRJET | Impact Factor value: 7.529 | ISO 9001:2008 Certified Journal | Page506
[11] Standridge Charles R., Rapids Grand, (2006) “Why lean needs simulation”, Proceedings of the 38th conference on Winter Simulation Conference WSC, 1907 [12]1913.Womack, J.P. and Jones D.T., Roos D., (1990) “The machine that changed the world: The story of lean production”,NewYork,Simon&Schuster
International Research Journal of Engineering and Technology (IRJET) e ISSN: 2395 0056 Volume: 09 Issue: 02 | Feb 2022 www.irjet.net p ISSN: 2395 0072