Professor and Head, Department of Electrical and Electronics Engineering, ATME College of Engineering, Mysuru, Karnataka, India The increased use of non linear loads such as lighting technologies has led to power quality variation of distribution networks. In recent times, different lighting technologies are finding their way into the market. As such, it is paramount to evaluate the performance characteristics of operatingcombinationpowerlampdeviationfluorescentspecificationsresultscalculatedComponentstheseloadspurposelighting(IHD)ahavetheselightingtechnologiesandthepossibleeffectstheymightonthepowernetwork.Inthisregard,thecurrentstudyisbasicsteptoestimateIndividualHarmonicComponentsandTotalHarmonicDistortion(THD)ofvariousloads.Anexperimentalsetupwasdevelopedforthisandexperimentswereconductedforfivelightingthatarecommonlyusedinpractice.Thewaveformsofloadswererecorded,andtheIndividualHarmonicandTotalHarmonicDistortionofeachloadwereusingtheFastFourierTransform(FFT).TheobtainedwerecomparedwiththestandardandfoundtobeacceptableinthecaseofandIncandescentlampswhereasaconsiderablewasfoundfortheHighPressureSodiumVapourandCompactFlorescentlamp.ItisalsoobservedthatthefactorisimprovedandtheTHDislessforaofloadsincomparisontothelightlyloadindividually.
*** Abstract
Lightingisonesuchfield,wherethelightsources,suchas Fluorescent Tube Light (FTL), Incandescent lamp (GLS), Mercury Vapour Lamp (Hg) and High Pressure Sodium Vapour lamps (HPSV) are widely used in residential, commercial, industrial applications and street lighting. In HPSV lamps, a 33μF capacitor is commonly utilized to improveignitionandpowerfactor.Inrecentdays,Compact Fluorescent lamps (CFL) are widely being used from the pointofconsumption.CFLandHPSVbehavealmostasnon linearloadsbecausetheyworkontheprincipleofdischarge. ThesedischargelampscontributeforHarmonicDistortion affectingthequalityofthepower.
Associate Prof., Department of Electrical and Electronics Engineering, ATME College of Engineering, Mysuru, Karnataka, India
2
3
Lightingplaysavitalroleinregularhumanactivitieswhich may be naturally (sunlight) or artificial (lamps). Artificial lightinghasbeendeterminedtobeoneofthecomponentsof theelectricalsystemthathasanimpactonpeople'squality oflife[1].Inordertocompleteataskcomfortably,adequate lightingisessentialinworkplaces,classrooms,andoffices. Asaresult,itmustbephysicallyacceptableforthosewho operate in the task area. However, most recent light technologies are categorized as non linear loads, which mayhaveanegativeimpactonthesurroundingdistribution network'spowerquality.Furthermore,lightingaccountsfor 21%oftotalglobalelectricalenergy usage[2].Therefore, utilizing energy efficient lights to reduce electrical energy consumption is widely considered to be one of the most essential options for reducing consumption of electrical energy.Manycompaniescameuptocreatevariouslampsin anattempttogivethissolution.Asaresult,variouslighting systemshaveenteredthemarket.Assuch,itisparamountto evaluate the lighting technology's performance characteristicsaswellasthepotentialeffectsonthepower Althoughgrid. these recent lighting technologies provide numerous advantages, because they are non linear loads, theyhaveatendencytoproduceharmonics.Harmonicsin the power system have severe implications for the power system; they increase line losses and cause equipment to overheat,reducingitslifetime.Sub harmonicsmaygenerate flickers,whichcauseanunpleasantvisualimpressiononthe eyes, transformer imbalance and core saturation, and thermal ageing of induction machine. As a result, it is necessary to assess the power system's impact on these latestlamptechnologies[3].
The present work experiments were conducted to observe/record waveforms of different lighting loads and theIndividualHarmonicComponentsandTotalHarmonic Distortion of each load were calculated using the Fast FourierTransform 1.1 INDIVIDUAL AND TOTAL HARMONIC DISTORTION
International Research Journal of Engineering and Technology (IRJET) e ISSN: 2395 0056 Volume: 09 Issue: 02 | Feb 2022 www.irjet.net p ISSN: 2395 0072 © 2022, IRJET | Impact Factor value: 7.529 | ISO 9001:2008 Certified Journal | Page300 EFFECT OF LIGHTING LOADS ON THE POWER QUALITY Raghavendra L1 , Sathish K R2 , Parthasarathy L3 1
Assistant Prof., Department of Electrical and Electronics Engineering, ATME College of Engineering, Mysuru, Karnataka, India
1. INTRODUCTION
Individual harmonic distortion (IHD) is the ratio between the root mean square (RMS) value of the individual harmonicandtheRMSvalueofthefundamental. IHDn=(In/I1)*100…..(1) TheIHDshowshoweachharmonicfrequencycontributesto thetotalharmonicdistortionanddescribesthenetdeviation causedbyallharmonics.Thesearebothkeyparametersfor
Key Words: Power Quality, Individual Harmonic Components,TotalHarmonicDistortionandLightingloads.

THD=√(IHD12+IHD22+IHD32…+IHD132)…..(2) While the Total Harmonic Distortion provides no informationontheharmonicmake up,itisusedtodescribe thedegreeofharmonicpollutioninthepowersystem
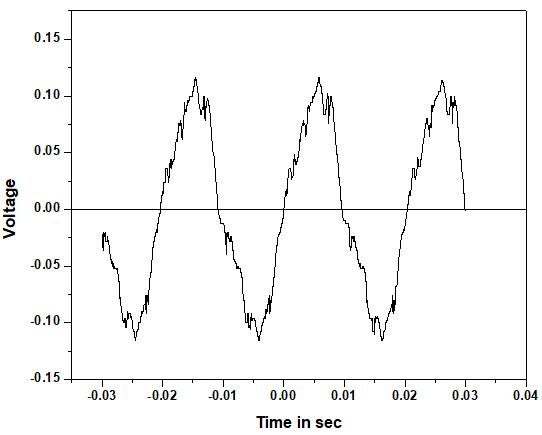
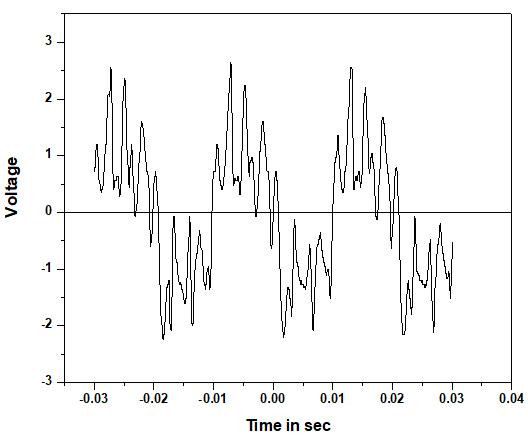
Fig. 2 (a) Wave shape of the input
2.2 Experimental Procedure
Afterconnectingthelampacrosstheloadterminal,asingle phase supply was given to the circuit. The load manager recordsthecurrent,voltage,powerfactorandpower.With thehelp ofDSO waveforms were observed and stored. By using ULTRASCOPE software stored waveform was then convertedintoadatafile.Thedatathusobtainedisusedin originsoftwareandFFTanalysiswasperformedtoobtain differentharmoniccomponents.
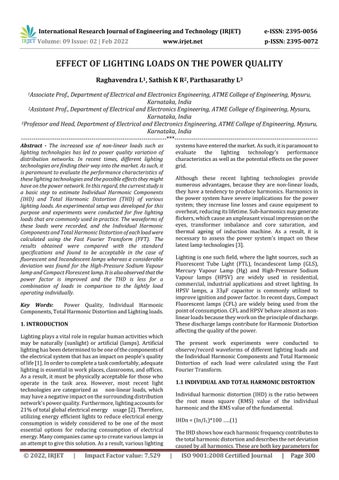
Figure.1illustratestheexperimentalsetupforthepresent study. It consists of a load manager, a Digital Storage Oscilloscope (DSO), CT (10/5), shunted with a 1Ω non inductive wire wound resistor and terminals to connect variouslightingloads.TheoutputoftheDSOisconnectedto aPersonalcomputer.
Volume: 09 Issue: 02 | Feb 2022 www.irjet.net p ISSN: 2395 0072 © 2022, IRJET | Impact Factor value: 7.529 | ISO 9001:2008 Certified Journal | Page301
EXPERIMENTATIONFig.1Schematicdiagram of experimental set-up
2.1 Experimental setup
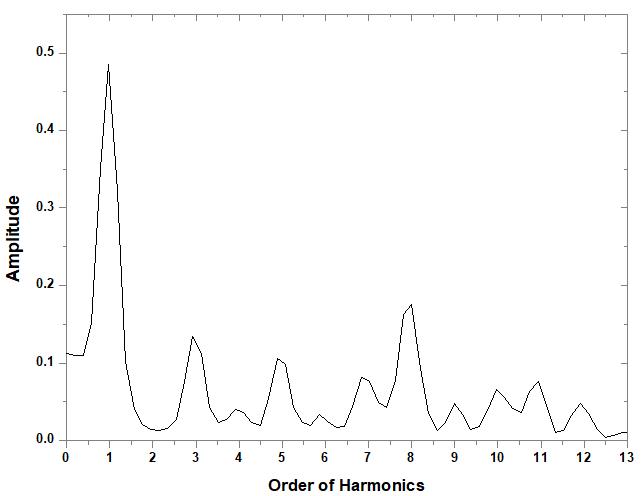
Table 2.1 Lighting loads used in the present study Type of lamp loads Rating Incandescentbulb 200W FluorescentTubeLight 40W CompactFluorescentLamp 8Wand23W High employingPressureSodiumVapourlamp33µFcapacitor. 250W Mercury Vapour Lamp employing 10µFand4µFcapacitor. 125W 3. RESULTS AND DISCUSSION InthepresentworkthelightingloadsusedareGLS, FTL,CFL,HgandHPSV.SinceGLS,CFLandFTLlightingloads arecommonlyusedforresidentialpurpose,HgandHPSVare lightingloadsusedinstreetlightingandinindustries.Hence in the present study these individual and combination of lighting loads are considered and the THD of each were calculated.Asafirststep,experimentwasconductedtofindthe THDoftheinputsupplyandcorrespondingwaveformofFFT analysisareshownintheFig.2(a)andFig.2(b)respectively. It can be observed that, the THD of the input harmonic components is about 13.02%, the same input supply was usedforalltheexperiments. ThesamplewaveformsandrespectiveFFTanalysis of the individual and combination of lighting loads consideredinthestudyobtainedfromtheexperimentsare showninfiguresrespectively.
Table2.1givesthevariouslamploadsusedinthepresent workwiththeirspecificationsandExperimentswerecarried outforalloftheloadsaddressedinthestudy.
Thevariouscausesofharmonicsare,dischargelamps,useof electronic loads, energy conservation devices in both industrial and domestic sectors, adjustable speed drives, solidstatepowerelectronicdevices,etc,. 2.
International Research Journal of Engineering and Technology (IRJET) e ISSN: 2395 0056
solvingharmonicissues;informationonthecompositionof individualdistortionsisrequiredsothatanysolutionmaybe tailoredtotheproblem.
ThesquarerootofthesumofallthesquaresofIHDistotal harmonic distortion. The greater the THD, more the distortedthe50Hzsinewave.Harmonicdistortionoccursin current and voltage waveforms. Typically, voltage THD shouldbelessthan5%andcurrentTHDshouldbelessthan 20%[4].
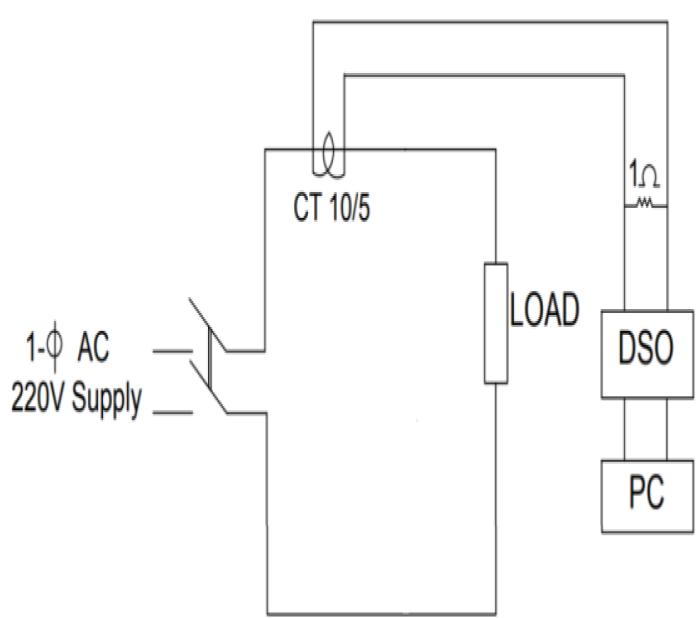
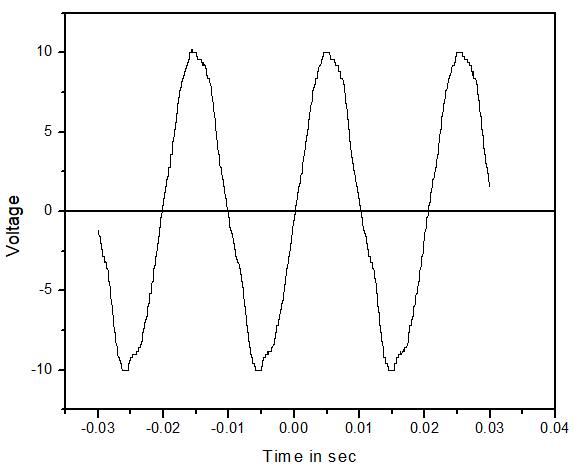
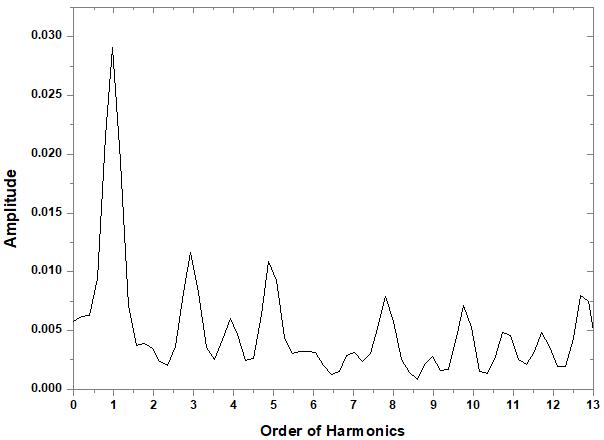
Fig 4 (b) FFT analysis of the Hg with 10 µF Capacitor waveform
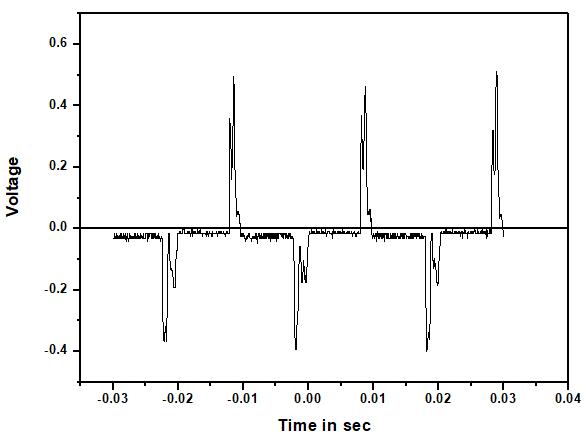
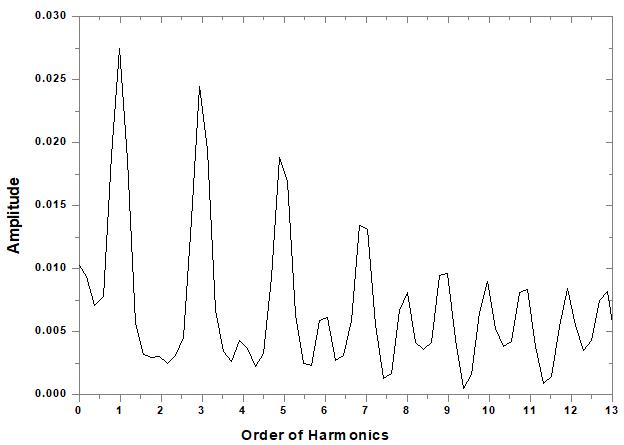
Fig 5 (a) Wave shape of the HPSV with 33 µF Capacitor
Fig 4(a) Wave shape of the Hg with 10 µF Capacitor
International Research Journal of Engineering and Technology (IRJET) e ISSN: 2395 0056 Volume: 09 Issue: 02 | Feb 2022 www.irjet.net p ISSN: 2395 0072 © 2022, IRJET | Impact Factor value: 7.529 | ISO 9001:2008 Certified Journal | Page302 Fig.2 (b) FFT analysis of the input waveform Fig 3 (a) Wave shape of the GLS Fig 3 (b) FFT analysis of GLS waveform


International Research Journal of Engineering and Technology (IRJET) e ISSN: 2395 0056 Volume: 09 Issue: 02 | Feb 2022 www.irjet.net p ISSN: 2395 0072 © 2022, IRJET | Impact Factor value: 7.529 | ISO 9001:2008 Certified Journal | Page303
Fig 5 (b) FFT analysis of the HPSV with 33 µF Capacitor waveform
Fig 8 (a) Wave shape of the HPSV_33 µF and Hg _10 µF
Fig 6 (a) Wave shape of the CFL_23W
Fig 7 (a) Wave shape of the Hg _4 µF and FTL
Fig 7 (b) FFT analysis of the Hg _4 µF and FTL waveform
Fig 6 (b) FFT analysis of the CFL_23W waveform

International Research Journal of Engineering and Technology (IRJET) e ISSN: 2395 0056 Volume: 09 Issue: 02 | Feb 2022 www.irjet.net p ISSN: 2395 0072 © 2022, IRJET | Impact Factor value: 7.529 | ISO 9001:2008 Certified Journal | Page304 Table 3.1 Experimental Readings Recorded and THD values NoSL.. Loads inVoltageVolts AmperesinCurrent FactorPower inPowerWatts %THD 1 InputPower 230 0.8 13.02 2 GLS_200W 232 0.79 0.9 167 14.79 3 CFL_8W 230 0.09 0.40 8 79.42 4 CFL_23W 239 0.23 0.49 25 104 5 FTL_40W 232 0.37 0.64 54 14.96 6 Hg_4µF 231 0.84 0.67 130 30.83 7 Hg_10µF 234 0.64 0.83 124 79.41 8 HPSV_33µF 233 1.77 0.73 301 74.29 9 FTLandCFL_8W 242 0.4 0.67 65 35.85 10 FTLandCFL_23W 238 0.49 0.70 81 54.33 11 Hg_4µFandFTL 236 1.24 0.64 187 24.62 12 Hg_10µFandCFL_23W 234 0.75 0.83 145 63.09 13 HPSV_33µFandHg_10µF 233 2.24 0.80 413 116.47 14 FTLandHPSV_33µF 234 1.86 0.80 348 59.46 15 HPSV_33µFandHg_4µF 232 2.29 0.77 411 83.55 16 FTL,Hg_10µFandCFL_23W 238 1.05 0.82 204 62.96 17 FTL,Hg_10µFandHPSV_33µF 233 2.44 0.82 466 64.67 Fig 8 (b) FFT analysis of the HPSV_33 µF and Hg _10 µF waveform
As discussed earlier, in most of the applications different lightingloadsareused.Fromthewaveformsandrespective FFT analysis of combination of loads shows that, combination of FTL and Hg_4µF gives a minimum THD of 24.62%andcombinationofHPSV_33µFandHg_10µFgives ahighestTHDofabout116.47%amongthecombination. Itisalsonotedthat,thepowerfactorincaseofcombination of loads is above 0.64 in all the cases as compared to individualloads.Thewaveshapeforeachlamploaddepends ontheinputwaveshape. ItisfoundthattheTotalHarmonicDistortionranges fromabout13.02%to116.47%. Thepowerfactorin the caseofacombinationofloadsisbetterincomparisontothe lightlyloadoperatingindividually.TheTHDinthecaseofa combinationofloadsislessincomparisontothelightlyload operatingindividually.
4. ThepowerfactorisbetterandTHDislessinthecaseofa combinationofloadsincomparisontothelightlyload operatingindividually.
[3] Lukasz Michalec, Michal Jasinski “Impact of Harmonic CurrentsofNonlinearLoadsonPowerQualityofaLow VoltageNetwork:ReviewandCaseStudy”Energies2021, 14,3665.https://doi.org/10.3390/en14123665.
2. LowTHDisachievedbyGLSandFTL,withGLShaving thelowestandCFL23WhavingthehighestTHDamong theloadsstudiedinthiswork.
3. Individualharmoniccomponentsestimatedinthecase ofCFL 8WdonotmeetIEEE519requirements,i.e.,the 3rdand5th harmoniccomponentsaremuchhigherthan the percentage of fundamental component (i.e. 3rd harmonic component is less than 5 percent and 5th harmonic component is less than 2.5 percent of the fundamental).
AUTHORS
International Research Journal of Engineering and Technology (IRJET) e ISSN: 2395 0056 Volume: 09 Issue: 02 | Feb 2022 www.irjet.net p ISSN: 2395 0072 © 2022, IRJET | Impact Factor value: 7.529 | ISO 9001:2008
1. Manufacturersshouldaddresstheharmonicsgenerated byCFLstoextendthelifeofCFLsandreduceTHD,hence improvingPowerQuality.
5. REFERENCES
Associate ATMEDepartmentProfessorofEEECollegeofEngineering, Mysuru, Karnataka.Dr.SathishKR Assistant ATMEDepartmentProfessorofEEECollegeofEngineering,Mysuru, Karnataka.Dr.ParthasarathyL ProfessorandHead DepartmentofEEE ATMECollegeofEngineering,Mysuru, Karnataka.
[2]KalleRuuth,AnttiHilden,JenniRekola“Theimpactofled lighting systems to the power quality and recommendationsforinstallationmethodstoachievethe expectedenergyefficiency”25thInternationalConference onElectricityDistribution,CIRED2019.
[1] A. S. O. Ogunjuyigbe, T. R. Ayodele, V.E Idika “Effect of Lamp Technologies on the Power Quality of Electrical DistributionNetwork”2017IEEEPES IASPowerAfrica, pp:159 163.
RaghavendraL
4. CONCLUSIONS
[4] 519 1992 IEEE Recommended Practices and RequirementsforHarmonicControlinElectricalPower Systems
Certified Journal | Page305
The main goal of this study was to calculate the Total Harmonic Distortion of individual and combination of lightingloads.Thefollowingconclusionsaredrawnfromthe experimentalresults: