Theworkcontroladventuredatasetgatherthedataoverthewordbyassembledin regioncunning,nationwiseand Areaskillful.Thedatasetincollectedbetweenyears2000to2019[8 12].Inaddition,thedatasetpaceofenergyofutilized andjoblessbysex(percent).ThegivenbreakdowndatasetisamassfromInternationalLaborOrganization(ILO),Geneva, Key Indicators of the Labor Market(KILM ninth discharge) and the ILOSTAT database, last got to January 2019.
Employment
International Research Journal of Engineering and Technology (IRJET) e ISSN: 2395 0056 Volume: 09 Issue: 02 | Feb 2022 www.irjet.net p ISSN: 2395 0072 © 2022, IRJET | Impact Factor value: 7.529 | ISO 9001:2008 Certified Journal | Page267
Additionally,Populationdeveloped15yearsandover,withtheexceptionofifforthemostpartfootnoted.
2.CaucasusalludestoArmenia,Azerbaijan,Cyprus,Georgia,Israelfurthermore,Turkey.
9.Populacematured16to65years.
3.Populacematured16yearsandover.
4.Populacematured14yearsandover.
6.Barringtheinstitutionalpopulace.
The Impact on of Labour Force Since Last 19 Years (2000-2019) by using Different Classification Techniques of Pattern Recognition
Gajanand A. Boywar1 , Chandrakant Patil1 , Pratik S. Jaiswal1 , Mukta G. Dhopeshwarkar1
7.Forfactualpurposes,theinformationforChinadoexcludethosefortheHongKongSpecialAdministrativeRegion(Hong KongSAR),MacaoSpecialAdministrativeRegion(MacaoSAR)andTaiwanProvinceofChina.
8.Populacematured15to69years.
2 Data Information
1.InformationavoidsArmenia,Azerbaijan,Cyprus,Georgia,IsraelandTurkey.
1 Introduction InternationalLaborOrganization(ILO)programmedonlaborforceparticipationrateandunemploymentrateispart of large international effort on demographic estimated and projection to which several UN agencies contribute. The principle target of ILO program is to give individual from States, International organizations and the general population everywhere with the most extensive, itemized and practically identical work and Unemployment of the work power for nationsandregions,theworldallinallanditsprimarytopographicalarea.theessentialinformation aresingle yearwork powerinterestratesbysex(percent)groupandpopulacematured15yearsandover[9].
5.Occupantpopulace(byright).
Worldwide
1Department of Computer Science & I.T, Dr. Babasaheb Ambedkar Marathwada University, Aurangabad, Maharashtra 431004 India. *** Abstract. The acknowledgment of work power interest rate and joblessness rate has turned into a significant part pondering in Employments Sector. Example acknowledgment turns into a significant part as the entire investigation compriseofstatistics.Inthepresentexamination,distinctiveclassifierofexamplerecognitionhavebeenutilized.Inwhich we have found extraordinary result by utilizing DecisionTree classifier, HoeffdingTree classifier, J48 classifier, LMT classifier, RandomForest classifier, RandomTree classifier, and in conclusion REPTree classifier i.e., 33.4298%, 39.725%, 82.1274%, 79.3054%, 98.4986%, 98.4624%, 66.4797% individually. When we apply DecisionTree classifier the result is poorinterestinglywithotherclassifierforexample33.4298%.what'smore,OtherhandtheRandomForestclassifierresult is high conversely with other classifier for example 98.4986%. in case on the off chance that we apply classifier of same kinddatalateron,wecouldextraordinaryresultsbytheutilizationof aboveclassifier.JustDecisionTreeclassifierwillbe consideredasuncommon. Keyword. TreeClassifier,DecisionTree,HoeffdingTree,J48,LMT,RandomForest,RandomTree, andREPTree.

International Research Journal of Engineering and Technology (IRJET) e ISSN: 2395 0056 Volume: 09 Issue: 02 | Feb 2022 www.irjet.net p ISSN: 2395 0072
10.Populacematured15to74years. 11.Nationals,occupants. 12.Populacematured18to64years. 13.Populacematured15to64years. 14.Peoplepresent(true). 15.Truepopulace. 16.Populacematured17yearsandover. 17.Fundamentalcityormetropolitanzone. 18.Excludingafewterritories. 3 Methodology Right off the bat, the way toward acquiring and fusing model information has been significantly changed so as to completelyincorporatedthedatasetassemble fromUnitedNationsstaticdivision.Atthatpointitwasnotinlineway,so weneedthattocleanthedatabasebaseinaneffectiveway.Forthatfirst,weareperfectthenoofoccasionssemanticgoofs whichareshowninthedatabaseclassification[13]. Beginningtheirahead,werefreshedallcharacteristicsinacertifiable way.Whenwehavedonethewholeabovedatabasecleaningprocessthedatabase issetuptoperformspecific activities onit.
© 2022, IRJET | Impact Factor value: 7.529 | ISO 9001:2008 Certified Journal | Page268
Fig.1. IllustrationofDatasetprocess
DecisionStump is usually used in conjunction with a boosting algorithm. Does regreesion(based on mean squared error) or classification(based on entopy). Missing is treated as separate value[1]. A HoeffdingTree (VFDT) is an incremental, anytime decision tree induction algorithm that is capable of learning from massive data streams, assuming that the distributiongeneratingexamplesdoesnotchangeovertime[2].J48classesforgeneratingaprunedorunprunedC4which basedon5decisiontree[3].LMTisusedtoclassifierforbuilding‘logosticmodeltrees’.Whichareclassificationtreeswith logisticregressionfunctionsattheleaves[4].TheRandomForestclassifierusedforcreateclassforconstructingaforestof random trees[5]. RandomTree used to create class for constructing a tree that considers chosen attributes at each node. Whochperformsnopruning.Alsohasanoptiontoallowestimationofclassprobabilities(ortargetmeanintheregression case)basedonhold outset(backfitting)[6].TheREPTreeisafastdecisiontreelearnerwhichbuildsadecision/regression treeusinginformationgain/varianceandpruneitusingreduced errorpruning[7].
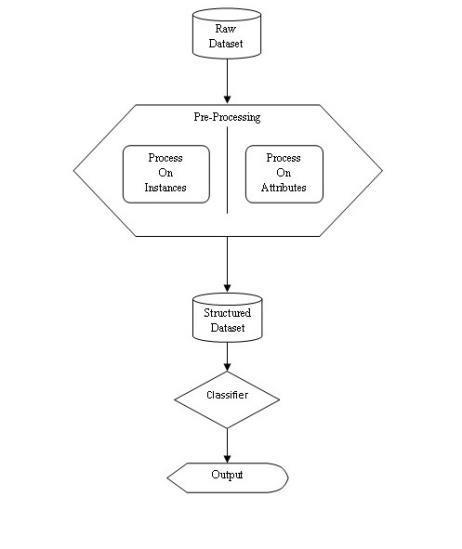
Table1.1. ConfusionMatrixofDecisionStump a b c d e f 922 1 0 0 0 0 5 926 0 0 0 0 916 0 0 0 0 0 5 916 0 0 0 0 803 113 0 0 0 0 17 904 0 0 0 0
After performing the DecisionStump classifier operation on dataset with 5528 number the result is shows as in table1 which state that the Correctly Classified Instances 1848 which is in 33.4298 %, Incorrectly Classified Instances 3680 which is 66.5702 %, Kappa statistic is 0.2001, Mean absolute error is 0.2273,Root mean squared error0.3371, Relative absoluteerroris81.8315%,Rootrelativesquarederroris90.4608%.
Where, a = Labour force participation Total, b = Unemployment rate Total, c = Labour force participation Male, d = UnemploymentrateMale,e=Labourforceparticipation Female,f=UnemploymentrateFemale. Table2. ResultofHoeffdingTree No.Ofinstance Result CorrectlyClassifiedInstances 2196 39.725% Incorrectly Classified Instances 3332 60.275% Kappastatistic 0.2759 Meanabsoluteerror 0.234 Rootmeansquarederror 0.3374 Relativeabsoluteerror 84.2287% Rootrelativesquarederror 90.5386% TotalNumberofInstances 5528
SubsequenttoplayingouttheHoeffdingTreeclassifieractivityondatasetwith5528numbertheoutcomeisappearsasin table2 which express that the Correctly Classified Instances 2196 which is in 39.725 %, Incorrectly Classified Instances 3332 which is 60.275 %, Kappa measurement is 0.2759, Mean outright mistake is 0.234, Root mean squared blunder 0.3374,Relativesupremeblunderis84.2287%,Rootrelativesquaredblunderis90.5386%.
International Research Journal of Engineering and Technology (IRJET) e ISSN: 2395 0056 Volume: 09 Issue: 02 | Feb 2022 www.irjet.net p ISSN: 2395 0072 © 2022, IRJET | Impact Factor value: 7.529 | ISO 9001:2008 Certified Journal | Page269
4 Implementation In the Labour Force Participation rate and unemployment rate(LFPRAUR) dataset the 5528 number of occasions subsequent to apply this classifier, the case in grouped in a different result. In DecisionStump classifier 33.4298% , a HoeffdingTree classifier is 39.725%, the J48 classifier is 62.1274%, the LMT classifier is 79.3054, the RandomForest is 98.4986%,theRandomTreeclassifieris98.4624%,andatthelastisREPTreeClassifieris66.4797%.
Table1. ResultofDecisionStump No.Ofinstance Result CorrectlyClassifiedInstances 1848 33.4298% Incorrectly Classified Instances 3680 66.5702% Kappastatistic 0.2001 Meanabsoluteerror 0.2273 Rootmeansquarederror 0.3371 Relativeabsoluteerror 81.8315% Rootrelativesquarederror 90.4608% TotalNumberofInstances 5528
International Research Journal of Engineering and Technology (IRJET) e ISSN: 2395 0056 Volume: 09 Issue: 02 | Feb 2022 www.irjet.net p ISSN: 2395 0072 © 2022, IRJET | Impact Factor value: 7.529 | ISO 9001:2008 Certified Journal | Page270
Table2.1. ConfusionMatrixofHoeffdingTree a b c d e f 719 5 62 0 137 0 1 927 0 0 3 0 497 1 376 0 42 0 1 918 0 0 2 0 601 119 22 0 174 0 9 906 0 0 6 0
CorrectlyClassifiedInstances 4540 82.1274% Incorrectly Classified Instances 988 17.8726% Kappastatistic 0.7855 Meanabsoluteerror 0.07 Rootmeansquarederror 0.187 Relativeabsoluteerror 25.1833% Rootrelativesquarederror 50.183% TotalNumberofInstances 5528
Subsequent to playing out the LMT classifier activity on dataset with 5528 number the outcome is appears as in table4 which express that the Correctly Classified Instances 4384 which is in 79.3054 %, Incorrectly Classified Instances 1144
Where, a = Labour force participation Total, b = Unemployment rate Total, c = Labour force participation Male, d = UnemploymentrateMale,e=Labourforceparticipation Female,f=UnemploymentrateFemale. Table4. ResultofLMT No.Ofinstance Result
CorrectlyClassifiedInstances 4384 79.3054% Incorrectly Classified Instances 1144 20.6946% Kappastatistic 0.7517 Meanabsoluteerror 0.0924 Rootmeansquarederror 0.2052 Relativeabsoluteerror 33.249% Rootrelativesquarederror 55.0739% TotalNumberofInstances 5528
Where, a = Labour force participation Total, b = Unemployment rate Total, c = Labour force participation Male, d = UnemploymentrateMale,e=Labourforceparticipation Female,f=UnemploymentrateFemale. Table3. ResultofJ48 No.Ofinstance Result
In the wake of playing out the J48 classifier activity on dataset with 5528 number the outcome is appears as in table3 which express that the Correctly Classified Instances 4540 which is in 82.1274 %, Incorrectly Classified Instances 988 which is 17.8726 %, Kappa measurement is 0.7855, Mean outright mistake is 0.07, Root mean squared blunder 0.187, Relativetotalblunderis25.1833%,Rootrelativesquaredblunderis50.183%. Table3.1. ConfusionMatrixofJ48 a b c d e f 879 1 26 0 17 0 0 746 0 77 1 107 26 0 886 0 4 0 0 310 0 556 3 52 35 6 7 1 862 5 4 266 1 26 13 611
SubsequenttoplayingouttheRandomForestclassifieractivityondatasetwith5528numbertheoutcomeisappearsasin table5whichexpressthattheCorrectlyClassifiedInstances5445whichisin98.4986%,IncorrectlyClassifiedInstances 83 which is 1.5014 %, Kappa measurement is 0.982, Mean supreme mistake is 0.0682, Root mean squared blunder is 0.1268,Relativetotalmistakeis24.5602%,Rootrelativesquaredmistakeis34.029%. Table5.1. ConfusionMatrixofRandomForest a b c d e f 922 0 0 0 1 0 0 898 0 22 0 11 0 0 916 0 0 0 0 18 0 896 0 7 0 0 0 0 916 0 0 15 0 8 1 897
Where, a = Labour force participation Total, b = Unemployment rate Total, c = Labour force participation Male, d = UnemploymentrateMale,e=Labourforceparticipation Female,f=UnemploymentrateFemale. Table6. ResultofNo.RandomTreeOfinstance Result CorrectlyClassifiedInstances 5443 98.4624% Incorrectly Classified Instances 85 1.5376% Kappastatistic 0.9815 Meanabsoluteerror 0.0051 Rootmeansquarederror 0.0506 Relativeabsoluteerror 1.8452% Rootrelativesquarederror 13.5837% TotalNumberofInstances 5528
International Research Journal of Engineering and Technology (IRJET) e ISSN: 2395 0056 Volume: 09 Issue: 02 | Feb 2022 www.irjet.net p ISSN: 2395 0072 © 2022, IRJET | Impact Factor value: 7.529 | ISO 9001:2008 Certified Journal | Page271 whichis20.6946%,Kappameasurementis0.7517,Meansupremeblunderis0.0924,Rootmeansquaredmistake0.2052, Relativeoutrightmistakeis33.249%,Rootrelativesquaredmistakeis55.0739%. Table4.1. ConfusionMatrixofLMT a b c d e f 841 0 28 1 53 0 1 492 0 232 2 204 10 0 900 0 6 0 0 113 0 661 1 146 104 0 14 1 786 11 5 99 0 105 8 704
Where, a = Labour force participation Total, b = Unemployment rate Total, c = Labour force participation Male, d = UnemploymentrateMale,e=Labourforceparticipation Female,f=UnemploymentrateFemale. Table5. ResultofRandomForestNo.Ofinstance Result CorrectlyClassifiedInstances 5445 98.4986% Incorrectly Classified Instances 83 1.5014% Kappastatistic 0.982 Meanabsoluteerror 0.0682 Rootmeansquarederror 0.1268 Relativeabsoluteerror 24.5602% Rootrelativesquarederror 34.029% TotalNumberofInstances 5528
Table6.1. ConfusionMatrixRandomTree a b c d e f 923 0 0 0 0 0 0 931 0 0 0 0 0 0 916 0 0 0 0 49 0 872 0 0 1 0 0 0 915 0 0 34 0 0 1 886 Where, a = Labour force participation Total, b = Unemployment rate Total, c = Labour force participation Male, d = UnemploymentrateMale,e=Labourforceparticipation Female,f=UnemploymentrateFemale. Table7. ResultofNo.HoeffdingTreeOfinstance Result CorrectlyClassifiedInstances 3675 66.4797% Incorrectly Classified Instances 1853 33.5203% Kappastatistic 0.5976 Meanabsoluteerror 0.12 Rootmeansquarederror 0.2449 Relativeabsoluteerror 43.1991% Rootrelativesquarederror 65.726% TotalNumberofInstances 5528
5 Conclusion After the few classifier tries the result on the work power cooperation, Unemployment rate, in whichMale support, and there joblessness rate,also the Female work power investment and there joblessness rate discovered exceptional outcome by using DecisionTree classifier, HoeffdingTree classifier, J48 classifier, LMT classifier, RandomForest classifier, RandomTreeclassifier,andinendREPTreeclassifier.WhenweapplyDecisionTreeclassifiertheoutcomeispoorstrikingly withotherclassifierforinstance33.4298%.inaddition,OtherhandtheRandomForestclassifierresultishighthenagain with other classifier for instance 98.4986%. On the off chance that in case we apply classifier of same kind information lateron, wecouldphenomenal outcomesby theuseof above classifier. Just DecisionTreeclassifier will be considered as phenomenal.
International Research Journal of Engineering and Technology (IRJET) e ISSN: 2395 0056 Volume: 09 Issue: 02 | Feb 2022 www.irjet.net p ISSN: 2395 0072 © 2022, IRJET | Impact Factor value: 7.529 | ISO 9001:2008 Certified Journal | Page272
InthewakeofplayingouttheREPTreeclassifieractivityondatasetwith5528numbertheoutcomeisappearsasintable7 which express that the Correctly Classified Instances 3675 which is in 66.4797%, Incorrectly Classified Instances 1853 which is 33.5203%, Kappa measurement is 0.5976, Mean total blunder is 0.12, Root mean squared mistake 0.2449, Relativeoutrightblunderis43.1991%,Rootrelativesquaredmistakeis65.726%. Table7.1. ConfusionMatrixofREPTree a b c d e f 806 1 65 0 51 0 2 814 0 54 5 56 153 0 759 0 4 0 2 614 0 283 6 16 185 17 7 4 702 1 12 557 0 13 28 311 Where, a = Labour force participation Total, b = Unemployment rate Total, c = Labour force participation Male, d = UnemploymentrateMale,e=Labourforceparticipation Female,f=UnemploymentrateFemale.
InthewakeofplayingouttheRandomTreeclassifiermovementondatabasewith5528numbertheresultisappearedas intable6whichexpressthattheCorrectlyClassifiedInstances5543whichisin98.4624%,IncorrectlyClassifiedInstances 83whichis1.5376%,Kappaestimationis0.9815,Meanpreeminenterroris0.0051,Rootmeansquaredscrewup0.0506, Relativealloutbungleis1.8452%,Rootrelativesquaredbumbleis13.5837%.
12. ILO, Estimates and Projections of the Economically Active Population, 1990 2030 (2013 edition, Geneva 2013);
2. GeoffHulten,LaurieSpencer,PedroDomingos:“Miningtime changingdatastreams”.In:ACMSIGKDDIntl.Conf. onKnowledgeDiscoveryandDataMining,97 106,2001.
© 2022, IRJET | Impact Factor value: 7.529 | ISO 9001:2008 Certified Journal | Page273
1. UnitedNationsstaticdivisionhttp://data.un.org
5. LeoBreiman(2001).RandomForests.MachineLearning.45(1):5 32
10. ILO, Estimates and Projections of the Economically Active Population, 1980 2020 (5th edition, Geneva 2007, UpdateAugust2008,UpdateDecember2009).
11. The reduction from 193 to 189 reference areas is due to the inclusion of the data of Dominique, Martinique, FrenchGuyanaandRéunionintometropolitanFrance.Thechangeinhorizonfrom2050to2030allowstobase theprojectionssolelyoneconometricmethods.
8. ILO,EconomicallyActivePopulation:Estimatesandprojections,1950 2025(3rdedition,Geneva1986).
9. ILO,EconomicallyActivePopulationEstimatesandprojections,1950 2010(4thedition,Geneva1996).
4. NielsLandwehr,Mark Hall,EibeFrank (2005).Logistic Model Trees.MachineLearning.95(1 2):161 205George H. John, Pat Langley: “Estimating Contiguous Distributions in Bayesian Classifiers”. In Eleventh Confrence on UncertainlyinArtificialIntelligence,SanMateo,338 345,1995.
6. ILO,Labourforceprojections,1965 85(1stedition,Geneva1971).
International Research Journal of Engineering and Technology (IRJET) e ISSN: 2395 0056 Volume: 09 Issue: 02 | Feb 2022 www.irjet.net p ISSN: 2395 0072
13. Anupriya K. Kamble, Ramesh R. Manza, Yogesh M. Rajput, Kavita A. Khobragade ”Classification of Insulin Dependent Diabetes Mellitus Blood Glucose Level Using Support Vector Machine”, IOSR Journal of Computer Engineering(IOSR JCE),e ISSN:2278 0661,p ISSN:2278 8727(2017).
ILO,LabourForce.EstimatesandProjections,1990 2050(2015edition,Geneva2015).
6 References
3. RossQuinlan(1993).C4.5:“ProgramsforMachineLearning”.MorganKaufmannPublishers,SanMateo,CA.
7. ILO,Labourforceprojections,1950 2010(2ndedition,Geneva1976).