International Research Journal of Engineering and Technology (IRJET) e-ISSN: 2395-0056

ABSTRACT In this paper, an approach of predicting attentiveness of a person has been presented, using periocular region. One obvious approach of predicting the attentiveness is by training the system using a learning algorithm. This paper however presents an alternative novel approach in which a system is capable of segregating and detecting the periocular region with ability to analyze the attentiveness of the subject. The approach has also been developed with an intention of keeping the computational cost and storage requirement at a minimal level. Applications of the system include various fields where attentiveness becomes an important factor such as lecture hall or during driving. The proposed system along with its potential applications has been presented in this paper which also uses a number of commonly used vision based tools andtechniques.
1. INTRODUCTION
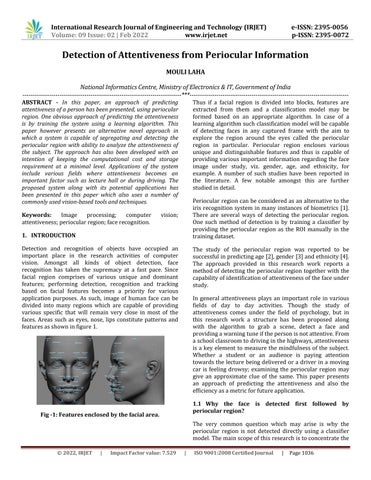
Fig -1: Features enclosed by the facial area. Thus if a facial region is divided into blocks, features are extracted from them and a classification model may be formed based on an appropriate algorithm. In case of a learningalgorithmsuchclassificationmodelwillbecapable of detecting faces in any captured frame with the aim to explore the region around the eyes called the periocular region in particular. Periocular region encloses various unique and distinguishable features and thus is capable of providingvariousimportant information regardingtheface image under study, viz. gender, age, and ethnicity, for example. A number of such studies have been reported in the literature. A few notable amongst this are further studiedin Perioculardetail.regioncanbeconsideredasanalternativetothe iris recognition system in many instances of biometrics [1].
Whether a student or an audience is paying attention towards thelecture beingdelivered ora driver ina moving car is feeling drowsy; examining the periocular region may give an approximate clue of the same. This paper presents an approach of predicting the attentiveness and also the efficiencyasametricforfutureapplication
1.1 Why the face is detected first followed by periocular region?
The very common question which may arise is why the periocular region is not detected directly using a classifier model.Themainscopeofthisresearchistoconcentratethe
The approach provided in this research work reports a methodofdetectingtheperiocularregiontogetherwiththe capabilityofidentificationofattentivenessofthefaceunder Instudy.general attentiveness plays an important role in various fields of day to day activities. Though the study of attentiveness comes under the field of psychology, but in this research work a structure has been proposed along with the algorithm to grab a scene, detect a face and providingawarningtuneifthepersonisnotattentive.From aschoolclassroomtodrivinginthehighways,attentiveness is a key element to measure the mindfulness of the subject.
The study of the periocular region was reported to be successfulinpredictingage[2],gender[3]andethnicity[4].
One such method of detection is by training a classifier by providing the periocular region as the ROI manually in the trainingdataset.
MOULI LAHA National Informatics Centre, Ministry of Electronics & IT, Government of India ***
Certified Journal | Page1036
Volume: 09 Issue: 02 | Feb 2022 www.irjet.net p-ISSN: 2395-0072
There are several ways of detecting the periocular region.
Keywords: Image processing; computer vision; attentiveness;periocularregion;facerecognition
Detection of Attentiveness from Periocular Information
© 2022, IRJET | Impact Factor value: 7.529 | ISO 9001:2008
Detection and recognition of objects have occupied an important place in the research activities of computer vision. Amongst all kinds of object detection, face recognition has taken the supremacy at a fast pace. Since facial region comprises of various unique and dominant features; performing detection, recognition and tracking based on facial features becomes a priority for various application purposes. As such, image of human face can be divided into many regions which are capable of providing various specific that will remain very close in most of the faces. Areas such as eyes, nose, lips constitute patterns and featuresasshowninfigure1.
1.4 How the training takes place?
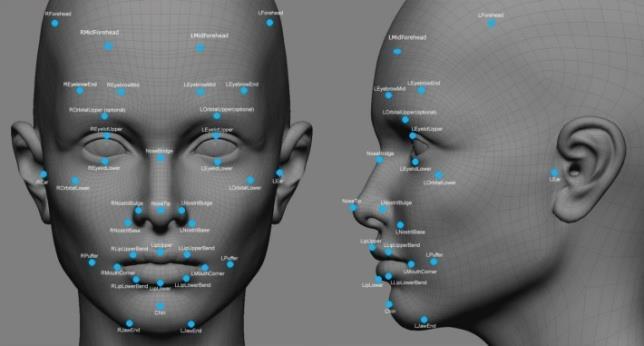
Supportvectorsaretrainingdatapointsthatareclosetothe separating hyperplane. To prove that they are enough to computetheseparatinghyperplaneisaconvexoptimization problem. The dual formulation is favoured for its easy solution with standard techniques. Using Lagrange multipliers, the problem may be re expressed in the equivalentmaximizationonα(dualform): = ∑ ∑ < , > Suchthat∑ =0and∀i∈[1,N] ≥0. Thehyperplanedecisionfunctioncanbewrittenas (x)=sign(∑ <x, >+b) The training takes place for 50 stages making the classifier morerobust.
© 2022, IRJET | Impact Factor value: 7.529 | ISO 9001:2008 Certified Journal | Page1037
Histogram of Oriented Gradients
One of the important terms here is the feature. Features constitutethebaseofanyimageprocessingexperiment.Any specific and well defined entity within an image or any sensor data which can be detected and recognized repeatedly and consistently is known as feature. A feature can be a point, a line, a corner or an edge. Detailed study aboutfeaturescanbefoundin[5].Therearevariousfeature descriptors available which helps in extracting the features from an image. Few of the standard feature descriptors are SIFT [6], SURF [7], HOG [8], and LBP [9] etc. For this work, HOGdescriptorhasbeenused.
Theideabehindhogdescriptoristhatitworksbasedonthe distribution of intensity gradients or edge directions which affectsthelocalappearanceofasubject.HOGdescriptorwas first described by Navneet DalalandBill Triggs [8], researchersfortheFrenchNationalInstituteforResearchin Computer Science and Automation(INRIA) [ref]. They exploredtheHOGdescriptorfordetectinghumanusingSVM classifier.
1.5 Support Vector Machine [11] SVMs are supervised learning model which are associated with classification and regression analysis of data. SVM classifiesdatabyfindingthebesthyperplane,separatingall datapointsofoneclassfromthoseoftheotherclass,shown in figure 2. It is assumed that both the classes are linearly Letseparable.(i ∈[1,N], ∈ ) be the feature vectors representing the training data and (i∈[1,N], ∈ { 1,1}) be their respective class labels. We can define a hyperplane by <w, x> +b = 0 where w ∈ and b ∈ . Since the classes are linearlyseparable,wecanfindafunctionf,f(x)=+bwith f ( )= (<w, >+b)>0,∀i∈[1,N]. Thedecisionfunctionmaybeexpressedas: (x)=sign(<w,x>+b)with ( )=sign( ),∀i∈[1,N]
Next term to be explained is the learning algorithm. Learning can be supervised or unsupervised. In this case supervised learning has been incorporated. Supervised learning [10] is basically a process of inferring a function from a set of labeled training data. Supervised learning entails learning a mapping between a set of input variables X and an output variable Y and applying this mapping to predicttheoutputsforunseendata. In the supervised learning paradigm, the goal is to infer a function f : X → Y , the classifier, from a sample data or training set composed of pairs of (input, output) points, belonging to some feature set X , and ∈ Y : = (( , ),...,( , ))∈ TypicallyX⊂ and ∈IR forregressionproblems,and is discrete for classification problems. We will often use exampleswith ∈{ 1,+1}forbinaryclassification. ThereexistmanylearningalgorithmsamongwhichSVMhas beenconsideredforthiswork.
International Research Journal of Engineering and Technology (IRJET) e-ISSN: 2395-0056
studyofperiocularregiondirectly,withallofitsvariability. Creating a classifier model incorporating all kinds of variations in the periocular region and detecting them efficientlyisacostlyoperation,computationallyasthereisa requirement of a huge number of training set to train the classifier. However developing a classifier model for detecting faces is comparatively easy since various notable featuresandpatternsareenclosedbythefacialarea.Thusin theproposedapproachofdetectingandsegregatingoutthe periocular region uses firstly the detection of face then concentrate on an appropriate region of face suitable for periocularstudy.
1.3
Volume: 09 Issue: 02 | Feb 2022 www.irjet.net p-ISSN: 2395-0072
1.2 How the features are extracted?
SecondstepistospecifytheROIwithinthepositiveimages. For this paper, the ROI is the facial region around which a box is drawn. Basically, the starting coordinate of the box boundingthefaceanditsheightandwidtharestoredwhile specifyingtheROIs.Theseparametersarelaterusedduring thefeatureextractionprocess.
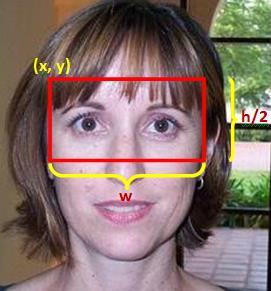
Sincethefacegetsdetected attheinitialstep,aboxbounds the facial region. The periocular region exists in the upper portion of the face. If the height of the bounding box is reduced to half, the upper half will give the periocular
© 2022, IRJET | Impact Factor value: 7.529 | ISO 9001:2008 Certified Journal | Page1038
International Research Journal of Engineering and Technology (IRJET) e-ISSN: 2395-0056
Volume: 09 Issue: 02 | Feb 2022 www.irjet.net p-ISSN: 2395-0072
3. PROPOSED APPROACH
3.1.2 Howto detect periocular region from detected faces?
Many works have already been done for identifying and detecting the periocular region [12] [13] [14] [15] [16].
3.1 Classification Procedure 3.1.1 Howto detect faces?
After feature extraction, SVM learning algorithm is applied totrainthedataforclassification.
The notable features are extracted from the ROI region using HOG descriptor, which are fed to the training model.
RELATED WORKS
Various studies have been performed on predicting drowsinessfromtheeyecontour[ref].Theyawninghasalso been detected from contouring the mouth area [ref]. But most of these studies incorporate the opening and closing patternoftheeyesandassumethestateofdrowsinessifthe eyesareclosedformorethansomespecifiedseconds,say4 But5seconds.theissue covered in this paper is not only drowsiness, but also attentiveness. A person may be inattentive even whenhe/sheisactiveornotfeelingsleepy.Fewapproaches to predict human attention are presented in this section though none of the works is based on the attention predictionwiththehelpoftheperiocularregion.
Basically, the approach is to detect the periocular region fromaninitiallydetectedfaces.
Smith et al. [19] have also proposed a system to analyze human driver visual attention. The system operates with one camera and relies on the estimation of global motion along with color statistics to track the head and facial features of a person robustly. The system has made use of eyeblinkingandclosurefeaturesinadditiontotheyawning whichdepictedlargemouthmotion.
The rest of the paper is arranged in the following manner: section 2 throws some light towards the related works which have already been performed in this field. Section 3 explains the approach followed by the validation and accuracy of the approach in section 4. Finally section 5 concludesthepaper mentioning few ofthefuturescopesof theprocess.
Twomajorresearchareasthathavebeenmentionedinthis paper, viz. periocular region and predicting attentiveness, needsomebackgroundsurvey.
Kumaretal.[17]haveanalyzedhowattention,identification and recognition of faces in a crowd can be carried out by segmentation and their relative visual saliency. They have carried out the experiment with gray scale images, consideringintensityasthefundamentalfeature.They have obtained attentiveness of the faces through saliency score andmeasuredtheeffectofsegmentationonrecognitionand Zhongidentification.etal.[18] have proposed an attempt to develop an attention model for face recognition using deep learning technique. The attention model is based on bilinear deep beliefnetworkandtheexperimentiscarriedoutonCMUPI andBioIDfacedatasets.
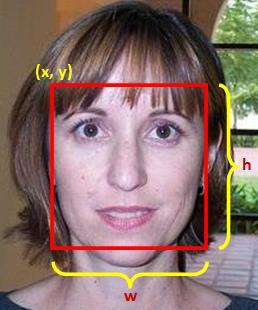
Letregion.x,y, h, w be the four parameters which defines the boundingbox.(x,y)denotesthestartingcornercoordinate. ‘h’ is the height of the box and ‘w’ is the width of the box.
Majority of such approaches include creating a classifier by providing a number of training samples consisting of the periocularregionasthepositivetrainingimages.
Fig 2: Graph depicting hyperplane in SVM.
In the initial step, a set of positive and negative images are collectedorcaptured.Anyimageconsisting ofa visible face canbeconsideredtobeapositiveimage,whereasanyimage withoutafaceactsasanegativeimage.
Upon completion of the training, a pattern gets generated whichhelpsintheclassificationprocess.
2.
Volume: 09 Issue: 02 | Feb 2022 www.irjet.net p-ISSN: 2395-0072
International Research Journal of Engineering and Technology (IRJET) e-ISSN: 2395-0056
Fig 4: Thresholding.
© 2022, IRJET | Impact Factor value: 7.529 | ISO 9001:2008 Certified Journal | Page1039
Keepingthestartingpositionand widthintact,theheightof theboxisreducedtohalf. Box=f(x,y,h,w); Box_half=Box.height/2; wherefisanyspecifiedfunction. Thus,theupperpartofthefaceconsistingoftheperiocular region gets selected. The next set of operations will be carriedoutparticularlyinthisselectedperiocularregion.To maketheprocesseasy,theselectedportionmaybecropped outwhichhoweverisnotmandatory.Itisassumedthatthe selected portion will be consisting of mainly two colors: black and skin color. The part of the visible hair, eyebrows and eyeball will contribute to the black color and the rest will be the skin color. No other color can possibly be involvedasdepictedinfigure3 (a) (b) Fig 3: (a) Box bounding the face. (b) Box bounding the periocular region which also shows possible colors and the validity which will be present in the image.
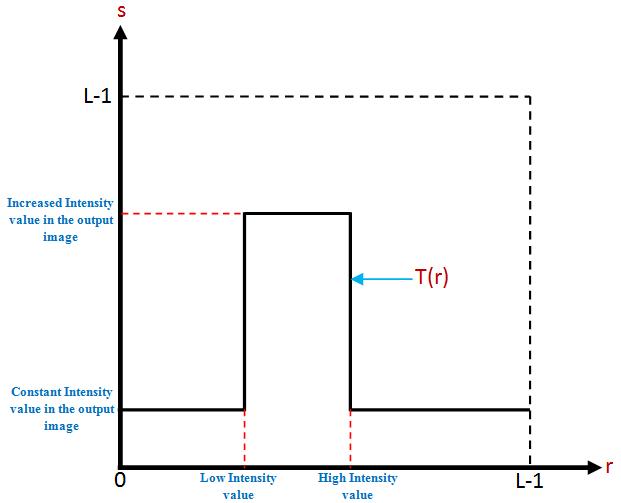
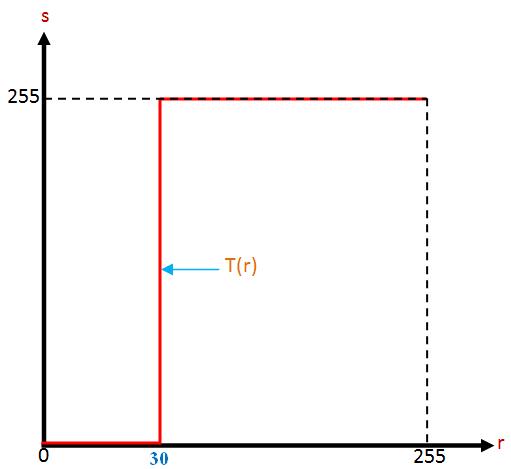
For input intensity values 0 to 255 in the histogram as showninfugure5,therangeconsideredforthisexperiment is [0,30]i.e. to valueis convertedto0 and to are converted to 1. Therefore = =…= =0 and = =…= =255.
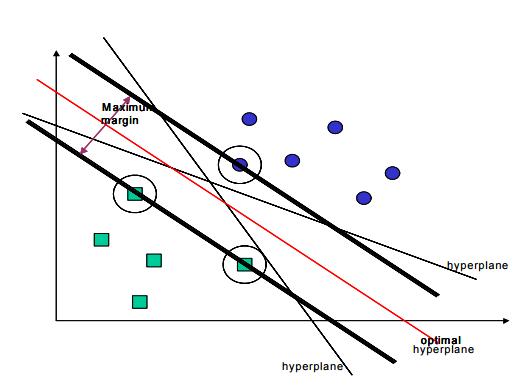
Thebasicoperationsthatwillberequiredarethresholding, segmentation and binarization using various morphological operators. Thresholding (shown in figure 4) refers to selecting a low and a high pixel intensity value or in some cases only a single value based on which segmentation can be done. The intensity of the selected threshold area is increased (or decreased) to a certain level, keeping rest of the intensities constant. The binarization operation is then carriedout.Thisresultsinfillingtheselectedregionwith1’s andtheregionoutsidethethresholdareawith0’s.
Infigure4,ristheinputintensityvaluewhoserangeis[0,L 1] where , n being the number of bits each pixel represents. s is the output intensity value and T(r) is the transformationfunctionwhere. Thes=T(r)area of interest is the eyeballs. Thresholding is done in such a way that only the eyeballs are selected. In practice sole selection of eyeballs through thresholding is not possible.Iftheoriginalimageisconvertedtograyscaleand a histogram is made, eyeballs along with the hair and eyebrowsconstitutethenearblackregion.Thus,ifarangeis chosensuchthatthenearblackregionsfallundertherange and rest of the skin colored part remains outside the mentioned range. Now if this thresholded part is binarized, the near black region getsfilledwith1’sand the rest of the regionbecomes0i.e.black.
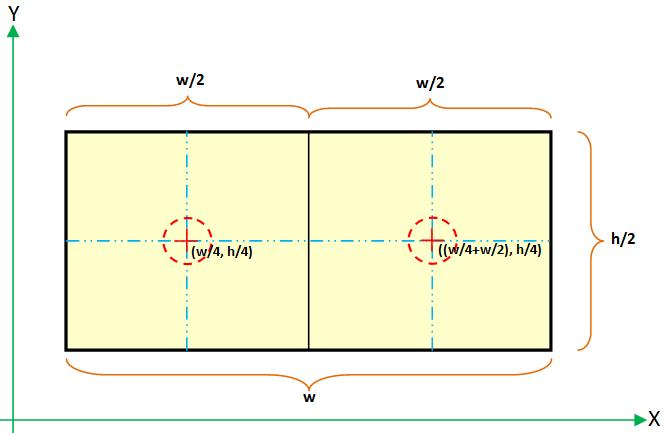
perimeterofacircle= whereristheradiusofthe Areacircle.ofacircle= Circle= The range of the value of ‘circle’ will be within 0 and 1. In this work, a threshold of 0.60 has been chosen i.e. if 0.60<=circle<=1, the centroid of such circular objects are further computed. If in a single periocular region there exists2connectedcomponentswithcentroid,thenthenext step is to check whether the centroids are in the middle portionofeachhalfoftheperiocularregionornot.Forthat the periocular region needs to be divided into further two halves,width wisethistime.
© 2022, IRJET | Impact Factor value: 7.529 | ISO 9001:2008 Certified Journal | Page1040
Firstly the boundaries of the eyeball regions are extractedbyerosionfollowedbysubtraction.
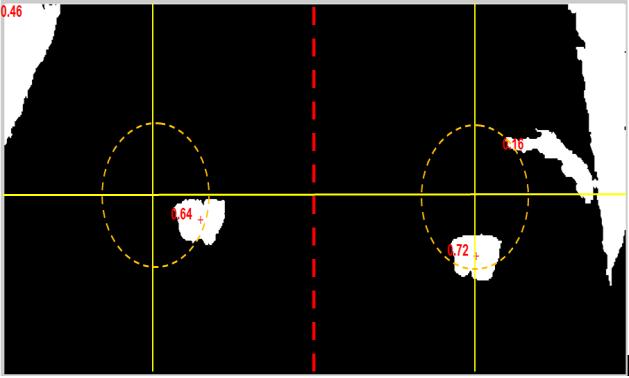
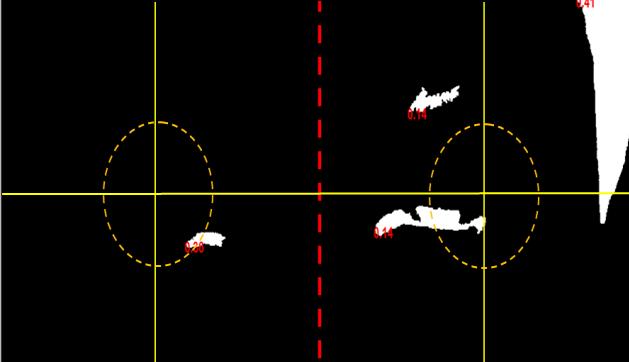
Box_quad=Box_half.width/2; The updated height and width of each box will be h/2 and w/2. There will be two boxes say Box_quad1 and Box_quad2. The midpoints of the two boxes are computed and a range from the midpoint is specified. For this paper, the range is [0, 0.25*(h/2)]. If the eyeballs are found to be located within the specified area, the subject is said to be attentive.Fromthefigure8,midcoordinatesare(w/4,h/2) and ((w/4+w/2), h/2). The area under consideration is the area within the red circular part whose radius is in the range[0,0.25*(h/2)].Forthepersontobeattentive,his/her centroids of the eyeballs must lie within the specified correspondingcirculararea.
Next part is to detect the eyeballs from all other blackish regions. The segregation of the eyeballs from the frame is doneusingthefollowingmorphologicaloperations:
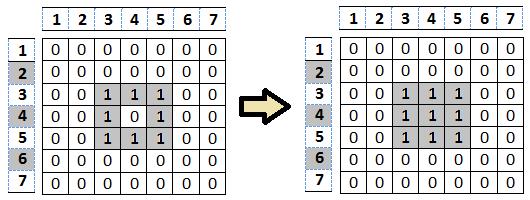
Secondtaskistofilltheholewithintheboundary,shown infigure6.Theequationforregionfillingis: where is the starting point insidetheboundaryandk=1,2,3…the containsallthefilledholes and givesthe filled holesalongwiththeirboundary.
Fig 5: Binarization.
Thefinaltaskistoextractalltheconnectedcomponents in an array form starting with . The equation for the sameisgivenby: Polygonal approximation is done next to capture the essenceoftheboundaryshapeintoapolygonusingtheleast squareerrorlinefitmergingtechnique. Next a filtering operation is done to remove unwanted regions i.e. the eyebrows and hairs. A threshold value for number of pixels is provided. If the connected component consistsofpixelsmorethanthementionedvalue,thenthose componentsarepreserved,discardingtherest.
Volume: 09 Issue: 02 | Feb 2022 www.irjet.net p-ISSN: 2395-0072
International Research Journal of Engineering and Technology (IRJET) e-ISSN: 2395-0056
Fig 6: Hole filling of a connected component.
Nextstepinvolvescomputingtheperimeterandareaofthe connectedcomponents.Perimeterisbasicallythesumofthe boundary pixels of the connected components. After extracting the boundary of the existing connected componentsand storing the valuesinanarray,thenumber of boundary pixels of each connected component are computed, which gives the perimeter. The total number of pixels constituting the boundary along with the pixels withinittogethergivestheareaofthepolygon.
The main aim is to detect the eyeballs, which are near circularobjects.Topredictthelevelofcircularity,arelation between the area and perimeter needs to be established suchthatafullycircularconnectedobjectwillbedenotedby Now1.
Employing this system inside a lecture hall or school classroom can be used as a metric to assess how many students are attentive in the class. Based on the metric of inattentiveness of students, arguably, the course structure or the topic may be modified. If more than half of the students are found to be inattentive, appropriate measures may be initiated to make the topic or the lecture more
For employing the system in case of driver safety an alarm module may be incorporated so that it alerts the driverwheneverhe/shebecomesinattentive.
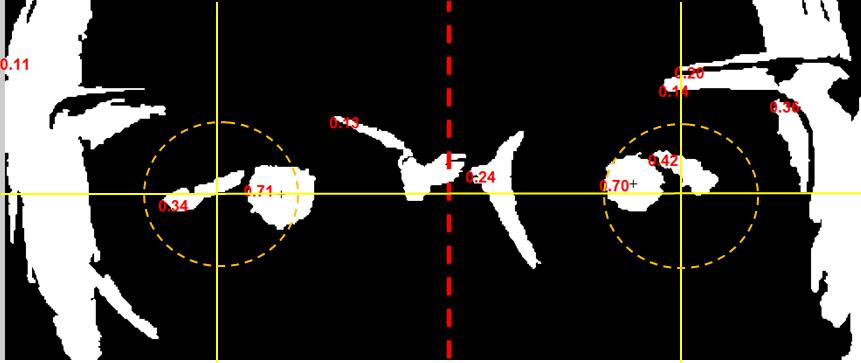
Fig -8: Within the periocular region, the acceptable location of the eyeballs (centroid) is within the red circular area. Forarealtimedataavideofileisconsideredtobetheinput. The video is segregated into number of frames. The above mentioned algorithm is applied over each frame. Since a subjectwillblink,thevalueofcirclewillchangeaccordingly forfewframesalternativelyinaspecificpattern.Ifthevalue of circle does not get back to >=0.60 for say more than 5 seconds i.e. 125 frames, the subject is considered to be inattentive.Somespecialcasesofinattentivenesshavebeen showninfigure13 4.
Insuchacasethewarningmessageinthetextformwill producethecorrespondingspeechformastheoutput.
For employing the system in case of driver safety an alarm module may be incorporated so that it alerts the driverwheneverhe/shebecomesinattentive.
5. EXPERIMENTAL RESULTS
If neither a frontal face nor a non frontal face is detected,thenitwillbetermedas‘not a face’.
6. CONCLUSIONS AND FUTURE SCOPE
In case of implementing the system in a school classroomora lecturehall,thealgorithm isrequiredto detect and label each face. Thus, if a student is inattentive, the system can warn or point to that particularlabeledperson.
EXPERIMENTAL SETUP
Also, an advanced version of the system is connecting the system with the brakes of the vehicle so that it can slow down in case the driver is inattentive for a long periodoftime.
This approach of detecting the periocular region and incorporating it to find out the attentiveness of any face in real time has been presented in this paper. The approach yielded85%accuracywith33.33%offalsepositiverate.
Anotherinteresting.important area of application for such a method will be in the transport industry. Whether a driver is attentively driving or is feeling drowsy or is looking at somewhere elsecan befoundout usingthistool.A number ofexpensivesystemsareavailablewhichrequirethewhole face for proper assessment. The process of extracting features from the whole face is computationally expensive when compared with the periocular region for the same purpose.
International Research Journal of Engineering and Technology (IRJET) e-ISSN: 2395-0056
The preliminary hardware setup that incorporated the above proposed approach consists of an external camera, a display unit and a motherboard. The camera grabs the live videoofascenewhichisfedasaninputtothesystem.Video is nothing but a collection of frames. The above mentioned algorithmisappliedovereachframe. Variouspre recordedaudioofwarningmessagesarestored within the system. These messages are played according to the requirement. For instance, if a person is feeling sleepy then no centroids will get detected, hence the message is “The person is feeling drowsy”. Similarly, if a person is looking elsewhere then the message is “The person is inattentive”. 4.1 Few modifications to be incorporated in the setup as a part of the future work of this research Instead of playing a pre recorded audio, a text to speechmodulemay beincorporated withinthesystem.
Volume: 09 Issue: 02 | Feb 2022 www.irjet.net p-ISSN: 2395-0072
© 2022, IRJET | Impact Factor value: 7.529 | ISO 9001:2008 Certified Journal | Page1041
The above approach is tested over few sample images and theoverallaccuracyrateisfoundtobe85%with33.33%of false positive rate. Some results have been displayed in figure11 14. Also, to optimize the computation cost, few steps are followed: Ifa non frontal faceisdetected,thereisno needtorun thealgorithmfordetectingtheperiocularregionasitis clearthatthesubjectisnotattentive.
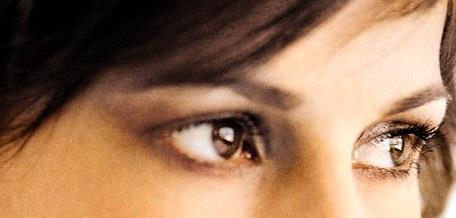
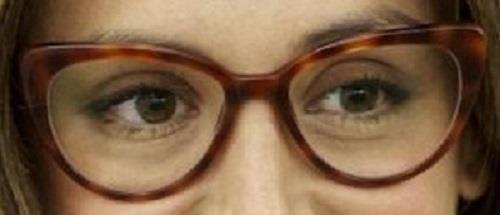
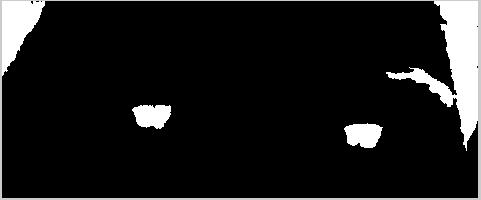
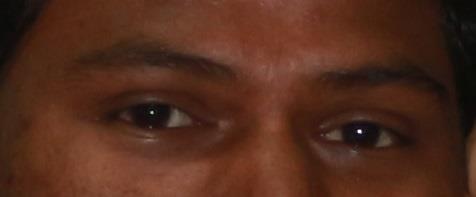
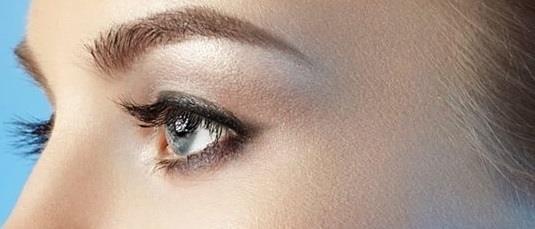
International Research Journal of Engineering and Technology (IRJET) e-ISSN: 2395-0056 Volume: 09 Issue: 02 | Feb 2022 www.irjet.net p-ISSN: 2395-0072 © 2022, IRJET | Impact Factor value: 7.529 | ISO 9001:2008 Certified Journal | Page1042 Therefore,theproposedresearchpossessesahugescopeof applicationandimplementationinmanyareas. Fig 9: Periocular region of attentive subject. Fig 10: Result of thresholding and binarization. Fig 11: Filling the holes within the connected components. Fig 12: Detection of the eyeballs (centroid) which is situated within the specified boundary. Fig -13: Periocular region of attentive subject with spectacles also satisfies the conditions of attentiveness. (a) (b)
[9] Guo, Zhenhua, Lei Zhang, and David Zhang. "A completed modeling of local binary pattern operator fortextureclassification."IEEETransactionsonImage Processing19.6(2010):1657 1663.
[12] Bakshi, Sambit, Pankaj K. Sa, and Banshidhar Majhi. "Optimized periocular template selection for human recognition." BioMed research international 2013 (2013).
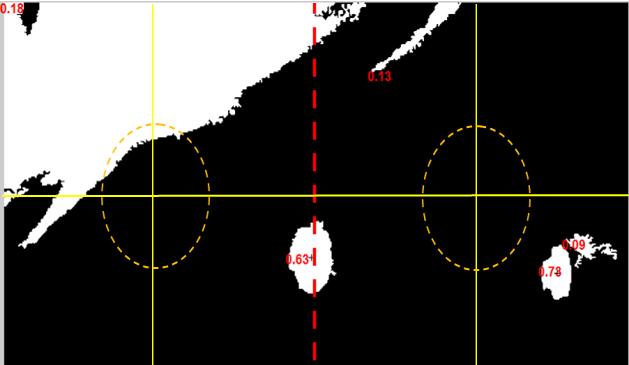
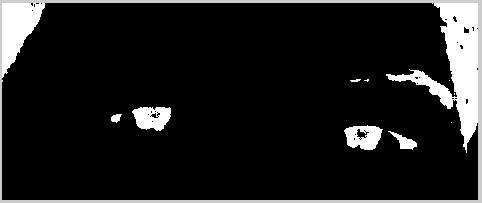
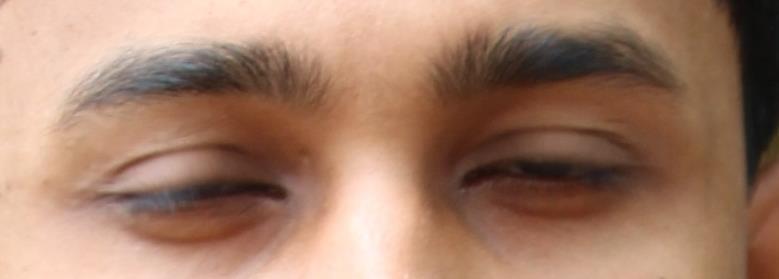
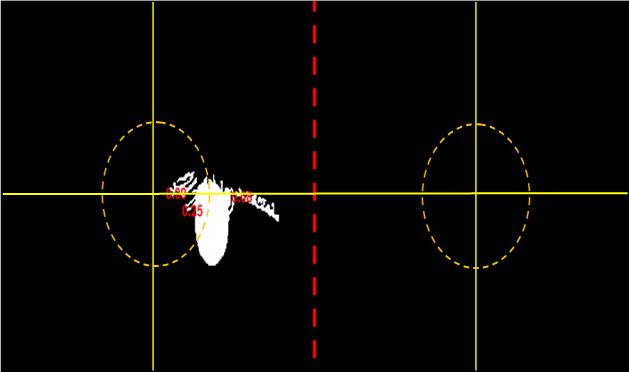
Volume: 09 Issue: 02 | Feb 2022 www.irjet.net p-ISSN: 2395-0072 © 2022, IRJET | Impact Factor value: 7.529 | ISO 9001:2008 Certified Journal | Page1043 (c) (d) (e) (f) Fig -14: (a), (c) & (e) show that the subject is inattentive. (b), (d) & (f) show their corresponding eyeball detection which fails the acceptance test.
International Research Journal of Engineering and Technology (IRJET) e-ISSN: 2395-0056
[8] Dalal, Navneet, and Bill Triggs. "Histograms of oriented gradients for human detection."Computer Vision and Pattern Recognition, 2005. CVPR 2005. IEEE Computer Society Conference on. Vol. 1. IEEE, 2005.
[1] Bharadwaj, Samarth, et al. "Periocular biometrics: When iris recognition fails." Biometrics: Theory Applications and Systems (BTAS), 2010 Fourth IEEE InternationalConferenceon.IEEE,2010.
[6] DavidG.Lowe,“DistinctiveImageFeaturesfromScale Invariant Keypoints”, International Journal of ComputerVision,January5,2004.
[4] Lyle,JamieR.,etal."Softbiometricclassificationusing periocular region features." Biometrics: Theory Applications and Systems (BTAS), 2010 Fourth IEEE InternationalConferenceon.IEEE,2010.
[7] Jacob Toft Pedersen, “Study group SURF: Feature detection&description”,SURF:FEATUREDETECTION &DESCRIPTION,Q42011.
[3] Merkow, Jameson, Brendan Jou, and Marios Savvides. "Anexplorationofgenderidentificationusingonlythe periocular region." Biometrics: Theory Applications Systemsand (BTAS), 2010 Fourth IEEE International Conferenceon.IEEE,2010.
[5] Somajyoti Majumder, “Sensor Fusion and Feature Based Navigation for Subsea Robots”, The University ofSydney,August2001.
[13] Ambika D R, Radhika K R, D Seshachalam, AN Exploration Of Periocular Region With Reduced
REFERENCES
[10] Cunningham, Pádraig, Matthieu Cord, and Sarah Jane Delany. "Supervised learning."Machine learning techniquesformultimedia.SpringerBerlinHeidelberg, 2008.21 49. [11] Kotsiantis, Sotiris B., I. Zaharakis, and P. Pintelas. "Supervised machine learning: A review of classificationtechniques."(2007):3 24.
[2] Juefei Xu, Felix, et al. "Investigating age invariant face recognition based on periocular biometrics." Biometrics(IJCB),2011InternationalJointConference on.IEEE,2011.
Volume: 09 Issue: 02 | Feb 2022 www.irjet.net p-ISSN: 2395-0072
[17] Kumar, Ravi Kant, et al. "Analysis of Attention Identification and Recognition of Faces through Segmentation and Relative Visual Saliency (SRVS)."Procedia Computer Science54 (2015): 756 763.
© 2022, IRJET | Impact Factor value: 7.529 | ISO 9001:2008 Certified Journal | Page1044
[14] C. N. Padole and H. Proenca, "Periocular recognition: Analysis of performance degradation factors," 2012 5th IAPR International Conference on Biometrics (ICB),NewDelhi,2012,pp.439 445.
[16] K. P. Hollingsworth, S. S. Darnell, P. E. Miller, D. L. Woodard, K. W. Bowyer and P. J. Flynn, "Human and MachinePerformanceonPeriocularBiometricsUnder Near Infrared Light and Visible Light," in IEEE Transactions on Information Forensics and Security, vol.7,no.2,pp.588 601,April2012.
BIOGRAPHIES Mouli Laha has completed her B.TechinCSEfromWBUT(2014). She worked as a Research Fellow atCSIR CMERIundertheMinistry ofScience,GovernmentofIndia. She pursued her M.Tech in CSE fromIIT(ISM),Dhanbad(2018). She has qualified GATE in 2014 and 2018 & UGC NET in 2018. Currently, she is serving at National Informatics Centre underMinistryofElectronicsand Information Technology, GovernmentofIndia.

International Research Journal of Engineering and Technology (IRJET) e-ISSN: 2395-0056
[19] Smith, Paul, Mubarak Shah, and Niels da Vitoria Lobo. "Determining driver visual attention with one camera."IEEE transactions on intelligent transportationsystems4.4(2003):205 218.
[18] Zhong, Sheng hua, et al. "Attention Modeling for Face RecognitionviaDeepLearning."CogSci.2012.
RegionForAuthentication:RealmOfOccult,JanZizka (Eds) :CCSIT, SIPP, AISC, PDCTA 2013 pp. 241 248, 2013.©CS&IT CSCP2013.
[15] Bharadwaj, Samarth, et al. "Periocular biometrics: When iris recognition fails." Biometrics: Theory Applications and Systems (BTAS), 2010 Fourth IEEE InternationalConferenceon.IEEE,2010.