OPTIMIZATION IN MES BY IMPLEMENTING SMART ANDON SYSTEM FOR PRODUCTIVITY ENHANCEMENT
1.1 Background TATAMotorsLtd.(PVBU),Chikhli,Puneistheautomobile
1.2 Andon Meaning, History, Benefits in lean manufacturing
2Assistant Professor, Dept. of Mechanical Engineering, Government College of Engineering, Karad, Maharashtra ***
Mr. Preetam Patil1, Prof. G. S. Dhende2
International Research Journal of Engineering and Technology (IRJET) e ISSN: 2395 0056 Volume: 09 Issue: 02 | Feb 2022 www.irjet.net p ISSN: 2395 0072 2022, IRJET | Impact Factor value: 7.529 | ISO 9001:2008

Certified Journal | Page936
Abstract - In today’s manufacturing culture, change has to come to be a consistent. Modern assembly systems have to adapt for products, markets, technologies with regulatory requirements. The assembly lines in industry are undergoing tremendous modifications with efficient process control and the rapid improvement in production by automation, information technology and networking. Variant oriented assembly structures were developed to obtain greater flexibility and adaptableness to feature product variety and variations and scaling production. Therefore we introduce Smart assemblysystemswhereembeddednetworkappliedfor theworkstations andsystem toachievemorecommunication between entities in the system and establish the smart error detection framework which can analyze the reasons behind the errors in various categories with advanced data like frequency of the error and time loss to enhance the productivity. Wherevalueadded implementations inspiredby productivityimprovement techniques in industrialrevolution 2(mass production) withthe digital improvementsatpresent.
©
Key Words: Smart MES, Lean Manufacturing, Smart Andon, OEE, Integrated Control System 1. INTRODUCTION In today’s competitive world enterprise or organizations manufacturinghighquality,defectfreeproductsatoptimum cost. For this organizations adapting new culture for total qualityandproductivitymanagementinthemanufacturing aswellasinadditiontoservicesectorgavebeginningtonew waystoenhancehigh qualityofproducts.Byusingtheuseof varioustoolsofTQM.InIndia,AutomobileIndustryrapidly growing, developing to increase productivity in both commercial and passenger vehicle segment. As per the customer demands for high product variety lead a higher degreeofindividualizationandincreasecompetitionamong manufacturerswhichfavornewdevelopmentslikesuitable assemblyline,fitmentstations,andsub assemblystations. Well establishedassemblylinesneedtobeadaptchangesto enhance the productivity. Production planning process is most important factor in the manufacturing industry. Assembly line is plays important role in the production planningandprocess.Assemblylinesaredesignedtobecost efficientandsuitableformassproductionthatuseshighly specializedworkflowanalysis.Wherethenumberofvariants require flexible method for the assembly process which means to make assembly line more proactive by reducing the downtime of the assembly lines. It can be possible by enhancement in the error detection system as well as enhancingtheresponsetothedefectorerroroccurred.
data.softwareleadsthroughishift.andsegmenteddowntimeimplementingdefectmanufacturingShopplatformdevelopingmanufacturingplantforpassengervehiclesegmentcurrentlyreferencearchitecturebaseforIndustry4.0.AspertheRAMI4.0inTCF(TrimChassisFitment)wheretheworkdonebyadaptingdigitalizationfortheexecutionsystemwithensuringthezeroanderroranalysisframeworkdevelopmentwithrootcauseforerrorsoccurringtoreduceinproduction.PreviousAndonsystemhadsevenLEDdisplayonlyshowingsimpledatalikeactualtargetproductionalongwithtotaldowntimeforthePullcordsignals,DCtoolinterlocks,Auditcheckstationnterlocks,breakdownalertsandsafetylocksintegratedPLCforframeworkdevelopmentforIIOTwhichtodataacquisitionofthesystembyusingRSLinksfordatatransferPLCtotheExcel.Thisgathered
The operator to hold the production process on assembly line if there any quality issue or breakdown arises and assistanceisneeded.Theandonsystemisasetofpull cords orbuttons,lights,hooterlapsandandonboardsinstalledin assembly lines. If the operator stops the assembly line by activationofpullcordthenlightgetsturnonathisstation whichindicatethesupervisorwhichprocessisresponsible forthestoppage.Thesupervisorthengoesimmediatelyto that workstation to investigate the problem and take necessary corrective action in order to start the assembly line. The andon system includes a means to pause productionsothattheissuecanbesolved.Itisleanmethod that is widely adopted in manufacturing development for detectionandremovaloferrors.
Inmanufacturingindustry,andonsystemintroducedinmid part of 20th century about end of the World War2 which largely accepted by automobile industries in Japan. The commercial concept was to allow the operators or supervisors to suspend the production if there are any quality or safety issues. It is introduced as part of Jidoka QualityControlmethodwhichtakenbyToyotaasthepartof ToyotaProductionSystemfromthenitisapartoftheLean
1M.Tech Scholar, Dept. of Mechanical Engineering, Government College of Engineering, Karad, Maharashtra
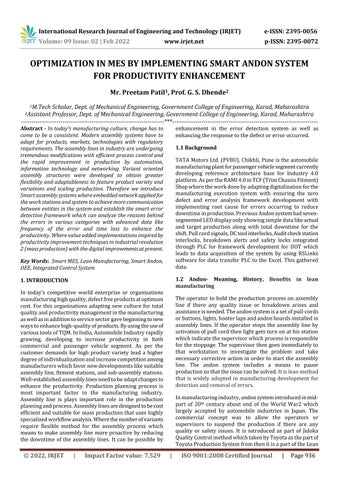
(d) Andoncodechartsheet
International Research Journal of Engineering and Technology (IRJET) e ISSN: 2395 0056 Volume: 09 Issue: 02 | Feb 2022 www.irjet.net p ISSN: 2395 0072 © 2022, IRJET | Impact Factor value: 7.529 | ISO 9001:2008
Certified Journal | Page937
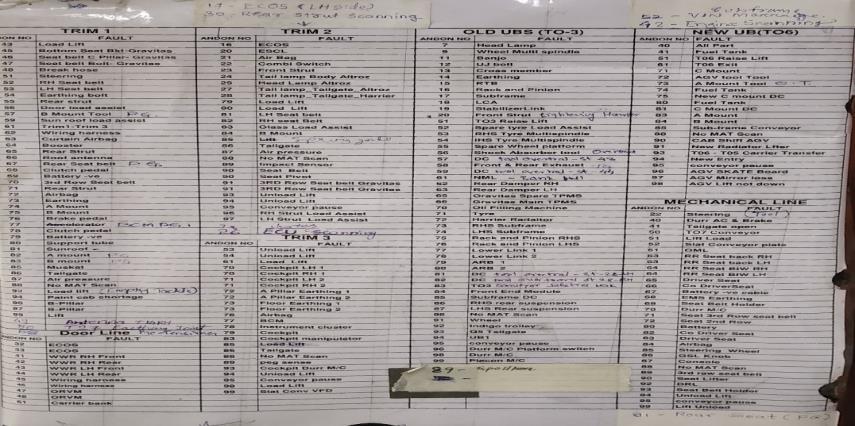
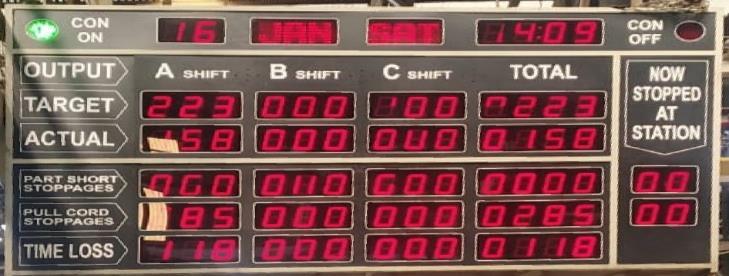
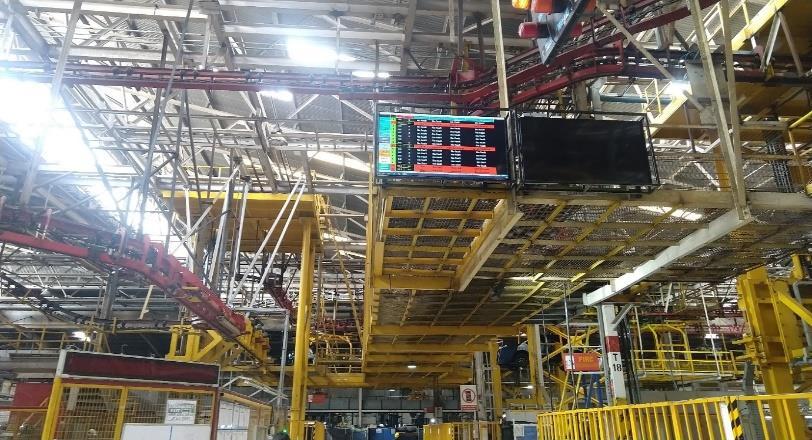
Fig.1: OldAndonDashboard
As the no. of stations in the shop and the no. of errors in operationscanbeseentherefore tosimplifythisnumbers are used for displaying error occurrence on the Andon dashboard and supervisor use the chart displayed at monitoringsystemtoidentifytheoperationwheretheerror occurredandtakeremedialactiononit.Everyassemblyline haveLEDdisplaywherelineengineerandteamleaderscan
ProductionApproach.Theconceptofandonsystemandthis techniquemainlyattributedtoWilliamEdwardsDeming,an American engineer who worked on betterment in mass production along with quality product with most of the Japanesemanufacturersin1950’s
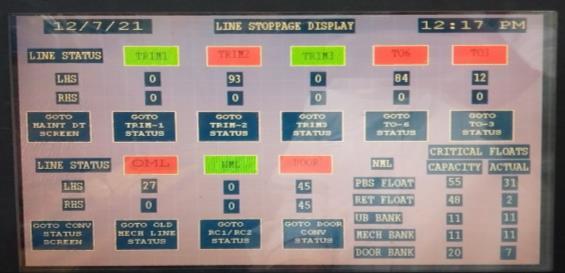
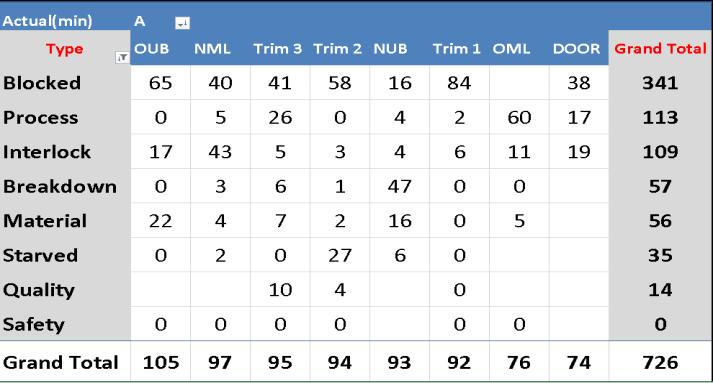
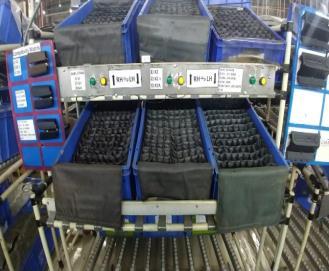
InTCFShoptherearetotal178operatingstationsinmain8 assemblylineswherealllinesareinseriesforproduction.At everystationtherearetwopullcordstostoptheassembly lineatthatstation,oneisforifthematerialisshortorwrong andsecondoneisforiftheoperationisincomplete.Alsothe systemconsistofautomaticstoppingforconveyors,liftsby the safety means or the wrong operation performed or incompleteoperationbyoperatorbyDCtorquetoolsatthe workstations. Previous in use andon system have seven segmentLEDdisplayforandondashboardwhereitconsist ofinformationaboutactualandtargetedproduction,total partshortstoppages,pullcordstoppagesandtimeloss(in minutes)aspershiftA,B&C.
(a) MainAndonDashboard
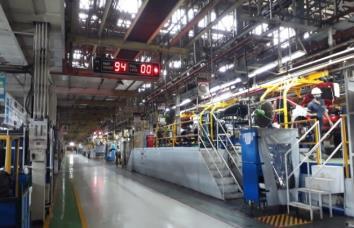
(b) AndonBoardatassemblylineatTCFShop
In the long term, it provides benefits as: a. Enhancethequalityofproductsinmanufacturing b. Responsibleoperatorswhoareaccountableforthe line running as efficiently and effectively as possible,empoweringthemtoactwhenproblems arise,ratherthanwaitingformanagement c. Reducethecostanddowntimebyerroranalysis d. Longtermimprovementsforproductionprocess.
1.3 Andon System at TCF Shop in Tata Motors
Atfirstandonsystemdevelopedandusedinindustrywas simple light that indicate supervisor to signal line status based on colours. Nowadays, more sophisticated and complicated visual displays are often used in the Andon system.ApartfromAndonlightstheAndonsystemnormally also include an Andon board which has the purpose of distributing other key information regarding the manufacturingstatuswhichtheAndonlightcannotprovide. According to Lean Manufacturing Andon is an effective communicationtool. Benefitsinleanmanufacturingbyusingandonsystem: Andonsystemprovidesbothshortandlongtermbenefitsin manufacturingwhichdirectlyimprovestheproductivityof theshop. In the short term, it provides benefits as: a. Visibility as well as transparency in the manufacturingprocesses b. Reduceinthewaste c. Increaseintheproductivityandoverallefficiency
(c) HMIdisplay:LineStoppage
Page
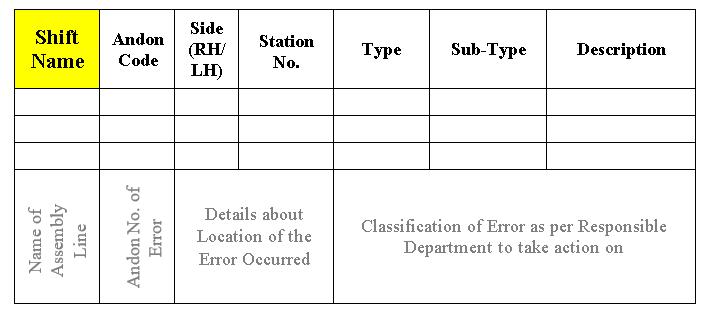
Table -1: SheetpreparationforDataCollection
As per current scenario organization looking for improvement in the production system by tracking the assemblyoperationprocessforenhancementinproductivity with maintaining quality of product. This can be done by optimizingtheoperationprocesswhichmeansbyreducing thedowntimeoftheassemblyline.Forreducingdowntime erroranalysisframeworkrequiredwhichcontainsrealtime errordetectionwithdetailedinformationoferror,whichcan be achieved by development of Andon system and optimization in error classification along with data acquisition where error classified in different categories, type of error, sub type, location of the error with reason alongwiththefrequencyoftheerrorandthetimelossfor particularerror.Byanalyzingthatdataitispossibletotake remedialactions.
Inexcelasperrequirementdigitaldashboardsdevelopedby gathereddata,forthisfirstdatasheetpreparedconsidering all andon codes as per the assembly lines with their respectiveoccurringlocations,reasonofoccurrence,those errors are categorized into several types as responsible departmentwhichhavetotakeactionon.Alsoforsupportive
Need for Andon improvement
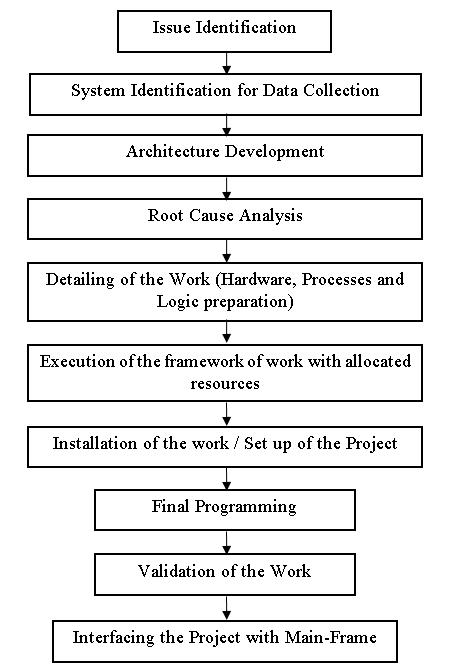
Theflowchartrepresentsthemethodologyflowchartand steps followed to complete this project. At first the observationhavetobedoneforproblemsinassemblyline, kittingarea,logisticsandoverallworkingbackgroundinTCF Shop for issue identification. As per the observations and checkingoldsystemandsoftwarefeasibilitytoadaptdesired changes for development after identifying issues. Then as perourrequirementforrealtimeerrordetectionanddata analysis system, architecture has to be develop by data acquisitionfromPLCsystemtoexcel.Bycollectingdatafrom newly developed architecture, have to find operations in whichfrequencyoferrorishighandoperationswhichhave hugedowntime.Afterfindingthose,rootcauseanalysishave to be done to reduce or eliminate the error by taking remedialactionsbyapplyingvariousleantechniqueswhich developedinearlyyearsof19thcenturyformassproduction and quality management with today’s digital automation technology which leads to reduction in downtime and frequencyoftheerror.
seetheAndonNo.iftheconveyorstoppedbyanyerroror externalissue.
Fig.2: FlowchartoftheMethodology
2. SMART ANDON DASHBOARD DEVELOPMENT
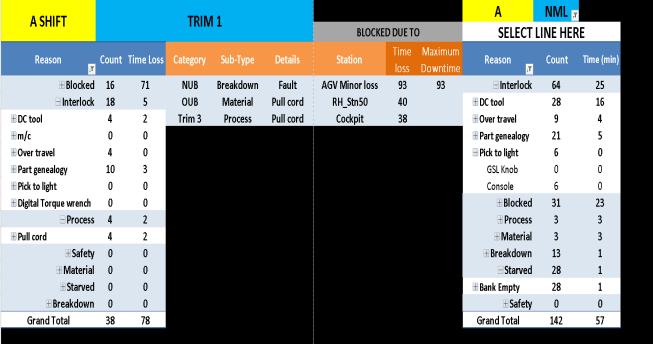
Also for detailed real time data analysis operational dashboards and made which contains station wise classification of data about error occurred in a particular shift.Bywhichremedialactionplancanbemadetoenhance assemblyline.
Theerrorsorissuescategorizedas:
I. Material: Errorindicatingshortageofthepart/partsinassemblyline.
II. Breakdown: Errorindicatingfunctionfailureofatoolinassemblylineor malfunctionorconveyororliftoranyequipment.
interactiondetaileddataanalysistypesagaindifferentiated intosub categoriesorsub types.Forlivetrackingaserror occurredinanyassemblylineoninformationaldashboard the andon code displayed along with the reason of error, location,frequencyofoccurrenceofparticularerrorwiththe exactdowntimeduetothaterror.
International Research Journal of Engineering and Technology (IRJET) e ISSN: 2395 0056 Volume: 09 Issue: 02 | Feb 2022 www.irjet.net p ISSN: 2395 0072 © 2022, IRJET | Impact Factor value: 7.529 | ISO 9001:2008 Certified Journal | 938
1.4
VI. Interlock: Errorindicatingincompleteoperation,wrongoperationat semi automatic tools and critical stations which directly affectsqualityandsafetyoftheproduct.Itisthemechanism whichpreventsundesiredoperationsaspreventingmachine harming operators or damaging itself by preventing one element from changing its state. For this assembly lines conveyorstoppagetreatedaspreventiveelement. Sub typesareas: a. DCtools b. OverTravel c. PartGenealogy d. Picktolight e. Machines VII. Quality: Itindicatestheconveyorstoppage attheauditstations as defectfoundinthepartialassembledbody.Itcanbewrong partassembled,faultypartoranyobserveddefectinfitment inqualityinspectiononlineside.
V. Blocked: Indication for Conveyor stopped of moving assembly line due to inability to send partial assembled body in next assemblylineasnextlinefilledwithmaximumcapacityand stopped.
International Research Journal of Engineering and Technology (IRJET) e ISSN: 2395 0056 Volume: 09 Issue: 02 | Feb 2022 www.irjet.net p ISSN: 2395 0072 © 2022, IRJET | Impact Factor value: 7.529 | ISO 9001:2008 Certified Journal | Page939
(b)Down timedataanalysisdashboardassemblylines
III. Process: Errorindicatingdelayinoperationbyoperatorbypullcord stoppages.
(a)ErrorDetectionliveAndonDashboard
VIII. Safety: Indicationforassemblylinestoppageduetosafetyprotocol notbeenfollowedatriskyoperationsormaintenancewhile Forbreakdown.constant monitoring of the operations and error occurrence Operational dashboard is developed which mainlyfocusedonactivitiesthatareconstantlychangingand mightrequireattentionandresponsetoresolveerror.This dashboard displays live data from PLC also stored for countingfrequencyofparticularerroranddowntimedueto thaterror. Alongwiththeself diagnosticerrordetectionAndonsystem for betterment in production and reducing those error analysisofoccurrederrorsisrequired,thereforeanalytical dashboarddevelopedbyexceltoolsbyusinggathereddata which acquired by PLC for individual assembly lines for detailedanalysisandcollectiveanalysisofallassemblylines forinterdependencyandforfindingrootcausefordowntime in Asproduction.showninFigure
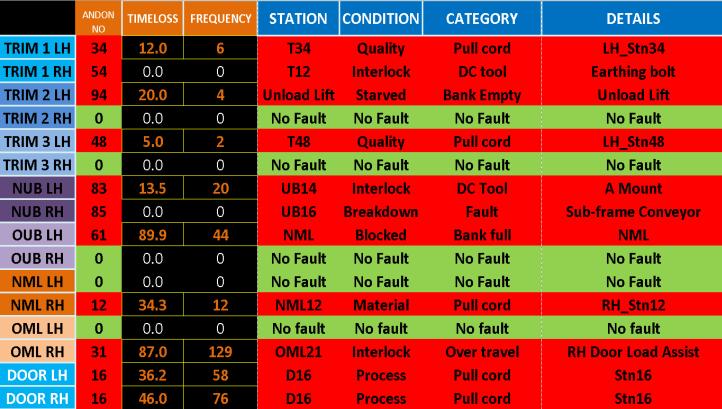
belowdevelopedlivedashboardtracks real time errors and displays stoppages in conveyors in differentassemblylinesdueerroroccurrencewithdetailed descriptionabouterror.Whichhelpstoinstructtheperson who’sresponsibletotakeactiononwhichreducesthetime forresolutionoferror.
IV. Starved: Indication for Conveyor stopped of moving assembly line duetonotreceivedpartialassembledbodyfromprevious assemblyline.
International Research Journal of Engineering and Technology (IRJET) e ISSN: 2395 0056 Volume: 09 Issue: 02 | Feb 2022 www.irjet.net p ISSN: 2395 0072 © 2022, IRJET | Impact Factor value: 7.529 | ISO 9001:2008 Certified Journal | Page940
(f)DataacquisitionfromPLCtoExcelSheet
(e)
5. Itdoesnothavesuchtype ofdashboards. New andon system consist line wise analytical dashboards for categorizationoferrorsand calculating downtime and frequency.
Productivityenhancementcanbeachievedby‘TimeStudy’ which also called as work measurement technique which essential for betterment in both planning and controlling operations.ByA.B.Segur,“Timerequiredforallexpertsto perform the fundamental motions (processes of work) is constant”. Where as per the British Standard Institute the time study is defined as, “The application of techniques designedtoestablishtimeforqualifiedworkertocarryouta specifiedjobatadefinedlevelofperformance”.
(d) causeanalysis fordowntime Line classificationdashboard
As per root cause detected by system feasibility has been checkedforeliminationoferrorsorreducingitsfrequency.
4. No local (Shop floor) system which provides realtimeanalysisfortime loss Excel based system which provides real timeanalysis fortimelosswithhistorical data
wiseerror
Table 2: ComparisonbetweenoldAndonsystemandnew Andonsystem No.Sr. Old Andon System New Smart AndonSystem
2. It is traditional type of andon system having seven segment LED screen as information dashboard. It is digital andon system consist of digital LED displayasadashboardwith detailedinformation.
Root
AsshowninFigureanalyticalandoperationaldashboards developed for tracking the error occurred as per data acquisition sheet by using excel tools as pivot table, V lookup, add in counter, timer along with formulation calculationinexcel.


3. COMPARISON BETWEEN OLD ANDON SYSTEM AND NEW ANDON SYSTEM
1. In old andon system stoppages due to quality wasn’tincluded. All type of stoppages are included in new andon system along with respectivereasons.
Dataanalysisdashboardby

(c) types
dashboard
oferrors
Fig.3: Analytical&OperationalAndonDashboards
3. Old andon system only used for error detection forrealtime. Newandonsystemcapable oferrordetectionaswellas it shows detailed descriptionfortheerror.
6. Main dashboard only shows target production andtheactualproduction withtotaltimelossforthe shift. This system can arrange rootcauseforthetimeloss intheshifttotakeremedial actions for reducing downtime.
4. TECHNIQUES USED FOR PRODUCTIVITY ENHANCEMENT
Therearetwomajorcontributionsortechniqueswhichused in industry for productivity enhancement are Taylor’s methodandGilbreth’smethod.
Taylor’smethodisthemethodinwhichmainlyfocusedfor achievingefficiencyinproductionthroughthequicknessof theoperationbeingdone.Itismethodtoreduceoperation time by completing steps in the operation less time by trainingtheoperatorforthetaskbyscientifictimestudies.
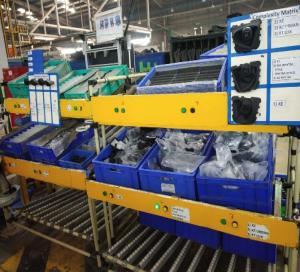
Smart Part Complexity Management is achieved by Order Processing System, where it is the process or work flow associated to the picking, packing and transport of the packedgadgetstoassemblylineandisakeydetailoforder achievement. Which can possible by using Pick to light system at kitting Area and Assembly line side, where for kittingareatheoperatorhavetoscanthebarrelcodeofthe variantwhichisgeneratedbyMESsystemforthedetection for the parts needed in kitting area and after picking the partshavetogiveconfirmationfeedbackbypressingpush button. As for line side Pick to light integrated with the conveyorsystemwherepartsofdifferentvariantsorganized
1. As per feedback given by experts in department of Quality, Maintenance and Operations some modifications proposed and made for maintaining quality by zero defect in operations introducing part pickingtechniquesforoperatorsinassemblylineaswell asforkittinglineforpartcomplexitymanagement.
2. Auditcheckpointdividedwithassemblylinestoreduce responsetimeforreassemblyandfitmentfordefective parts.
International Research Journal of Engineering and Technology (IRJET) e ISSN: 2395 0056 Volume: 09 Issue: 02 | Feb 2022 www.irjet.net p ISSN: 2395 0072 © 2022, IRJET | Impact Factor value: 7.529 | ISO 9001:2008 Certified Journal | 941
4.2 Part Complexity Management
About10to13%ofpartialassembledbodygoesforrework at audit point due to wrong parts, as different variants of sameproducthavehugeverityincolour code,designand featureswhichresultstowrongfitmentonbodybyoperator. This complexity can be avoided by introducing picking indicationsystemfortheoperatorswherepartcomplexity managementrequired.
4.1 Value added Implementations for Downtime Reduction
Where Gilbreth’s method which focused on reducing the number of motions for the operation by eliminating unnecessarystepsintheoperationprocessormotionofthe operator in the process by scientific motion studies. As Taylor was focused on reducing process time, where Gilbreth tried to make the overall process more efficient. Gilbreth’s approach for productivity enhancement is concernedwithqualityimprovementandworker’swelfare where in Taylorism workers are less relevant than the profitsbyincreaseinproductivity
Itisplannedaspreventivemeasureformajorbreakdownof heavymachinerysuchasmotorsofthebeltconveyors,lifts and chain conveyors. Where power consumption and parameters like actual current, voltage are driven from equipmentlikemotordriveandsmartenergymetertothe systemfordataformationforconditionmonitoring.
3. Alsobydigitalizationandautomationintroducedinthe manufacturing processes with reference to Gilbreth’s Therbling manual supervising replaced with the feedback looping for the operations where time loss mightbeduetoworkdelaybyoperator.Wherehooters addedinassemblylinesatthoseoperationswhichgets activated if operator not started operation till half operationtimepassed.
4.3 Feedback Looping
5. OBSERVATIONS
4.4 Energy Management
Fig.4: Pick to lightSystematlinesideandkittingarea
Asperthegathereddatafromthesmartandonsystemthe feasibilitycheckedforenhancementtheprocesswithminor change in the sequence of the operations, training to the operatororintroducingnewoperationalwayforparticular operation.
(1)button. (2) (3) (4)
WithreferencetotheGilbreth’sTherbling,hootersaddedin assemblylinestomoderatetheactivitieswhichlinkedwith PLC System as tools, scanners, etc. of operators while workingcondition,asifoperatorhaven’tstartedworkingtill half of operation time passed away then hooters get activatedwhichnotifiesthesupervisorandtheteamleader ofassemblyline.Bythisautomatedsystemlookingafterthe operatorsisreducedandnecessaryworkinggetsmoretime. Alsoitreducedthefrequencyoftheoperationdelaybythe operatorswhichdirectlyaffectasreduceindowntime.
whereLEDlampisattachedfordifferentpartsofvariantsof the product. And specific lamp gets turn on for specific variant when variant enters in process zone and after picking the parts have to give confirmation feedback by pressingpush
Page
5.1 Investigation for reduction in downtime as per feasibility Byfieldsurveyin TCF Shop erroroccurredarrangedwith respectivefrequencyofoccurrenceasperpriorityorderto reduce downtime and frequency for all stations. Priority decidedbyoperationhavinghighdowntime,highfrequency ofoccurrenceandsimplicitytoadaptmodificationswithout disturbing other operations. Work stations chosen for modificationsidentifiedforpossiblerootcauseforerrors.
Table -3: Prioritizedworkstationswithpossiblecauses forerroroccurred
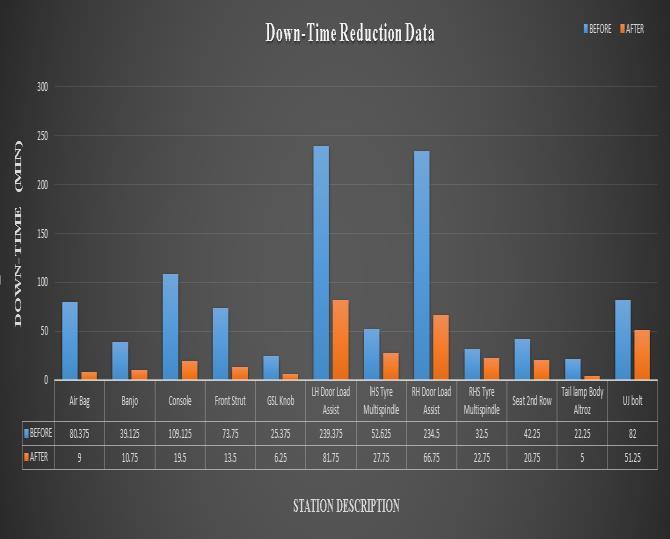
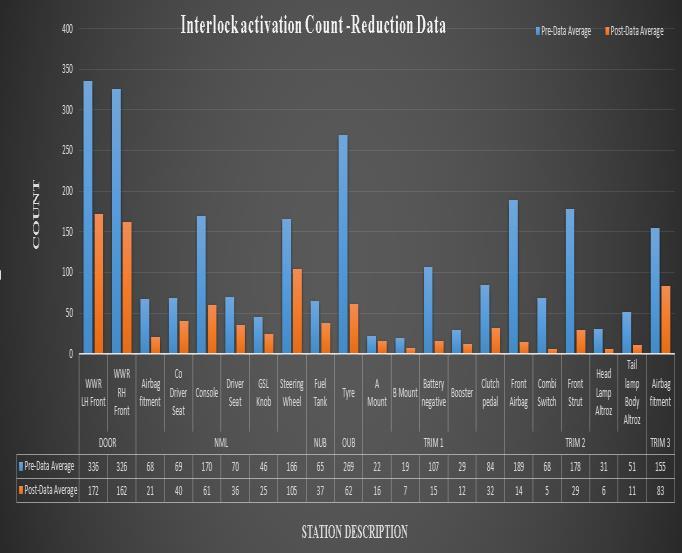
Stationswithhigherdowntimeandfrequencyofinterlock activation selected of remedial actions where the observationsshowningraphsbelow. Fig. 5: Downtimecomparisonbeforeandafter implementation
International Research Journal of Engineering and Technology (IRJET) e ISSN: 2395 0056 Volume: 09 Issue: 02 | Feb 2022 www.irjet.net p ISSN: 2395 0072 © 2022, IRJET | Impact Factor value: 7.529 | ISO 9001:2008
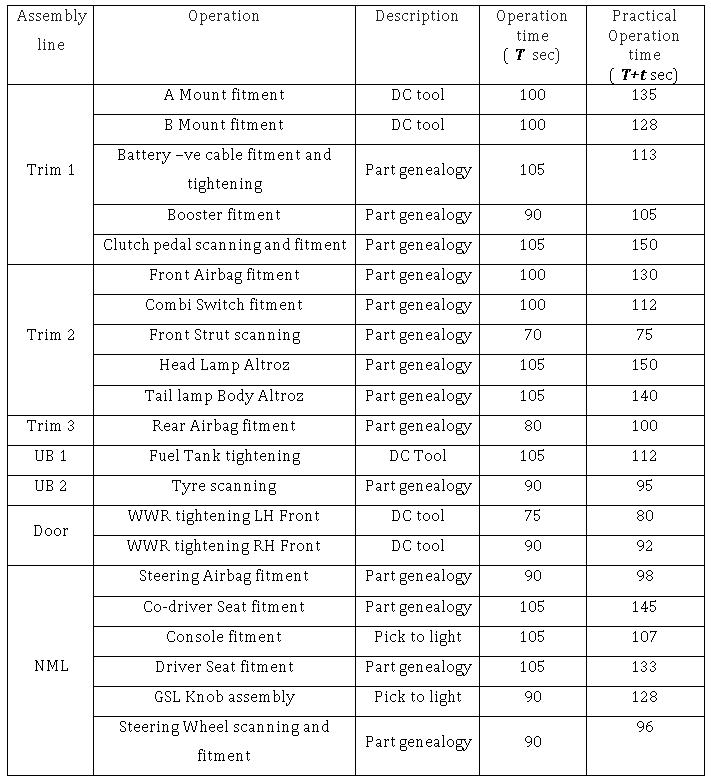
Table -4:Workstationschosenforreducefrequencyof error
Where, T =ActualOperationTime t =TimeDelaybyoperatorduringoperation
Certified Journal | Page942
NetProductiontimeavailable=440min. Targetfortheproduction=250units. Thetotaltimeavailable=450minpershift. ActualProduction(beforeimplementation)=359/2units =180units. ActualProduction(afterimplementation)=411/2units =206units. Efficiency(beforeimplementation)===0.65465.4% Efficiency(afterimplementation)==0.749 =


QuantitativeEfficiency(beforeimplementation)==0.72 =


QuantitativeEfficiency(afterimplementation)==0.824 =


Performance
Performance
International Research Journal of Engineering and Technology (IRJET) e ISSN: 2395 0056 Volume: 09 Issue: 02 | Feb 2022 www.irjet.net p ISSN: 2395 0072 © 2022, IRJET | Impact Factor value: 7.529 | ISO 9001:2008 Certified Journal | Page943 Fig. 6: Comparisonoffrequencyoferroroccurrence comparisonbeforeandafterimplementation Table -5: Pre implementationandPost implementation Productiondata Productiondata NoofUnitsProduced AverageShiftA ShiftAverageB Total Efficiency implementationPre 184 175 359 71.8% implementationPost 216 195 411 82.2% 6. OverallCALCULATIONS:Equipment Effectiveness: Overall Equipment Effectiveness is an indicator for how efficienttheoperationprocessis. OEE=AvailabilityxPerformance efficiency xQuantitative efficiency Availability == Performance efficiency == Quantitative efficiency = = IdealOEE= x x = x x =0.88 IdealOEE=88%
82.4%
74.9%
72%
1. SusanaG.Azevedoa,KannanGovindan,HelenaCarvalho (2011)“Anintegratedmodeltoassesstheleannessand agility of the automotive industry”, Resources, ConservationandRecycling66(2012)85 94
© 2022, IRJET | Impact Factor value: 7.529 | ISO 9001:2008 Certified Journal | 944 station
• Results as per the expectations ensures the proposedarchitecturedevelopmentwhichfurther continued with Industry 4.0 Megaproject in the organization.
• Data transfer to excel through PLC can increase scope of condition monitoring of different appliances with communication to drive & parametermonitoringispossibleoftheappliances.
Page
2. Amir Azizi (2015) “Evaluation Improvement of Production Productivity Performance using Statistical Process Control, Overall Equipment Efficiency, and AutonomousMaintenance”,2ndInternationalMaterials, Industrial,andManufacturingEngineeringConference, MIMEC2015,4 6February2015,BaliIndonesia
4. Patrik Fager , Robin Hanson, Lars Medbo, Mats I. Johansson (2019) “Kit preparation for mixed model assembly Efficiencyimpactofthepickinginformation system”, Computers & Industrial Engineering 129 (2019)169 178
7. CONCLUSIONS
Volume: 09 Issue: 02 | Feb 2022 www.irjet.net p ISSN: 2395 0072
• Audit Check ‘OK’ has been increased by 5 10% which wasrequirementofquality. • TheriseinProductionclearlyseenasforShiftAis13% andforShiftBis09%
• 100%EnergyConsumptiondataforsub stationscanbe moderatethroughMES.
9. REFERENCES
6. YasirShahzada,Huma Javeda,HaleemFarmanb, Jamil Ahmad (2020) “Internet of Energy: Opportunities, applications, architectures and challenges in smart
• Excel Based system to provide real time analysis of time loss with the error detection established and validatedinTCF.
• DevelopmentfortheAlternativeofHMIScreencan be possible through referencing this work as it allowstocustomisationasperrequirementofuser withscopeofdevelopmentwithoutdependency.
International Research Journal of Engineering and Technology (IRJET) e ISSN: 2395 0056
3. Enrico Franza, Felix Erlerb , Tino Langera , Andreas SchlegelaandJohannesStold(2017)“Requirementsand tasks for active energy management systems in automotive industry”, 14th Global Conference on Sustainable Manufacturing, GCSM 3 5 October 2016, Stellenbosch,SouthAfrica,ProcediaManufacturing8( 2017)175 182
Scope for future work
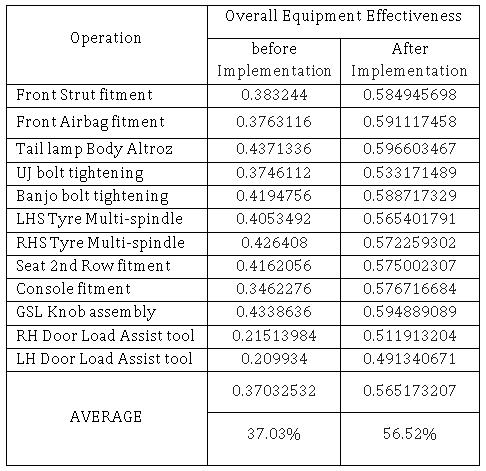
Table 6: CalculatedAvailabilityforoperations Table 7 CalculatedOEEforwork
5. Shohin Aheleroffa, Xun Xua, Yuqian Lua and Mauricio Aristizabal(2020)“IOT enabledsmartappliancesunder industry 4.0: A case study”, Advanced Engineering Informatics2020ComputersandElectricalEngineering 87(2020)106772
• Averageoverall equipment effectivenessincreased by 19.49%
8

14. Damilare T. Onawoga and Olasunkanmi O. Akinyemi (2013) “Minimizing Incident Stoppages on Critical Equipment by Inspections and Planning”, The Pacific Journal of Science and Technology, Volume 14, 280804004
15. P. Muchiri A. and L. Pintelon (2008) “Performance measurement using overall equipment effectiveness (OEE): literature review and practical application discussion”, International Journal of Production Research,Vol.46,No.13,1July2008,3517 3535
“Industry 4.0 adoption for sustainability in multi tier manufacturing supply chain in emerging economies”, JournalofCleanerProduction2020.125013
16. Madhav Prasad Nepal and Moonseo Park (2004)
12. ShishirMuralidhara,NiharikaHegde,RekhaPM(2020)
International Research Journal of Engineering and Technology (IRJET) e ISSN: 2395 0056 Volume: 09 Issue: 02 | Feb 2022 www.irjet.net p ISSN: 2395 0072 © 2022, IRJET | Impact Factor value: 7.529 | ISO 9001:2008 Certified Journal | Page945 industries”, Computers and Electrical Engineering 86 (2020)106739
8. Xue Feng Shaoa, Wei Liua, Yi Lia, Hassan Rauf Chaudhryb and Xiao Guang Yue (2020) “Multistage implementation framework for smart supply chain management under industry 4.0”, Technological Forecasting&SocialChange162(2021)120354
“Downtime model development for construction equipmentmanagement”,Engineering,Constructionand ArchitecturalManagementVolume11·Number3·2004 ·pp.199 210
“EvolutionofIOT enabledconnectivityandapplications in automotive industry: A review”, Vehicular Communications,2020.100285
13. Alok Mathur, G. S. Dangayach, M. L. Mittal and Milind Sharma (2011) “ Performance measurement in automotive manufacturing”, Measuring Business Excellence,Vol.15Iss1pp.77 91
“An internet of things based smart energy meter for monitoring device level consumption of energy”, Computers and Electrical Engineering, 87 (2020) 106772
7. Zhang,X.,Ming,X.(2020)“AnimplementationforSmart Manufacturing Information System (SMIS) from an industrial practice survey”, Computers & Industrial Engineering,2020.106938
11. Daniel Ibaseta, Andrés García, Martín Álvarez, Belén Garzón,FidelDíezandJulioMolleda(2020)“Monitoring and control of energy consumption in buildings using WOT:Anovelapproachforsmartretrofit”,Sustainable CitiesandSociety65(2021)102637
9. MahakSharma,SachinKamble,ManiVenkatesh,Rajat Sehrawat, Amine Belhadi, Vardaan Sharma (2020)
10. AbdurRahim,ArafaturRahman,M.M.Rahman,A.Taufiq Asyhari, Zakirul Alam Bhuiyan, D. Ramasamy (2020)