The questionnaire has been developed based on the literature findings & preliminary discussions with consultants, contractors & architects. To ensure maximum participation the questionnaire has been distributed to consultants, contractors/builders and Architects.Thequestionnaireresponsefromconsultants, contractor’s, builders and architects was collected first andthenafterstudyingtheirresponses rankinghasbeen done to causes of cost variation. The data collected has been presented, tabulated & analyzed using suitable statisticaltechnique.Alsoacasestudyhasbeentakenfor studyofcausesofcostvariationinconstructionindustry. A discussion of the results is linked with findings of the literature and case study, then cost variation were identified and ranked based on theirs severity. A conclusion of the major findings is stated & some recommendations are given to mitigate the salient problem.Selection of data collection technique. Personal interviews and desk study discussions were carried out and a questionnaire is formed. The questionnaire is prepared by honest and frank opinions as the respondents are not required to state their names. If interviewsareconductedbytheauthorthenrespondents and particularly contractors and consultants might not express their opinions frankly on the issues related to theirclients.Thecausesofconstructioncostvariationare too many to be covered in 30 minutes interview and the respondents might not have longer time to spend on longerinterviews.Thequestionnaireis
Abstract The main aim of this study is to prioritize the main causes of cost overrun in construction projects. Sangli area is selected to collect the data. The collected data is then analyzed and compared to the actual budget the estimated cost to see the various causes of cost overrun. With the help of various workers such as Consultants contractors site engineers and others questionnaire is prepared to the various factors which causes Cost overrun. The study will show the main factors which results in cost overrun. In further projects this type of study he's going to help the project manager to work on variouscauses ofcostoverrun.
Human resources are also related to Cost overrun in few cases. To identify and prioritize the major cause of cost overrun is the focus of this case study. This will help to reduce cost over similar projects. With the help of various workers such as architects and engineers a questionnaire is formed. These factors arerankedbyRelativeimportanceindex.
Analysis of Cost Variation between Estimated Cost and Actual Cost of Residential Building Project
Page
Keywords Cost overrun; Relative importance index; Factors of cost overrun; Relative important index 1. INTRODUCTION
2. METHODOLOGY: To achieve the objectives of the study the following activitieshavebeenconducted:
Cost is the major factor which is to be considered as one of the most important parameter of the project and he's also proven most construction projects fail to achieve its objectives the specific cost. Almost all theprojectshavebeeninconstructionindustryhave beenaffectedbycostvariationinfrequentcases.Cost overrun differs from region to region and is also dependent on economic and geographic factors.
1,2Department of Civil Engineering, Rajarambapu Institute of Technology, Rajaramnagar Sakharale, Maharashtra, 415414, INDIA ***
International Research Journal of Engineering and Technology (IRJET) e ISSN: 2395 0056 Volume: 09 Issue: 02 | Feb 2022 www.irjet.net p-ISSN: 2395-0072 © 2022, IRJET | Impact Factor value: 7.529 | ISO 9001:2008 Certified Journal | 797

Vrushabh Awati1, Nagesh Suryawanshi2
2.1 Questionnaire Design
2.2 Collection of causes Causes are collected from two sources Literature survey (National & international journals and papers).First, an international literature survey was performed to create an initial pool of possible causes for cost variations in construction projects. This literature survey encompassed dozens of journal articles. Any potential causeforcostvariationsinconstructionmentioned. References had been added to the list. The literature survey yield sample number of potential causes. Discussion with guide and an expert practicing in this construction industry. In a parallel route local expert survey was carried out. The experts were not exposed to thepreviousfindingsoftheinternationalliteraturesurvey. Their answers pertained to the local, city specific circumstances.Thisdiscussionyielded36potentialcauses. The first focus phase of this study consisted of categorizing, filteringduplications,and mergingsimilar or closely related causes. Figure 1 shows Pie chart of the respondents involved in the questionnaire survey. The questionnaire is designed carefully to obtain the required data from the respond. The present status of construction industry with the help of literature review was used to form the questionnaire. Some questionnaires that are relatedto topicare reviewedandsome questionsthatare found to be applicable to the construction industry were extractedfromthem.Themaindatarequiredforthisstudy is divided into two main categories. The first category is related to the information about the respondent’s characteristics and their involvement in the construction industry. It identifies the questions concerning the performance of the projects that respondents have been involved in number of the projects that respondent has participatedinandinhowmuchisthecostvariance.From this amountofthecostvariationisgot.Thesecondsection includescostvariationcausesthatwerecollectedearlierto which respondents give their opinions on the severity of certain causes of construction cost variation in building projects. This section contains 6 categories in which 36 cost variation causes are classified. For each factor, the respondentswererequestedtoanswertheseverityimpact of it cost. A six point scale of 0 to 5 was considered for evaluating the 36 impact of each factor. These numerical impactvaluesareassignedtotherespondentsrating
Table.1 Categoryandweightagefortheexplanation designed carefully to obtain the required data from the respondent .The English language is chosen for the questionnaire as it suits all the respondents. The first category is the information about the respondent’s characteristics and their involvement in the building projects.Thesecondoneconcernsrespondent’sopinions onthecostvariationfaced.Thefirstandsecondcategory of the questions is designed based on the respondent’s knowledge and the familiarity of the construction industry and the involvement. The questionnaire is kept asshortaspossible,butcomprehensiveenough,sothatit couldbecompletedwithin20to30minutes.
0:Never;1:Less;2:Sometimes;3:Average;4:Often;5:Always
2.3 Questionnaire Content Thequestionnaireincluded36costvaryingfactorswhich are divided into six categories that are related to the factorsofcost. Partsofthequestionnaireare: Factorsrelatedtofinance o.N.Sr ryCatego Explanation ageghtWei 1. Never 0% cost variation contributing factor.(Not affected) 0 2. Less 1 20% cost variation contributing factor.(less affected) 1 3. meSometi 21 40% cost variation contributing factor.( slightlyaffected) 2 4. Aveage 41 60% cost variation affected)factor.(moderatelycontributing 3 5. Often 61 80% cost variation affected)factor.(significantlycontributing 4 6. Always 81 100% cost variation contributing factor.(less affected) 5
Certified Journal | Page798
International Research Journal of Engineering and Technology (IRJET) e ISSN: 2395 0056
Volume: 09 Issue: 02 | Feb 2022 www.irjet.net p-ISSN: 2395-0072 © 2022, IRJET | Impact Factor value: 7.529 | ISO 9001:2008
Fig.1 Pie chart of total participants.
Scoring system and method of analysis. In the questionnaire, an Ordinal scale of measurements is applied for data measurements in questionnaire survey. Ordinal scale used for this study includes Never; Less; Sometimes, Average, Often and Always. However,abbreviationreplacedwithnumbersi.e. 0fornever(0%); 1 forless(1 20%); 2 forsometimes(21 40%); 3 foraverage(41 60%); 4 foroften(61 80%); 5 foralways(81 100%). In the study Relative Important index (RII) have been employed and calculated for ranking of causes of cost variation in the construction project. The RII is used to rank the differentcauses.These rankings makeitpossible to cross compare the relative importance of the factors as perceived by the two groups of respondents (i.e. owner and contractors).Following formula is used for the calculating the Relative Importance Index (RII) for differentcauses W= Score given to each cause by respondent ranges from0to5(where0isnotaffectedand5isextremely A=affected.)HighestScorei.e.5inthiscase TotalNo.ofrespondents
Builder Architect168 9876543210 Below5yrs 5 yrs
Participants Contractor
Fig.2 Experience of Participants. Majorlyparticipantshavetheexperienceofmorethan 15 years,theyarehighlyexperienced. So theresultobtainted 16 -
15 yrs 15 yrs -yrs25 Above25yrs ArchitectBuilderContractor Description No. respondentsof Architects 8 Contractors 16 Builders 16 Total 40
Otherfactors(externalfactors)
International Research Journal of Engineering and Technology (IRJET) e ISSN: 2395 0056 Volume: 09 Issue: 02 | Feb 2022 www.irjet.net p-ISSN: 2395-0072 © 2022, IRJET | Impact Factor value: 7.529 | ISO 9001:2008 Certified Journal | Page799 Managementfactors Factorsrelatedtolabour Factorsrelatedtomaterial Factorsrelatedtoproject
N=
Figshowspiechartwhichindicates.Total40participants were there, in which 8 of them were architects, 16 were buildersandremaining16werecontractors.
Table 2.Totalnoofrespondents. Participants in questionnaire survey are
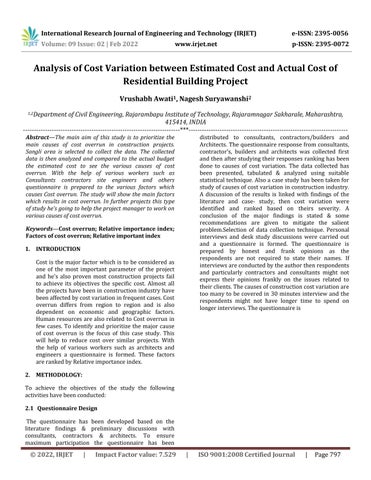
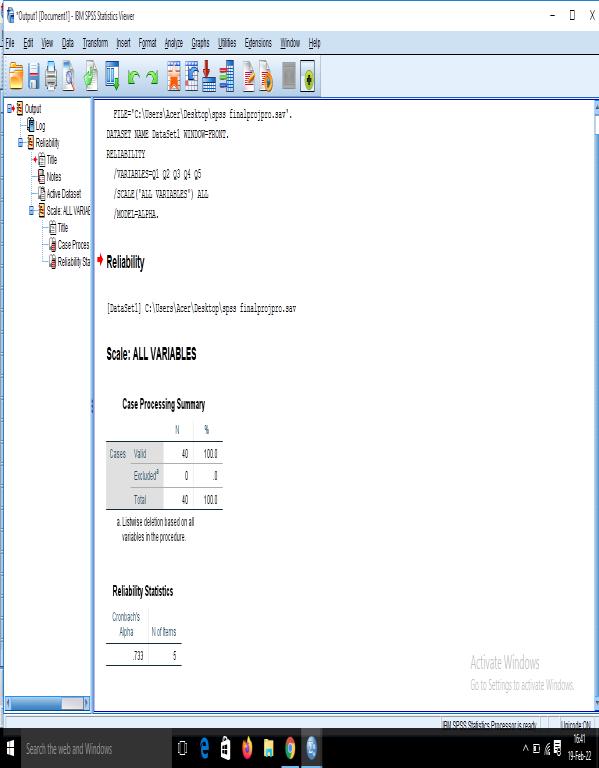
International Research Journal of Engineering and Technology (IRJET) e ISSN: 2395 0056 Volume: 09 Issue: 02 | Feb 2022 www.irjet.net p-ISSN: 2395-0072 © 2022, IRJET | Impact Factor value: 7.529 | ISO 9001:2008 Certified Journal | Page800 ismuchmoreaccurate.Therearelesschancesoferror. Fig.3 Different scale projects respondents worked. Majorly the respondents have worked in bigger projects. Inlarge scaleprojects, differenttypes ofcostvariancecan be observed. So chances of error is less. Content validity and reliability test has been found by using IBM SPSS statisticsdataanalysissoftware. Fig. 4 SPSS data inputs value. Fig. 5 Cronbach’s Alpha value in SPSS 1. Result and discussion Table 3.RankingoffactorsaccordingtoRIIvalue NoSr. Factor RII kRan 1 Liquidityoforganization 0.849 1 2 Sitecharacteristics 0.839 2 3 Taxesandinterestrates 0.774 3 4 underestimationsPredetermined 0.715 4 5 Costofrework 0.672 5 6 Projectsize 0.602 6 7 Qualityoffinishing 0.581 7 8 Projectlocation 0.581 8 9 Designchanges 0.565 9 10 Transportationmaterial 0.548 10 11 Damage 0.538 11 12 Projecttype 0.532 12 13 Demandandsupply 0.522 13 14 Inappropriatecontractors 0.511 14 15 Storageofmaterial 0.511 15 16 Mistakesinconstruction 0.505 16 17 Constructionequipment 0.505 17 18 Unexpected ground condition 0.505 18 19 Inflation 0.489 19 76543210 >25 lakhs 25lakhs-50 50lakhs1cr >2 cr
The study done was limited up to area in Sangli and Kolhapurdistrict.Furtherstudycanbedonebyincreasing the area. It may lead to an increase in the variations in projectcostandotherratesinconstructionindustry.
FUTURESCOPE
ACKNOWLEDGMENT
3. CONCLUSION From the study conducted and by analyzing the feedback oftherespondentsitcanbeconcludedthatthatliquidityof organization, taxes and interest rates, site characteristics and Predetermined underestimations are major factors impactedoncostvariationoftheconstructionproject.Soit is suggested to focus on this main factors so as to avoid costvariationintheconstructionofnewproject.
WewouldliketothankandacknowledgetheK.E.Society’s RajarambapuInstituteofTechnology,Sangliforallkindsof supportsfortheproject.
To reduce the cost variance in predetermined underestimation, instead of analogous estimation, generally go for parametric estimation. Even the use of Three point estimation will help. In Three point estimation, instead of 1, take average of three estimates. Bottom upestimationalsogivesaccurateresults.
So the top four categories which causes cost variation are liquidity of organization, site characteristics, taxes and interestratesandpredeterminedunderestimations.Oneof the important scopes of asset liablity is management of liquidityrisk,measuringandmanagingliquidityneedsare vital for effective operation of banks and financial institution. More time should be given. Proper planning should be done to reduce the variance in liquidity of organization.Propersurveyingandsiteinspectionshouldbedone in ordered to recuce cost variance in site characteristics .The required formation level or the depth of the excavation level should be properly checked with reference to gate level recommendation with help of city engineer.Thesoilreportshouldbeproperlychecked.
[2] Tien Choon Toha, Connie Tingb, Kherun Nita Alic, Godwin Uche Aliaghad and Omar Munira,(2012)," Critical Cost Factors Of Building Construction Projects In Malaysia". Proceedings of International Conference on Asia Pacific Business Innovation and Technology Management, Malaysi. Vol.55,pp.(360 367)
[5] Mhando Yusuph B., Mlinga Ramadhan S. and Alinaitwe Henry M.(2015),"Factors Influencing VariationsinPublicBuildingProjects ".Proceedings of 4th Construction Management Conference Department of Construction Management, South Africa"pp.(162 176) [6] Prajapati Santosh kumar ,Gupta Rakeshand Pandey Mukesh,(2016),"CausesandEffectsofCostOverrun on Construction Projects in Madhya Pradesh".
[3] Alin Veronika, Leni S Riantiniand and Bambang Trigunarsyah (2006),"Corrective Action Recommendation for Project Cost Variance in Construction Material Management" Proceedings of theTenthEastAsia PacificConferenceonStructural Engineering and Construction, Thailand,Vol.5, pp. (23 28) [4] Daniel Okpala C .and Aniekwu Anny N., (1988),“Causes of High Costs of Construction in Nigeria”,Journal of Construction Engineering and ManagementVol.114,No.2,pp.(233 244)
Various ratios and various terms should be checked to redue the variance in taxes and interest rates such as, statement of profitability, projected Balance sheet, cash flow statements, partners capital, loan from the bank liquidityratio,loantovalueratioprofitablityratio.
International Research Journal of Engineering and Technology (IRJET) e ISSN: 2395 0056 Volume: 09 Issue: 02 | Feb 2022 www.irjet.net p-ISSN: 2395-0072 © 2022, IRJET | Impact Factor value: 7.529 | ISO 9001:2008 Certified Journal | Page801 20 Shortageofmaterial 0.457 20 21 Numberofstories 0.457 21 22 Unavailability of competent staff 0.446 22 23 Disputes 0.446 23 24 Formsofprocurement 0.446 24 25 Healthandsafetycost 0.435 25 26 Landcost 0.430 26 27 Incentives 0.409 27 28 Constructionmanagement 0.403 28 29 Absenteeismrate 0.382 29 30 Inspectionandtesting 0.349 30 31 Time needed to rectify defects 0.349 31 32 Numberofworkers 0.339 32 33 Forcemajeure 0.339 33 34 Labourstrikes 0.317 34 35 Itemsmanufacturedoffsite 0.306 35 36 Deflation 0.296 36
REFERENCES [1] Tejale Dhanashree S., (2015),"Analysis of Construction Project Cost Overrun by Statistical Method”, International Journal of Advance Research inComputerScienceandManagementStudiesVol.3, No.5,pp.(349 355)
Page
International Research Journal of Engineering and Technology (IRJET) e ISSN: 2395 0056 Volume: 09 Issue: 02 | Feb 2022 www.irjet.net p-ISSN: 2395-0072 © 2022, IRJET | Impact Factor value: 7.529 | ISO 9001:2008 Certified Journal | 802
International Journal of Engineering Development andResearchVol.4,No.2, pp.(1346 1350)
[9] Shete Anant Narayan and Kothawade Vaibhav Durwas, (2016),“An Analysis of Cost Overruns and Time Overruns of Construction Projects in India”, International journal of Engineering Trends and technology,Vol.41,No.1,pp.33 36
[10] Surabattuni Murali and Sanjeet Kumar, (2019), “ Factors Affecting Overruns Construction Time and Cost”, International Jouranl of Recent Technology andEngineering”,Vol.7,Issue.6C2
[7] Devi Vaishnavi S., (2017),“ Cost Escalation in Construction Projects”, International Journal for Research in Applied Science & Engineering, Vol. 5, No.1,pp.271 277 [8] Jansu Ann Jose and Xavier Belarmin C.S., (2015), “Analysis of Time and Cost Overrun in Building Construction”, Proceedings of International conference on recent advances in engineering scienceandmanagement,NewDelhi,pp.305 311
[11] Salim S. Mulla and Ashish P. Waghmare, (2015), “Influencing factors caused for Time and Cost OverrunsinConstructionProjectsinPune Indiaand theirRemedies”,InternationalJournalofInnovative Science,EngineeringandTechnology.Vol.2Issue10
[15] Agata Czarnigowska (2008),“Earned Value method as a tool for project control”, Institute of Construction,LublinUniversityofTechnology
[12] Yong Woo Kim and Glenn Ballard,(2002),“Case Study overhead cost analysis”, Journal of Construction Engineering and Management Vol. 12, No.3,pp.(125 135)
[13] Laila M. Khodeir and Alaa El Ghandour (2019)), “Examining the role of value management in controlling cost overrun”, Ain Shams Engineering Journal [14] Osamu Mizuno and Tohru Kikun(2000),“Statistical AnalysisofDeviation ofActual CostfromEstimated Cost Using Actual Project Data”, Graduate School of EngineeringScience,OsakaUniversity pp.(1 9)