Electric Field Analysis and Impact Study with Shrubbery on the 11 kV Distribution System fed by a 132 kV/220 kV Transmission Feeder
International Research Journal of Engineering and Technology (IRJET) e ISSN: 2395 0056 Volume: 09 Issue: 02 | Feb 2022 www.irjet.net p ISSN: 2395 0072 © 2022, IRJET | Impact Factor value: 7.529 | ISO 9001:2008

1 INTRODUCTION: In the latest days, there has been a significant increase in the electricity demand. To fulfill this demand, switchgear, transmission, and distribution networks must be done more efficiently. The effectiveness of any system isprimarilydetermined bythecontinuity ofservice while avoiding faults. The performance and properties of insulators must be good to ensure continuity. Ceramic insulators have long been utilized in power transmission and distribution systems. In nowadays ceramic insulator hasbeenslowlyreplacedbycompositeinsulatorinpower grid nowadays. However, flashover fault still occurs on this insulator type. Under certain conditions, partial discharges may occur on the insulator and lead to a complete flashover. The flashover can cause a breakdown and damage the whole power system. Compared to porcelain suspension insulators, composite insulators have many advantages, such as being lightweight, higher mechanical strength to weight ratio, higher resistance to vandalism, better performance in the presence of heavy pollution in wet conditions and better withstand voltage. Therefore, outdoor composite insulators are now preferableandwidelyusedinmaintainingthereliabilityof the power system. With the increase of demand and the use of composite insulators, factors of the occurrence of thefaulthavedrawn
Certified Journal | Page764
Dr. T. Murali Mohan1, B. Chinni2
Abstract In this paper impact of vegetation growth in rural distribution net networks is studied in FEM 2D software. The impact of vegetation growth, along with the Transmission & The model, utilizes parameters of an 11kV, three phase distribution feeder, PCC poles, metallic cross arms, and 160kN pin insulators. A pole span of 100 meters is considered for subject simulation. In this paper, a second case scenario regarding the Electric field analysis on 132kv transmission line tower and 220kv transmission line tower is studied in FEM 2D software. The FEM based simulation and study indicate an increase in electrical field stresses for vegetation in the vicinity of the line.
1Professor, Dept. of Electrical and Electronics Engineering, UCEK, JNTU Kakinada, India
2M. Tech, Dept. of Electrical and Electronics Engineering, UCEK, JNTU Kakinada, India ***
Key Words: Vegetation,PinInsulator,PolymericInsulator 132 kV Transmission Tower, 220kV Transmission Tower, FEM(FiniteElementMethod)
Transmissiowiderattention.nanddistribution of power are accomplished using overhead lines and UG Cables. In OH lines, metallic and non metallic structures are used for supporting insulation (string or pin insulators) and the conductors. For capital costs involved, the use of strong metallic structures is restricted to high and ultra high voltagetransmissionsystems.Whereas,formost,medium voltage power distribution systems wooden, cement structures, or poles are recommended. It is worth noting that both wooden and cement poles not only provide requisite mechanical support, they also minimize charge leakage from the conductor, for their higher specific resistance. In the case of T&D systems, this neighborhood rendered by the metallic tower/ pole structure, the guard wire,andmostimportantlybythevegetationandcreepers inthevicinityofT&Dsystems. This project, model utilizes parameters of an 11kV, three phase distribution feeder, PCC poles, metallic cross arms,and,160kN pin insulators.Apolespanof100 meters is considered for subject simulation. The simulationiscarriedoutusingtheFEMmodelforan11kV, 3 φ distribution feeder, PCC poles, metallic cross arms, and 160kN pin insulators. A pole span of 100 meters is considered for subject simulation for four different configurations.Thepowerlossesareaggregatedforaline length of 10km [1]. In this paper, a second case scenario regardingtheElectricfieldanalysison132kvtransmission linetowerand220kvtransmissionlinetowerisstudiedin FEM 2D software [2] [3]. The FEM based simulation and study indicate an increase in electrical field stresses for vegetationinthevicinityoftheline.[1]
2. IMPACT OF VEGETATION GROWTH IN 11KV DISTRIBUTION NETWORK: The analysis has been carried out using FEMM software. FEMM is a FEFEM based simulation tool. The distribution system chosen is a rural section fed by a 33/11kVShanthiNagarsubstationintheKakinadadistrict of Andhra Pradesh State, India. The section consists of cement poles and cross arms, the AutoCAD design is shown in Figure.1. Vegetation like trees, bushes, and creepers are found to grow during rainy seasons. The growth if abundant can reach alarming heights endangering short circuits. Such developments are modeled and resulting variations in electric field intensities, effective line capacity, once, and leakage current are studied. The results are compared with the standard line without such intrusion. The power and energy losses and additional line loading are determined andshownastheadditionalburdenondistributionutility [1].
TABLE 1: Dimension of Electric pole S.no Particulars Length(mm) 1. 1. Electricpoleheight 12500 2. 2. Width 300
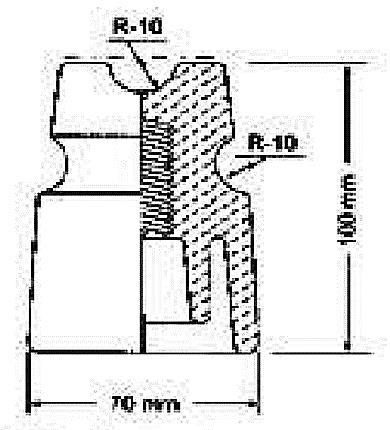
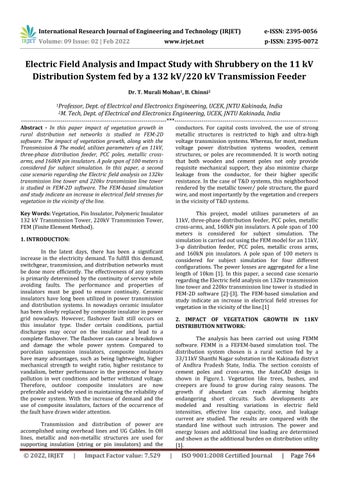
Fig 2:11kV pin insulator
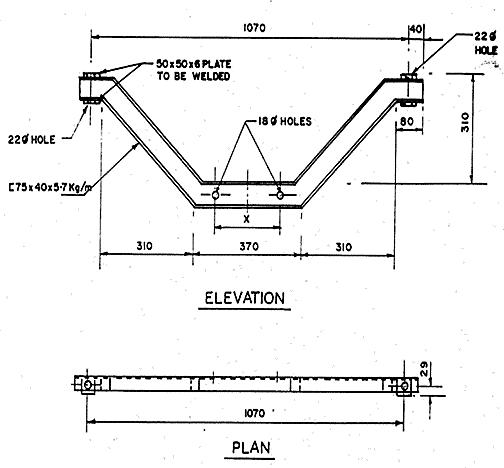
Fig 1:11kV distribution line cross arm design
Geometrical configurations 11kv pin insulator dimensions are shown in Fig 2. 11kv pin insulator design inFEM2Dsoftware[9].
Thus, the Simulation includes the following two cases: Case1. ACleandistributionline Case2. Uncleandistributionline
Journal
2.2. Case1: A Clean distribution Line:
The 11kV, three phase distribution feeder, metallic cross arms, and pin insulator were designed by using FEMM 2D software as per geometrical conFigurations shown in Fig 2.[9] The electric field distribution in and around the insulator is necessary for the optimal design of the insulator. The accurate computationofelectricfielddistributioncanbecomputed usingtheFiniteelementmethod(FEM).Forthisinsulator, dimensionsareveryuseful.11kvElectricpoledimensions areshowninFig1andTable1.
2.2.1. ASSIGNING MATERIALS:
Page
TABLE 2: Material properties Particulars Material valuepermittivityRelative housingInsulator
As per the geometrical configurations, the insulator is designed by using FEMM 2D package. After designing, insulator materials like ceramic, steel, and air areassignedtothemodelwithhelpofrelativepermittivity values.Insulatormaterialpropertiesaregiveninthetable shown Table 2 and Fig2. After assigning materials to the model, the line to the ground voltage (i.e.,12/√3 =7kv) is applied to the energized high voltage end fitting and zero (0V)voltstothegroundedendfittingoftheinsulator.
Ceramic 5.9 Electricpole Steel 1 surfaceBoundary Air 1
2.2.2. ASSIGNING 2D TRIANGULAR ELEMENTS:
Then 2D Triangular elements are assigned to the insulator. Triangular elements at the HV end and ground end are as shown in Fig 2. The boundaries in the model need to be split into individual sections, referred to as boundary elements. The distribution, number, and shape of these elements are the key factors that determine the accuracy of the solution. FEM generally uses 2D elements for analysis purposes. Names of Insulator 1 and Insulator 2andInsulator3areshowninFig2.
International Research Journal of Engineering and Technology (IRJET) e ISSN: 2395 0056 Volume: 09 Issue: 02 | Feb 2022 www.irjet.net p ISSN: 2395 0072 © 2022, IRJET | Impact Factor value: 7.529 | ISO 9001:2008 Certified | 765
2.1. FEM Simulation Analysis: The analysis was carried out for all the two conditionsandwasdiscussedbelow.
International Research Journal of Engineering and Technology (IRJET) e ISSN: 2395 0056 Volume: 09 Issue: 02 | Feb 2022 www.irjet.net p ISSN: 2395 0072 © 2022, IRJET | Impact Factor value: 7.529 | ISO 9001:2008
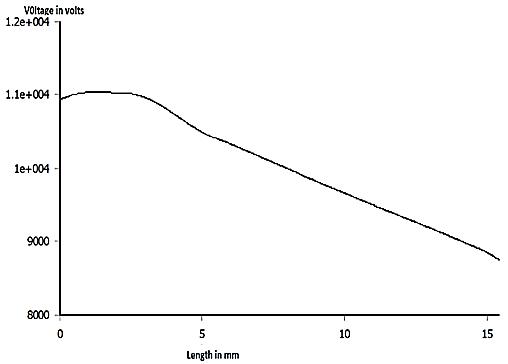
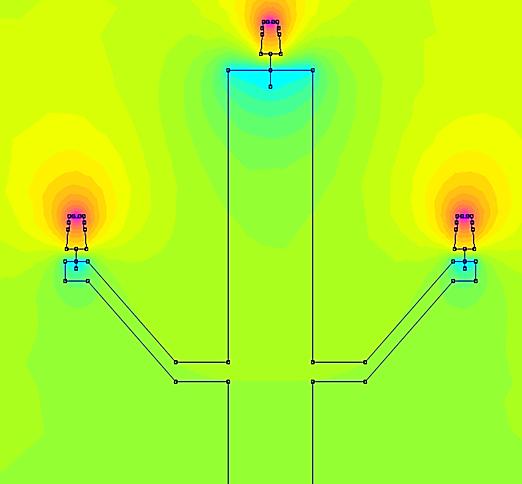
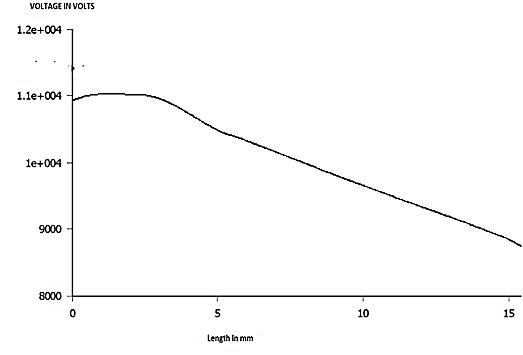
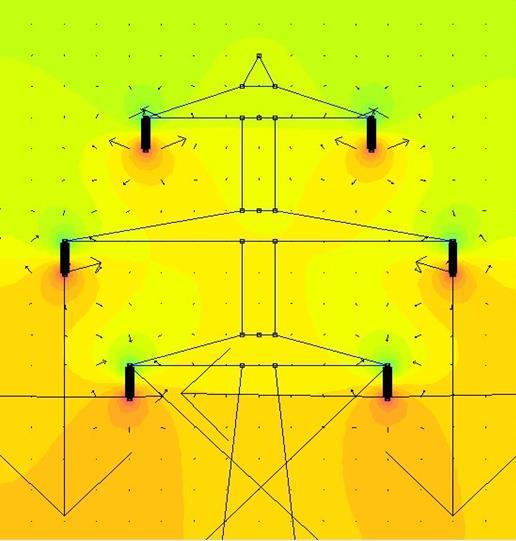
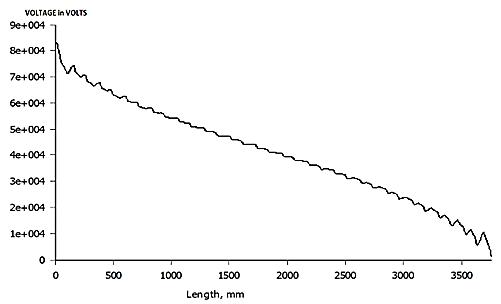
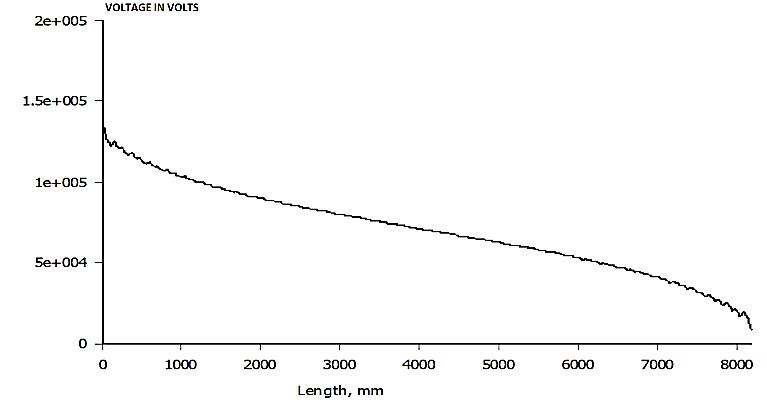
ElectricfieldcontoursareasshowninFig3.After assigning materials to the model, the line to the ground voltage (i.e 12/√3 =7kv) is applied to the energized high voltageendfittingandzero(0V)voltstothegroundedend fitting of the insulator. Field analysis results of 11kv electric pole with cross arm. Electric fields along the insulators are plotted. By running the model electric field contours developed. In this electric field contours, the HV end isshown red colorand theground end isshown blue color The insulator top is given as high voltage and the insulatorgroundisgivengroundvoltage.TheFig.3shows different colors in which each color corresponds to a differentvoltagelevel. In the Fig 4, a graph is plotted between the voltage across insulator and the length of insulator(mm). This Fig 4 is also known as Voltage Distribution along insulatorlength
Certified Journal | Page766
2.2.3. ASSIGNING BOUNDARY CONDITIONS: After assigning boundary elements 2D triangular elements are generated throughout the mode. A FEM model design for the clean distribution assuming that no tree/creeper is surrounding the pole. The results are showing that the stress is now varied between the top of thetreetothetransmissionlinebytreatingthetreeasthe ground is as shown in Fig.3.By running the model electric fieldcontoursdeveloped.Inthiselectricfieldcontours,the HV end is shown red color and the ground end is shown bluecolor.Theratedline to groundvoltageis12/√3=7kVto the high voltage end fittings. Zero volts to the grounded endfitting/Airisassignedasasurroundingmedium.After assigning boundary elements 2D triangular elements are generatedthroughoutthemode.
Fig-4: Voltage Distribution along the insulator
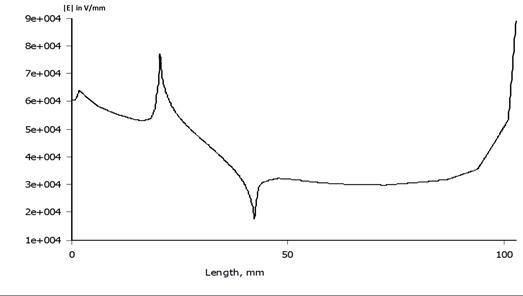
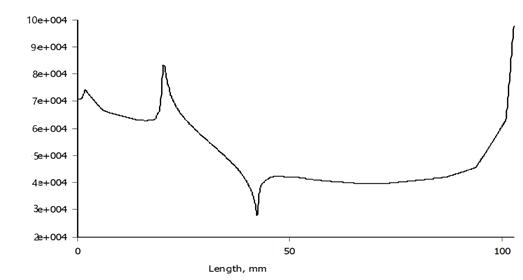
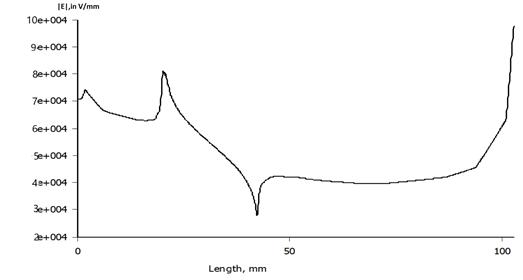
In this Fig6 graph drawn between Electric field intensity vs length of insulator(mm). The maximum Electric field Distribution along insulator 2 is 7.67×e4 (v/mm).
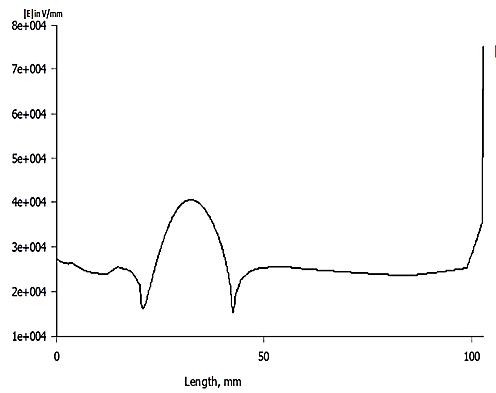
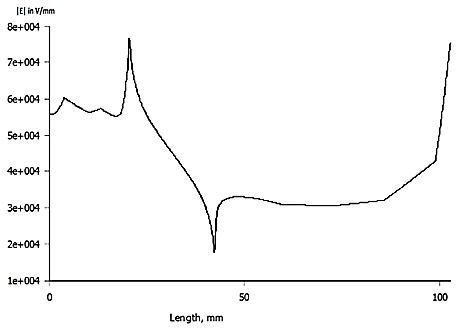
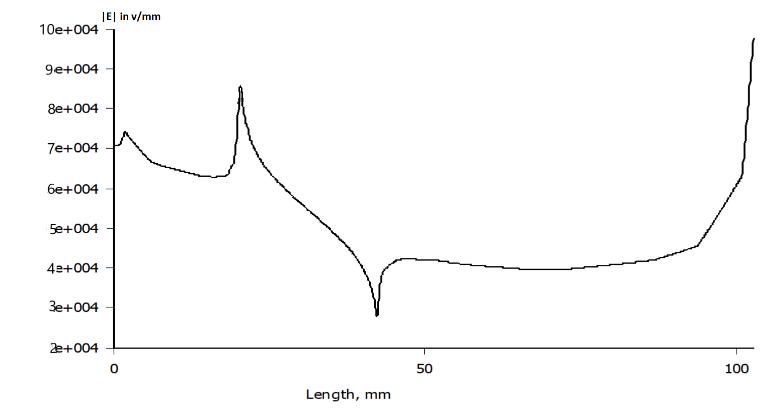
In Fig 5, the Electric field Distribution along insulator1 has been presented. Maximum Electric field Distributionalonginsulator1is8.53×e4 V/mm.
Fig 5: Electric field Distribution along insulator 1
Fig 3: Electric field contours
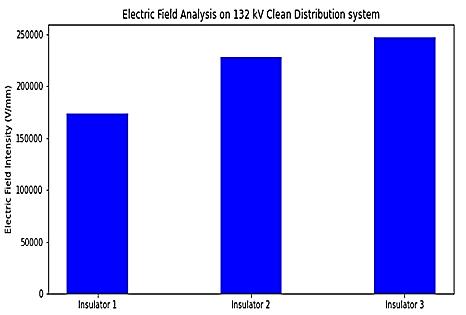
ELECTRIC INTENSTY(V/mm)FIELD 1. Insulator1
along insulator3 Table
2. Insulator2 7.67×e4 3. Insulator3 2.47×e4
Fig 8: Electric field Results analysis 2.3. Case2. For Unclean Distribution Line: The 11kV, three phase distribution feeder, metallic crossarmsandpininsulatorwasdesignedbyusingFEMM 2D software as per geometrical configurations shown in Fig 1. The geometrical configurations 11kv pin insulator dimensionsareshowninFig2.
Fig 6: Electric field Distribution along insulator 2
Tree height increased 40% of the total height of electricpoleheight=4m. Tree height increased 50% of the total height of electricpoleheight=5m.
Electric
Tree height increased 60% of the total height of electricpoleheight=6m. Tree height increased 70% of the total height of electricpoleheight=7m.
The maximum Electric field intensity on the surface of insulator 1, insulator 2 and insulator 3 are presentedTheinTable3.comparisonbarchart ofEFAresultsfor11kv electricpolewithcleandistributionisshowninFig8.
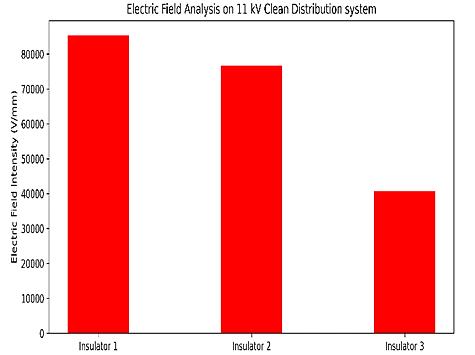
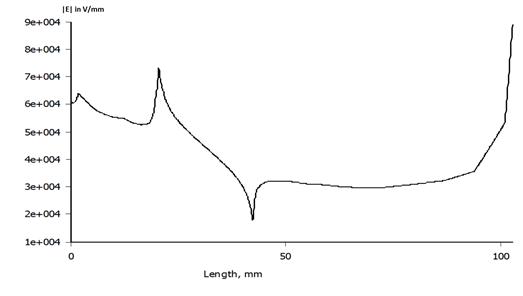
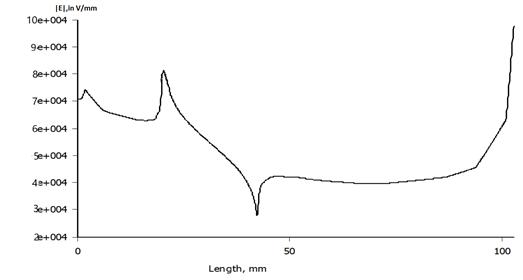
Inthis Fig7 graphis drawn betweenElectricfield intensity vs length of insulator(mm). Maximum Electric fieldDistributionalonginsulator3is 2.47×e5(v/mm). field Distribution 3: Field analysis Results FIELD REGION 8.53×e4
International Research Journal of Engineering and Technology (IRJET) e ISSN: 2395 0056 Volume: 09 Issue: 02 | Feb 2022 www.irjet.net p ISSN: 2395 0072 © 2022, IRJET | Impact Factor value: 7.529 | ISO 9001:2008 Certified Journal | Page767
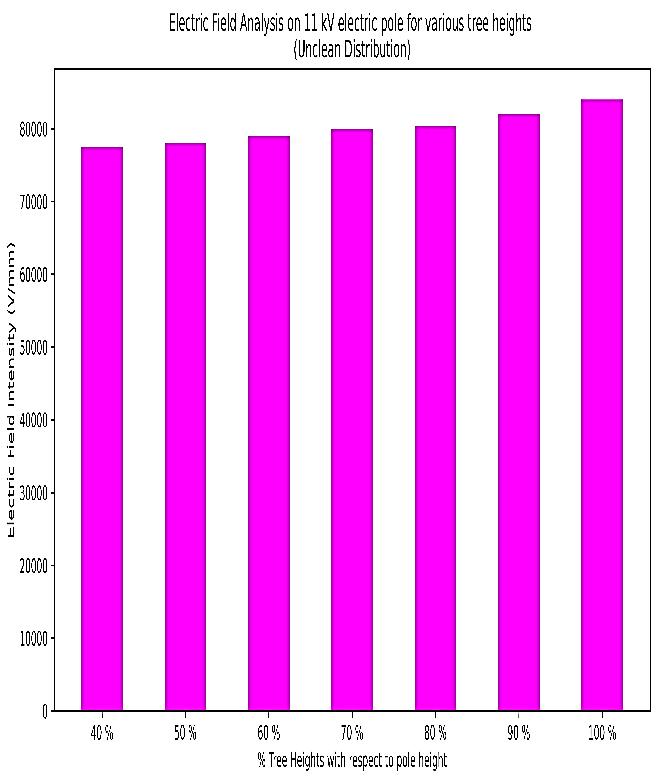
If the vegetation growth increased in steps of 10% from 40% to 100%, the electric field was found to be increasing.
Fig 7: Electric
A FEM model design for the clean distribution assumingthatnotree/creeperissurroundingthepolehas been already presented in section 2.2. For a 50% grown tree/shrubbery,analysishasbeenprimarilycarriedout in the FEM model. The results are showing that the stress is nowvariedbetweenthetopofthetreetothetransmission linebytreatingthetreeastheground.isasshowninFig 9 i.e.,thegroundplanehasincreasedincreasingtheelectric fieldstress[1].
Tree height increased 80% of the total height of electricpoleheight=8m. Tree height increased 90% of the total height of electricpoleheight=9m. Tree height increased 100% of the total height of electricpoleheight=10m.
S.NO
Fig 10: Voltage Distribution along insulator1
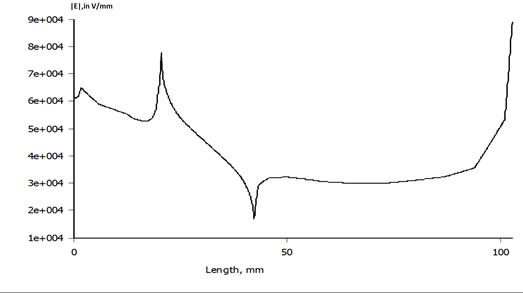
Fig 10.1: Electric field Distribution along insulator 2 with 40 % Tree height b. Electric field Distribution along insulator2 with 50% of tree height increase: In the Fig 10.2, the graph is drawn between Electric field intensity vs length of insulator(mm). MaximumElectricfield Distribution along insulator2 with 50%oftreeheightincreaseis7.80×e4(v/mm).
a. Electric field Distribution along insulator2 with 40% of tree height increase
In the Fig10.1, the graph is drawn between Electric field intensity vs length of insulator(mm). Maximum Electric field Distribution along insulator 2 with 40% of treeheightincreaseis7.75×e4(v/mm).
Ifthevegetationgrowthincreasedinstepsof10% from 40% to 100%, the electric field was found to be increasing.
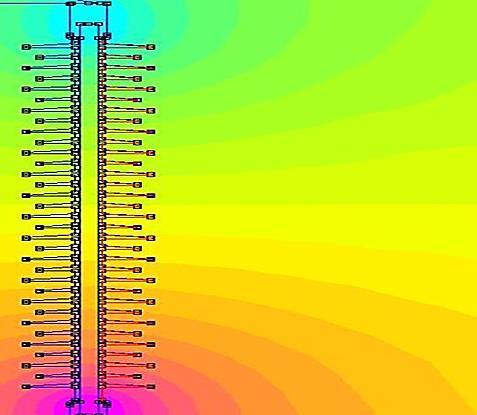
ElectricfieldcontoursareasshowninFig9.After assigning materials to the model, the line to the ground voltage (i.e 12/√3 =7kv) is applied to the energized high voltageendfittingandzero(0V)voltstothegroundedend fitting of the insulator. Field analysis results of 11kv electric pole with cross arm. Electric fields along the insulators are plotted. By running the model electric field contours developed. In this electric field contours, the HV end isshown red colorand theground end isshown blue color. The insulator top is given as high voltage and the insulator ground is given ground voltage. In this Fig 9 showsdifferentcolorscorrespondstoitsvoltageintensity.
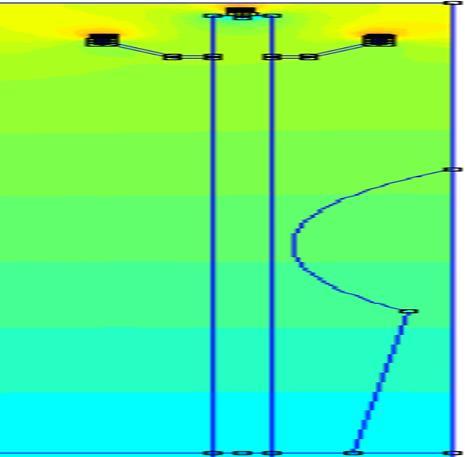
Fig 10.2: Electric field Distribution along insulator 2 with 50 % Tree Height
Fig 9: Electric field contours
International Research Journal of Engineering and Technology (IRJET) e ISSN: 2395 0056 Volume: 09 Issue: 02 | Feb 2022 www.irjet.net p ISSN: 2395 0072 © 2022, IRJET | Impact Factor value: 7.529 | ISO 9001:2008 Certified Journal | Page768
c. Electric field Distribution along insulator2 with 60% of tree height increase: InthisFig10.3graphdrawnbetweenElectricfield intensity vs length of insulator(mm). Maximum Electric fieldDistributionalonginsulator2with60%oftreeheight increaseis 7.90×e4(v/mm).
Fig-10.5: Electric field Distribution along insulator-2 with 80 % Tree Height f. Electric field Distribution along insulator2 with 90% of tree height increase: The Maximum Electric Field Distribution along insulator2 with 90% of tree height increase is 8.20×e4 (v/mm)asshowninFig.10.6.
Fig-10.7: Electric field Distribution along insulator 2 with 100 % Tree Height.
Fig 10.6: Electric field Distribution along insulator 2 with 90 % Tree Height g. Electric field Distribution along insulator2 with 100% of tree height increase: Maximum Electric field Distribution along insulator2 with 100% of tree height increase is 8.40×e4 (V/mm) as showninFig.10.7
Fig-10.3. Electric field Distribution along insulator 2 with 60 % Tree Height d. Electric field Distribution along insulator2 with 70% of tree height increase: In the Fig10.4 graph drawn between Electric field intensity vs length of insulator(mm). Maximum Electric fieldDistributionalonginsulator2with70%oftreeheight increaseis8.00×e4(v/mm).
International Research Journal of Engineering and Technology (IRJET) e ISSN: 2395 0056 Volume: 09 Issue: 02 | Feb 2022 www.irjet.net p ISSN: 2395 0072 © 2022, IRJET | Impact Factor value: 7.529 | ISO 9001:2008 Certified Journal | Page769
Fig 10.4: Electric field Distribution along insulator 2 with 70 % Tree Height e. Electric field Distribution along insulator2 with 80% of Tree height increase: In this Fig10.5 graph is drawn between Electric field intensity vs length of insulator(mm). Maximum Electric field Distribution along insulator 2 with 80% of treeheightincreaseis8.04×e4(v/mm).
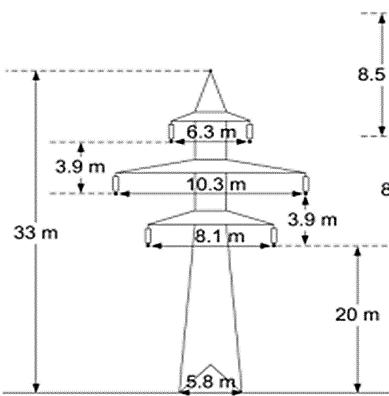
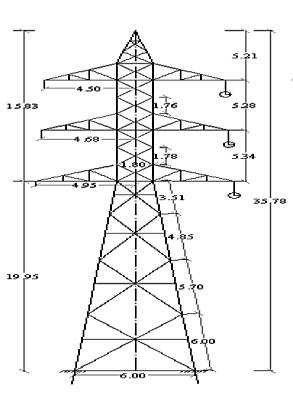
The comparison of EFA results for 11kv electric poleforvarioustreeheightsispresentedinFig11. Fig-11: Electric Field Results Analysis Electric field analysis of 132kv Overhead transmission line tower (Case 3): In this case 3, the electric field distributions and voltage in 132kv overhead transmission line tower studied Fem 2D software. 132kv overhead transmission line tower with polymeric was designed by using Fem 2D software as per geometrical configuration shown in table 5andFig12. 3.1. Geometrical Configurations: The electric field distribution in and around the insulator is necessary for the optimal design of the insulator. The accurate computation of electric field distribution can be computed using the Finite element method (FEM). For this insulator, dimensions are very useful.Insulatordimensionsaretabulatedintable5. Fig 12: Geometric Configuration of the Tower Table 5: Geometrical ConFigurations 132kV polymeric insulator S.no Critical Regions Dimensions in mm 1. Insualtorlength 1060 2. Diameterofbiggershed 135 3. Diameterofsmallershed 105 4. FRPRodlength 960 5. CoreDiameter 28 6. NoDiscsbiggershed 17 7. NoDiscssmallershed 16 8. Pitch 52 9. FRPdiameter 20 10. Thicknessshed 3 3.2. Design of 132kV Overhead transmission line tower: In this case3, the electric field distributions and voltage in 132kv overhead transmission line tower studied Fem 2d software.132kv overhead transmission line tower with polymeric was designed by using Fem 2d softwareaspergeometricalconfigurationshowninFig12 3.3. ASSIGNING MATERIALS: As per the geometrical configurations, the insulator is designed by using FEMM 2D package. After designing, insulatormaterialslikeSiR,FRP,andsteelareassignedto the model with help of relative permittivity values. Insulatormaterialpropertiesaregiveninthetableshown table6.
3.
International Research Journal of Engineering and Technology (IRJET) e ISSN: 2395 0056 Volume: 09 Issue: 02 | Feb 2022 www.irjet.net p ISSN: 2395 0072 © 2022, IRJET | Impact Factor value: 7.529 | ISO 9001:2008 Certified Journal | Page770 Table 4: Electric Field Intensity (vs) Percentage Increasing tree height (%) S.NO IncreasingPercentage tree height ELECTRIC INTENSTY(V/mm)FIELD 1 40% 7.75×e4 2 50% 7.80×e4 3 60% 7.90×e4 4 70% 8.00×e4 5 80% 8.04×e4 6 90% 8.20×e4 7. 100% 8.40×e4
3.5. ELECTRIC FIELD LINES DIRECTION: Fig 15: Electric field lines direction
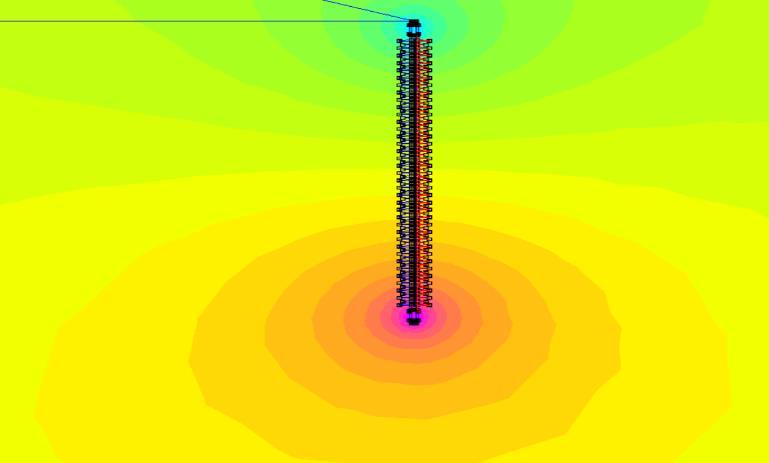
Then 2D triangular elements are assigned to the insulator.ElectricfieldcontoursareasshowninFig13.By running the model electric field contours developed. In thiselectricfieldcontoursHV,theendisshownredcolor, andthegroundendisshownblurcolor.Theinsulatortop is given as high voltage and the insulator ground is given ground voltage. In this Fig 13 shows different colors & each color shows different voltages.132Kv overhead transmission line bottom of the tower is grounded shown bluecolorinFig13
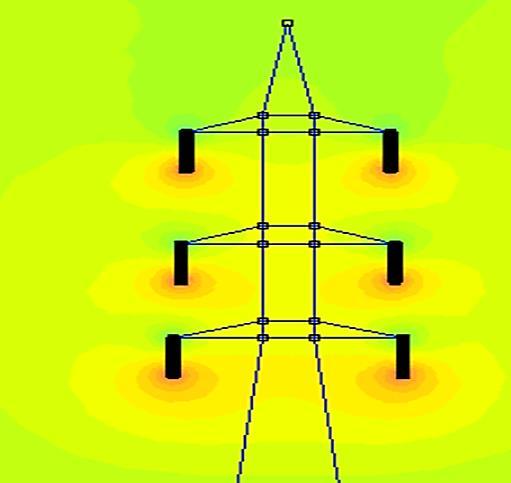
The rated line to ground voltage as 145/√3=83.71kVtothehighvoltageendfitting Zerovolts to the grounded end fitting. Air is assigned as a surroundingmedium.
Fig 13: Electric field contours
3.4. ELECTRIC FIELD DISTRIBUTION ALONG INSULATOR: Fig 14: Electric field Distribution along Insulator1 Electric field distribution along the surface of insulator1 is shown in Fig 18. The rated line to ground voltageas145/√3=83.71kVtothehighvoltageendfitting Zerovoltstothegroundedendfitting/Airisassignedasa surrounding medium. Electric field distribution along the surface of insulator1 is shown in Fig 14. 132Kv overhead transmission tower is grounded shown blue color in Fig 14.
Boundarysurface Air 1
International Research Journal of Engineering and Technology (IRJET) e ISSN: 2395 0056 Volume: 09 Issue: 02 | Feb 2022 www.irjet.net p ISSN: 2395 0072 © 2022, IRJET | Impact Factor value: 7.529 | ISO 9001:2008 Certified Journal | Page771 Table 6: Material properties Particulars Material valuepermittivityRelative
Insulator housing andweathersheds Silicone 3 FRPRod Fibreglass 5 Tower Steel 1
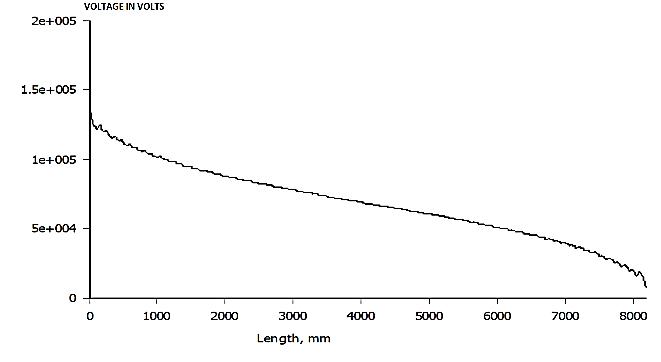
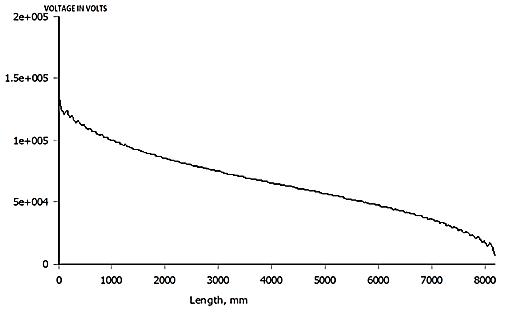
Fig-17.1: Voltage Distribution along insulator1 In this Fig17.1 graph drawn between voltage vs length of insulator(mm). Maximum Voltage Distribution alonginsulator3is8.00×e4(v/mm). 3.8. VOLTAGE DISTRIBUTION ALONG INSULATOR2 IntheFig17.2graphdrawnbetweenvoltagevslengthof insulator(mm). Maximum Voltage Distribution along insulator3is8.26×e4(v/mm).
International Research Journal of Engineering and Technology (IRJET) e ISSN: 2395 0056 Volume: 09 Issue: 02 | Feb 2022 www.irjet.net p ISSN: 2395 0072 © 2022, IRJET | Impact Factor value: 7.529 | ISO 9001:2008 Certified Journal | Page772
Fig 17.2: Voltage Distribution along insulator2 3.9. VOLTAGE DISTRIBUTION ALONG INSULATOR3: Fig 17.3: Voltage Distribution along insulator3
MaximumVoltageDistributionalonginsulator3is 8.26×e4 (v/mm). In this Fig17.3 graph drawn between voltagevslengthofinsulator(mm). 3.10. ELECTRIC FIELD DISTRIBUTION ALONG INSULATOR1
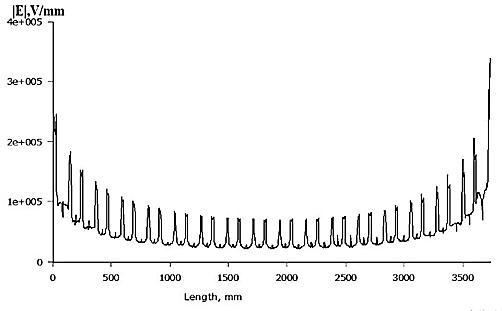
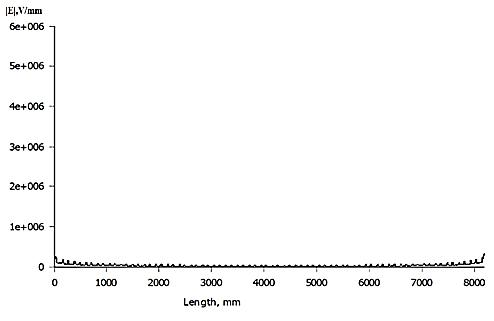
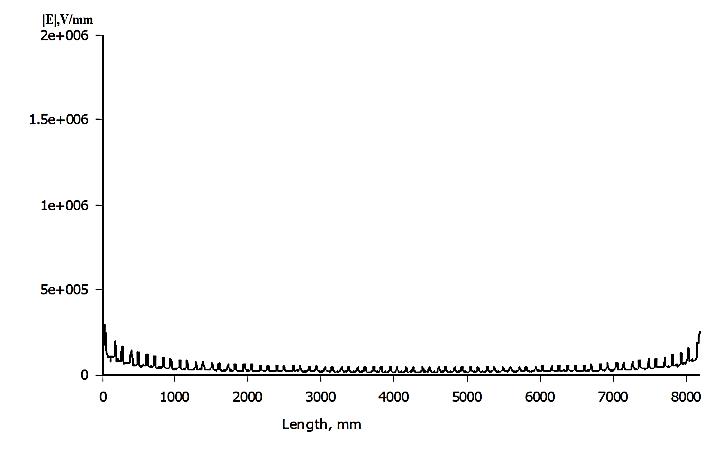
Maximum Electric field Distribution along insulator1 is 1.74×e5 (v/mm). In this Fig18 graph drawn between Electricfieldintensityvslengthofinsulator(mm).
Electricfieldlinesdirection shownin Fig15.This Figure shows Electric field lines flow from hv end to groundend. 3.6. EQUIPOTENTIAL LINES: Fig 16: Equipotential lines direction Equipotential lines direction shown in Fig 16. This, the Figure shows Equipotential lines flow from hv endtogroundend 3.7. VOLTAGE DISTRIBUTION ALONG INSULATOR1:
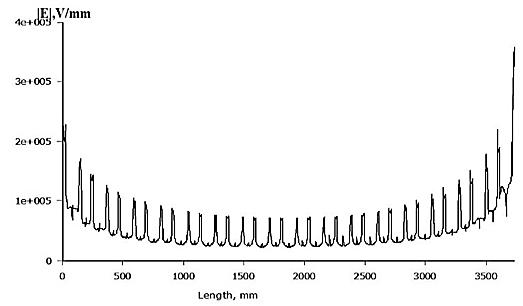
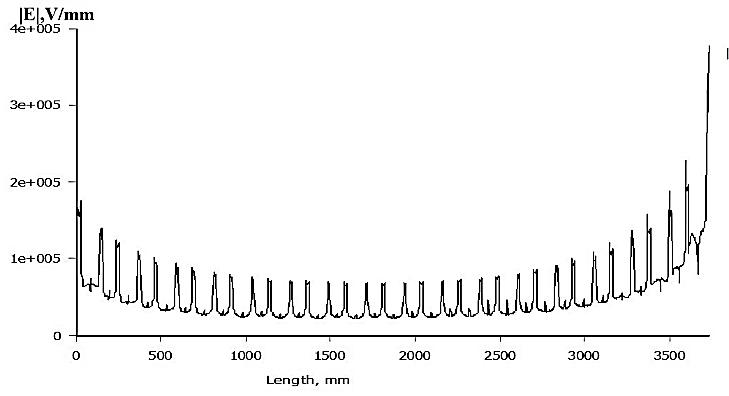
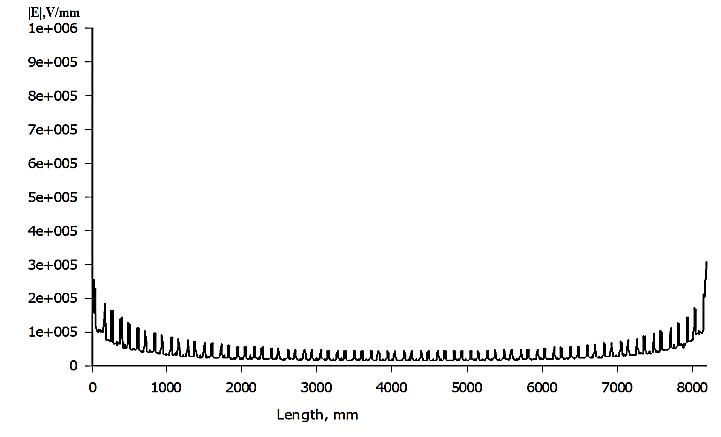
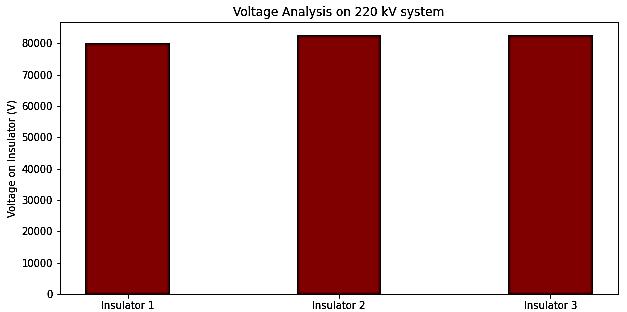
International Research Journal of Engineering and Technology (IRJET) e ISSN: 2395 0056 Volume: 09 Issue: 02 | Feb 2022 www.irjet.net p ISSN: 2395 0072 © 2022, IRJET | Impact Factor value: 7.529 | ISO 9001:2008 Certified Journal | Page773 Fig-18: Electric field Distribution along insulator1 3.11. ELECTRIC FIELD DISTRIBUTION ALONG INSULATOR2: Maximum Electric field Distribution along insulator2is2.28×e5(v/mm).InthisFig.19graphdrawn between Electric field intensity vs length of insulator(mm). Fig 19: Electric field Distribution along insulator2 3.12. ELECTRIC FIELD DISTRIBUTION ALONG INSULATOR 3: Fig 20: Electric field Distribution along insulator3 Maximum Electric field Distribution along insulator3 is 2.47×e5 (v/mm). In this Fig20 graph drawn between Electric field intensity vs length of insulator(mm).EFAresultsfor132kVoverheadtransmissionline tower insulator1, insulator2 & insualtor3 are shown in table7 Table 7: EFA results for 132kV overhead transmission line tower S.NO FIELD REGION ELECTRIC FIELD INTENSTY (V/mm) 1. Insulator1 1.74×e5 2. Insulator2 2.28×e5 3. Insulator3 2.47×e5 Table 8: Voltage results for 132kV overhead transmission line tower S.NO FIELD REGION VOLTAGE (Volt) 1. Insulator1 8.00×e4 2. Insulator2 8.26e4 3. Insulator3 8.26×e4 3.13. EFA RESULTS COMPARISION: Fig 21: Electric Field Results Analysis 3.14. VOLTAGE RESULTS COMPARISION: Fig 22: Voltage Results Analysis
4.2. ASSIGNING 2D TRIANGULAR ELEMENTS: Theboundariesinthemodel needto besplitinto individualsections,referredtoasboundaryelements. The distribution, number, and shape of these elements are the key factors that determine the accuracy of the solution. FEM generally uses 2D elements for analysispurposepurposes.
52 9.
4.3. ASSIGNING BOUNDARY CONDITIONS: The rated line to ground voltage is 220/√3=142kVtothehigh voltageendfittings.Zerovolts to the grounded end fitting/Air is assigned as a surrounding medium. After assigning boundary elements 2D triangular elements are generated throughout the mode. InthiselectricfieldcontoursHV,theendisshown red color, and the ground end is shown blue color. The insulator top is given as high voltage and the insulator ground is given ground voltage. In this Fig 9 shows differentEachcolors.colors shows different voltages shown in Fig24. 220Kv overhead transmission line bottom of the towerisgroundedshownbluecolorinFig24.

4.4. Electric field contours: Fig-24: Electric field contours
4.1.1.
1.
7. 7.
smallershed 45 8. 8.
3.
4. Electric field analysis of 220kv Overhead transmission line tower (Case 4): In this case4, the electric field distributions and voltage in 220 kV overhead transmission line tower studied Fem 2d software.220kv overhead transmission line tower with polymeric was designed by using Fem 2d softwareaspergeometricalconfigurationshowninFig23.
20 10. Thickness
International Research Journal of Engineering and Technology (IRJET) e ISSN: 2395 0056 Volume: 09 Issue: 02 | Feb 2022 www.irjet.net p ISSN: 2395 0072 © 2022, IRJET | Impact Factor value: 7.529 | ISO 9001:2008 Certified Journal | Page774
4.1. Geometrical Configurations: The electric field distribution in and around the insulator is necessary for the optimal design of the insulator. The accurate computation of electric field distribution can be computed using the Finite element method (FEM). For this insulator, dimensions are very useful. Insulator dimensions are tabulated in table 9 and Fig23. Fig 23: Geometric Configuration of the 220 kV Tower Table 9: Geometrical ConFigurations-220kV polymeric insulator S.no Critical Regions inDimensionsmm 1. Insualtorlength 2200 2. Diameterofbiggershed 135 3. Diameterofsmallershed 105 4. 4. FRPRodlength 2100 5. 5. CoreDiameter 26 6. 6. NoDiscsbiggershed 46 NoDiscs Pitch FRPdiameter shed 3 ASSIGNING MATERIALS As per the geometrical configurations, the insulator is designed by using FEMM 2D package. After designing, insulator materials like SiR, FRP, and steel are assigned to the model with help of relative permittivity values. Insulator material properties are given in the table8.
2.
Distribution along insulator1
INSULATOR1:Fig26.1:Voltage
Electric field Distribution along the surface of insulator1 is shown in Fig 25. The rated line to ground voltage is 220/√3=142kV to the high voltage end fittin. Zero volts to the grounded end fittingAir is assigned as a surroundingmedium.
MaximumVoltageDistributionalonginsulator1is 2.56×e5 (v/mm). In this Fig26.1 graph drawn between voltagevslengthofinsulator(mm).
MaximumVoltageDistributionalonginsulator3is 2.56×e5 (v/mm). In this Fig26.3 graph drawn between voltagevslengthofinsulator(mm).
International Research Journal of Engineering and Technology (IRJET) e ISSN: 2395 0056 Volume: 09 Issue: 02 | Feb 2022 www.irjet.net p ISSN: 2395 0072 © 2022, IRJET | Impact Factor value: 7.529 | ISO 9001:2008 Certified Journal | Page775
Distribution along insulator1
4.5. ELECTRIC FIELD DISTRIBUTION ALONG FigINSULATOR1:25:Electricfield
MaximumVoltageDistributionalonginsulator2is 2.56×e5 (v/mm). In this Fig26.2 graph drawn between voltagevslengthofinsulator(mm).
INSULATOR3:Fig26.3:Voltage Distribution along insulator3
4.6. VOLTAGE DISTRIBUTION ALONG
4.7. VOLTAGE DISTRIBUTION ALONG INSULATOR2
4.9. ELECTRIC FIELD DISTRIBUTION ALONG
4.8. VOLTAGE DISTRIBUTION ALONG
FigINSULATOR127.1:Electric field Distribution along insulator1
Fig-26.2: Voltage Distribution along insulator2
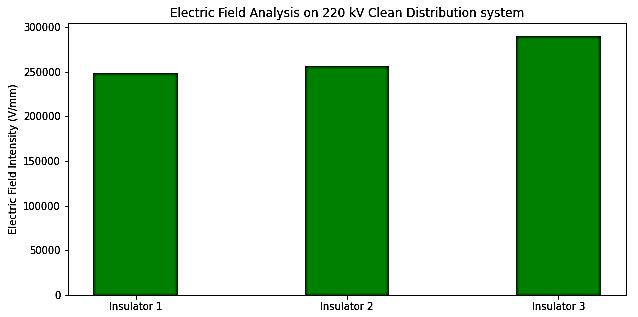
Maximum Electric field Distribution along insulator1is 2.49×e5(v/mm).Inthis Fig27.1graphis drawn between Electric field intensity vs length of insulator(mm).
International Research Journal of Engineering and Technology (IRJET) e ISSN: 2395 0056 Volume: 09 Issue: 02 | Feb 2022 www.irjet.net p ISSN: 2395 0072 © 2022, IRJET | Impact Factor value: 7.529 | ISO 9001:2008 Certified Journal | Page776
S.NO FIELD REGION VOLTAGE (Volt) 1. Insulator1 1.30×e5 2. Insulator2 1.33×e5 3. Insulator3 1.33×e5 4.12. EFA RESULTS COMPARISION: Fig 28: Electric Field Results Analysis 4.13. VOLTAGE RESULTS COMPARISON: Fig 29: Voltage Results Analysis 5.
In this project, an electric field Analysis has been carried outandan11kVDistributionsystem.Toenhance the study, three 11kv insulators are chosen and tests are conducted under clean and unclean environments. Later on, the study is extended to include the effects of shrubbery,wehavechosen differentlevelsoftreeheights concerning the pole heights. The effectiveness of these analyses is proven by taking 132 kV and 220 kV feeders thatarepoweringour11kVdistributionsystem.Byseries of tests, it is confirmed that the shrubbery has the least effectontheExtraHighvoltagetransmissionsystemsdue to their humungous tower heights. Thus the study is constricted to 11 kV system Electric field distribution underfourcases.Bycomparison,case1andcase2results inelectricfieldstressmoreincase2.
4.10. ELECTRIC FIELD DISTRIBUTION ALONG INSULATOR 2: Fig 27.2: Electric field Distribution along insulator2 Maximum Electric field Distribution along insulator2is2.56×e5(v/mm).InthisFig27.2graphdrawn between Electric field intensity vs length of insulator(mm).
4.11. ELECTRIC FIELD DISTRIBUTION ALONG
FigINSULATOR3:27.3:Electric field Distribution along insulator3 From Fig. 27.3, the Maximum Electric field Distributionalonginsulator3is2.90×e5(v/mm).
Table 12: Voltage results for 220 kV overhead transmission line tower CONCLUSION:
Table 11: EFA results for 220 kV overhead transmission line tower S.NO FIELD REGION ELECTRIC FIELD INTENSTY (V/mm) 1. Insulator1 2.49×e5 2. Insulator2 2.56×e5 3. Insulator3 2.90×e5
Journal
[6]Zacharias G. Datsios, Pantelis N. Mikropoulos, Thomas E.Tsovilis “Estimation of the Minimum Shielding Failure Current Causing Flashover in Overhead Lines of the Hellenic Transmission System through ATP EMTP Simulations”
REFERENCES
[1]S.Devabhaktuni, H. Shankar Jain and P. K. Vujjin, "Impact of Shrubbery in Rural Transmission and Distribution Networks," 2017 IEEE International Conference on Computational Intelligence and Computing Research (ICCIC), 2017, pp. 1 5, DOI DOI: [2]Rao,10.1109/ICCIC.2017.8524259.M.Nageswara,V.S.N.
Dalai, and B. Chatterjee, "Effect of humidity on leakage current of a contaminated 11 kV Porcelain Pin Insulator," 2017 6th International Conference on Computer Applications In Electrical Engineering Recent Advances (CERA), 2017, pp. 215 219, DOIDOI:10.1109/CERA.2017.8343329.
Page777
International Research Journal of Engineering and Technology (IRJET) e ISSN: 2395 0056 Volume: 09 Issue: 02 | Feb 2022 www.irjet.net p ISSN: 2395 0072 © 2022, IRJET | Impact Factor value: 7.529 | ISO 9001:2008 Certified |
K. Chaitanya, and P. Vijaya Haritha."StudyofHydrophobicityEffecton220kVDouble Tension Insulator String Surface Using Finite Element Method." International Journal of Electronics and CommunicationEngineering14,no.3(2020):70 75. [3]Supriya Khedkar, Shilpa Kewate, Sneha Hirkane “Analysis and Design of 220kV transmission line tower with hot rolled and cold formed cold formed section” Volume6,Issue12,December 2015 [4]Z. G. Datsios, P. N. Mikropoulos, T. E. Tsovilis, V. T. Karakostas, and S. P. Mavidou “ESTIMATION OF THE MINIMUM BACKFLASHOVER CURRENT OF 150 AND 400 kV OVERHEAD TRANSMISSION LINES THROUGH ATP EMTP SIMULATIONS: EFFECT OF THE LIGHTNING STROKE LOCATION ALONG LINE SPANS” August 26 30, [5]Rao,2019M.V.Durga,andK.,K.AsokanandKumar,RAshok, AnalysisofElectricFieldonCompositeSiliconeInsulators Used in High Voltage Transmission Lines (October 2, 2019). Proceedings of International Conference on Advancements in Computing & Management (ICACM) 2019
[7]Mr.M.V.DurgaRao.S aDr.K.AsokanbDr.R.Ashok Kumar
“AnalysisofElectricFieldonCompositeSiliconeInsulators UsedinHighVoltageTransmissionLines” [8]C.Zacharias’s,S.M.Rowland,I.Cotton,V.Peesapatiand D. Chambers, "Development of Electric Field Stress Control Devices for a 132 kV Insulating Cross Arm Using Finite Element Analysis," in IEEE Transactions on Power Delivery,vol.31,no.5,pp.2105 2113,Oct.2016,DOIDOI: [9]S.10.1109/TPWRD.2015.2499795.Deb,R.Ghosh,S.Dutta,S.
In the case2 of the electric field fields, stress increases with increasing vegetation growth. In case2 vegetationgrowthis10%electricfieldstressisless.Ifthe vegetationgrowthincreasedinstepsof10%from40%to 100%, the electric field was found to be increasing. At vegetation growth of 100% pole height, the electric field stresses are very high. In case 3, three insulators of the sameratingsarecompared.Theelectricfieldstressishigh in insulator3 compared to insulator 1 and insulator 2. In case 4 electric field stress is high in insulator3 compared toinsualtor1andinsulator2. From this testing and simulation of electric field analysis, it is found that electric field stress is different even for insulators of the same rating and manufacturers. Itisalsoaffectedbyshrubberyanditsheightcomparedto pole height. From these tests, it is confirmed that shrubbery is a minor player in electric field stress of 132 kV and greater voltages due to high tower heights. Its effects are high for distribution systems of voltage 11 kV and under as their cross arms may be accessible near shrubbery.