International Research Journal of Engineering and Technology (IRJET) e-ISSN:2395-0056

Volume: 09 Issue: 12 | Dec 2022 www.irjet.net p-ISSN:2395-0072
International Research Journal of Engineering and Technology (IRJET) e-ISSN:2395-0056
Volume: 09 Issue: 12 | Dec 2022 www.irjet.net p-ISSN:2395-0072
Mr. Prashant Machhindra Darunte 1 , Prof. Shankar C. Wadne 2 , Dr. P.A. Hangargekar 3
1PG Student ME ( Water Resource Engineering), 2 Assistant Professor, 3 Associate Professor and Head 1,2,3(Department of Civil Engineering, Shree Tuljabhavani college of engineering Tuljapur Dist Osmanabad, Maharashtra, India.) ***
Abstract – Now a day water distribution supply pipe network very essential in population growing city also large villages because need of water distribution system provide good quality of water that can be minimize health problem of peoples. Then We Choose rural area in Nashik District that is Growing In population In that Village is Very Important To design Water distribution network of Saigaon Village situated in Yeola Taluka Place is designed which is located at district of Nashik, State Maharashtra, India. For the design of water distribution network For Saigaon Village, Water distribution network for the villages is analyzed and designed with help of Bentleys WATERGEMS software.
We will use a scaled background drawing to assist in drawing the pipe network, As We draw a schematic of a pipe network, you will enter pipe lengths, while the software Automatically assigns labels to each pipe and node. If building a scaled model of a pipe network, as you draw elements, the software will automatically manage pipe lengths based on position of pipes bends, start nodes, and stop nodes, and allow customized labeling formats.
After design the water Distribution Network We also Getting idea What Cost Should required for water distribution network so it also tentative cost also calculated.
Key Words: WATERGEMS software1, Water distribution network2, Google map3, counter map4, Data collection5, Data analysis6, Adopted Methodology7.
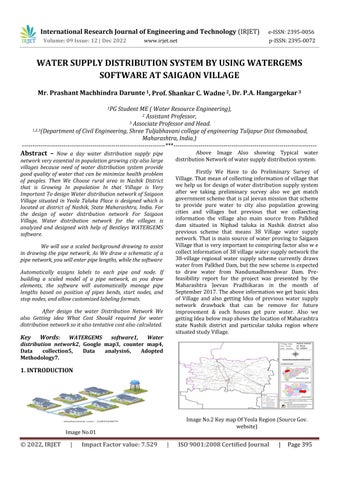
Above Image Also showing Typical water distributionNetworkofwatersupplydistributionsystem.
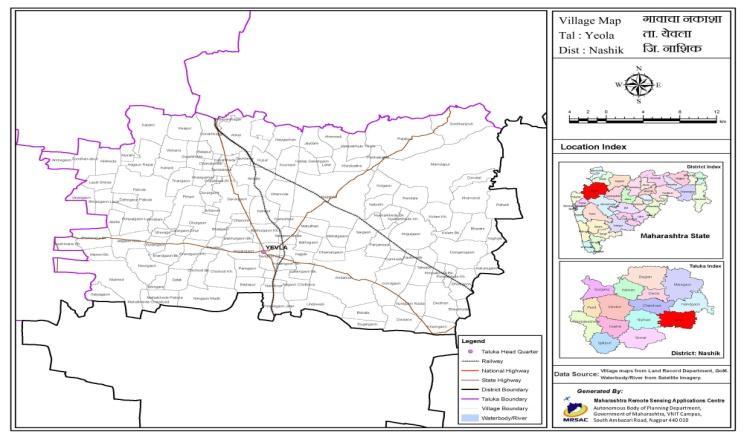
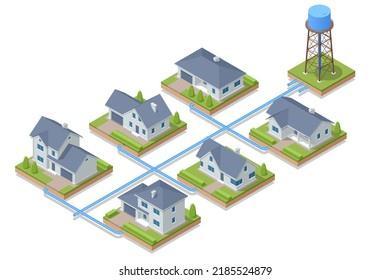
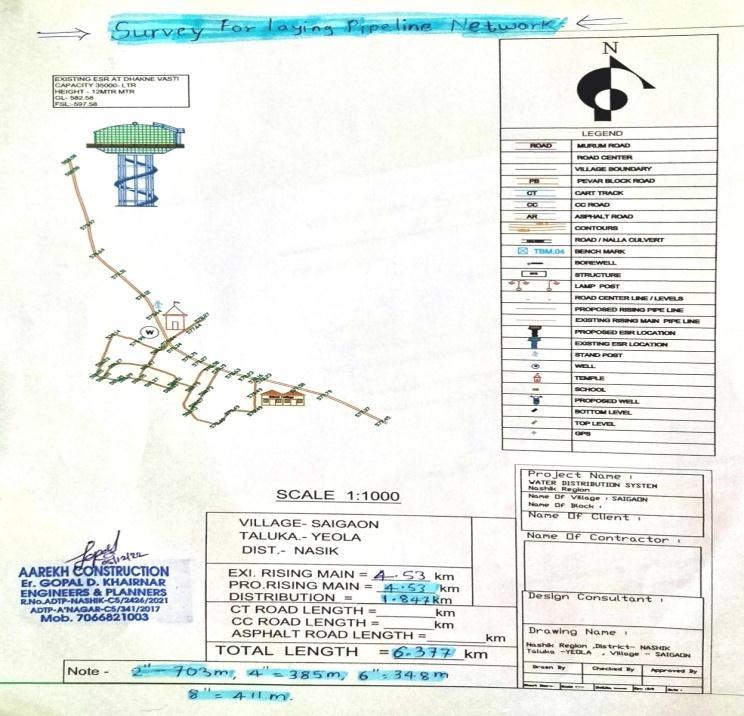
Firstly We Have to do Preliminary Survey of Village Thatmeanofcollectinginformationofvillagethat wehelpus fordesign of water distributionsupplysystem after we taking preliminary survey also we get match governmentschemethatisjaljeevanmissionthatscheme to provide pure water to city also population growing cities and villages but previous that we collaecting information the village also main source from Palkhed dam situated in Niphad taluka in Nashik district also previous scheme that means 38 Village water supply network. That is main source of water proving to Saigaon Villagethatisveryimportanttoconspiringfactoralsowe collectinformationof38villagewatersupplynetworkthe 38-village regional water supply scheme currently draws waterfromPalkhedDam,butthenewschemeisexpected to draw water from Nandumadhmeshwar Dam. Prefeasibility report for the project was presented by the Maharashtra Jeevan Pradhikaran in the month of September2017.Theaboveinformationwegetbasicidea of Village and also getting Idea of previous water supply network drawback that can be remove for future improvement & each houses get pure water. Also we gettingIdeabelowmapshowsthelocationofMaharashtra state Nashik district and particular taluka region where situatedstudyVillage.
ImageNo.2KeymapOfYeolaRegion(SourceGov. website)
International Research Journal of Engineering and Technology (IRJET) e-ISSN:2395-0056
Volume: 09 Issue: 12 | Dec 2022 www.irjet.net p-ISSN:2395-0072
Saigaon Local Language is Marathi. Saigaon Village Total populationis3117andnumberofhousesare721.Female Population is 49.85%. Village literacy rate is 72.18% and the Female Literacy rate is 32.72%. as per 2011 census datagettingfromgovernmentrecord. Village Location: TalukaName: Yeola
Human life, as with all animal and plant life on the planet, is dependent upon water. Not only do we need water to grow our food, generate our power and run our industries,butweneeditasabasicpartofourdailylivesour bodies need to ingest water every day to continue functioning."Basicneedsof about70litres perperson per day". It includes the need for water to maintain a basic standard of personal and domestic hygiene sufficient to maintain health. The effects of inadequate water supply causes disease, time and energy expended in daily collection, high unit costs, etc. provision of basic daily water needs is yet to be regarded by many countries as a humanright.
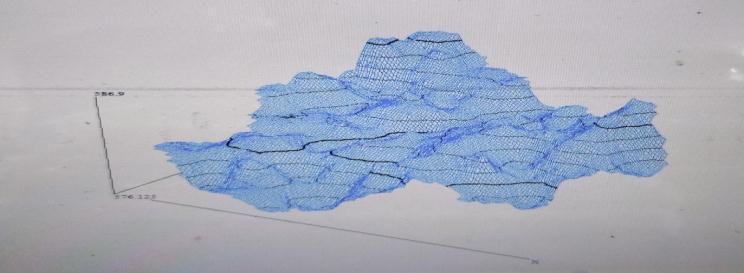
1.2 Scope of the Work: 1) Preparation of water pipe network in Bentley Water GEMS from GIS files. 2) Preparation of hydraulic model and extended period simulationofthesame.3)Loadelevationstothehydraulic modelfromthe3Dcontourdata
1.3
To find out water demand calculation of Saigaon villageinYeolacity.
Analysis and Design of Water Distribution NetworkforSteadyStatecondition.
To find out Optimum Diameter for the Water DistributionNetwork.
International Research Journal of Engineering and Technology (IRJET) e-ISSN:2395-0056
Volume: 09 Issue: 12 | Dec 2022 www.irjet.net p-ISSN:2395-0072
2.1Fordesignawaterdistributionnetworkof Saigaon village.
Following data Required
1.CollectionofthepopulationFrom1991to2011of Saigaonvillage. 2.Collectionoftheexistingworkdataofheadwork,ESR andrawwaterpipeline. 3.RoadmapofSaigaonvillages. 4.Dataofexistingwaterpipeline. 5.locationofExistingVillage 2.2 Software used: 1)Watergems 2)AutoCAD2014 3)GPSvisulizer 4)GOOGLEEarthpro 2.3 Population Forecasting
2.3.1 Arithmetical Increase Method: Rate of change of population with time is assumed to be constant. Applicabletooldandlargecitieswithnoindustrialgrowth and reached a saturation or maximum development. This methodyieldslowerresultforrapidlygrowingcities.
Pn=(P◦ +n.x)Where p◦ =Latestknownpopulation;
Pn=prospectivepopulationafter„n„decades. X=Averageincreasesinpopulationperdecade.
Year Population
1991 560person
2001 1500person
2011 3117person(censusdatafromgovwebsite)
2021 6951 2031 13341
2041 22926
Tableshowspopulationusingarithmeticincrease methods
2.4 Adopted Methodology
DataCollection
Dataanalysis
ModelingUsingSoftware
Comparison
FinalResults
2.4.1 Data Collection:
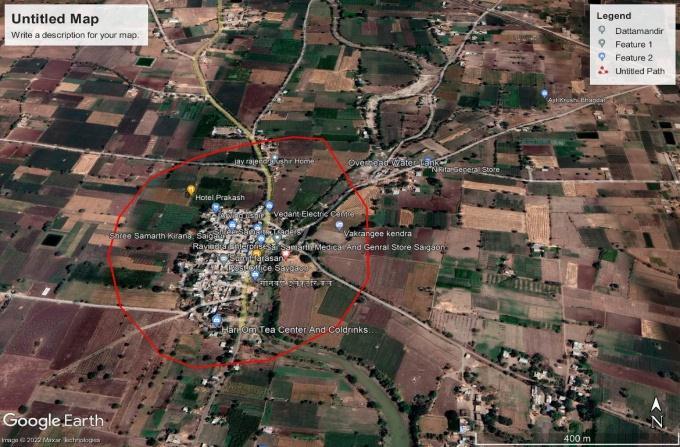
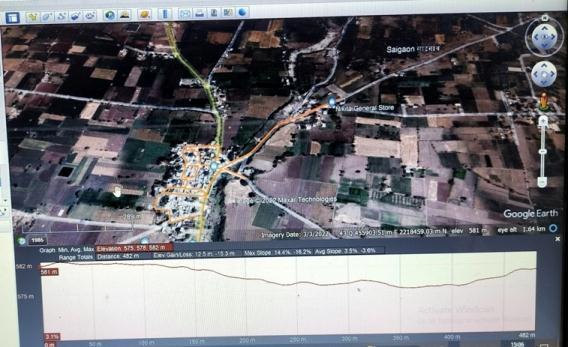
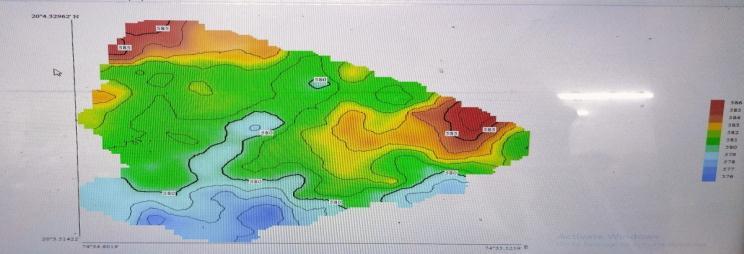
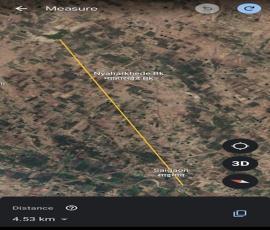
Collection of data like select area, population, water demand, source of water, etc. and calculate the reduce levelofthisareabyGoogleearth
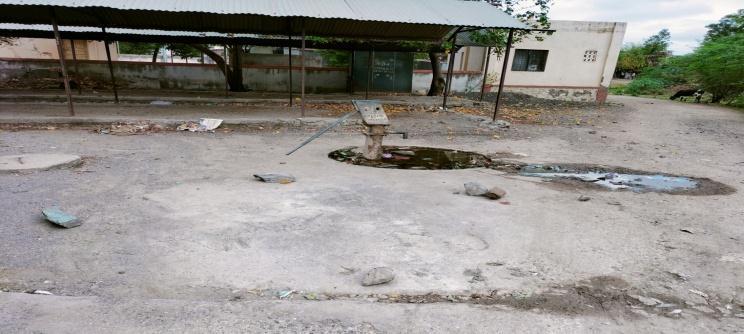
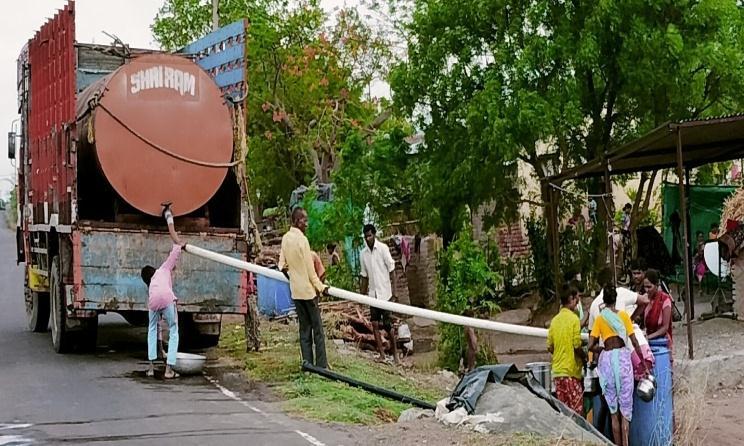
Imageno.7 SelectedareaForProjectwork
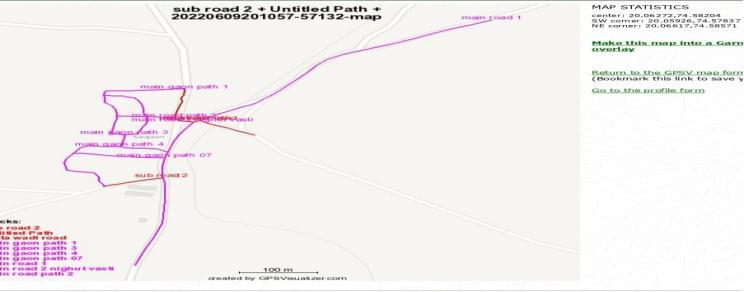
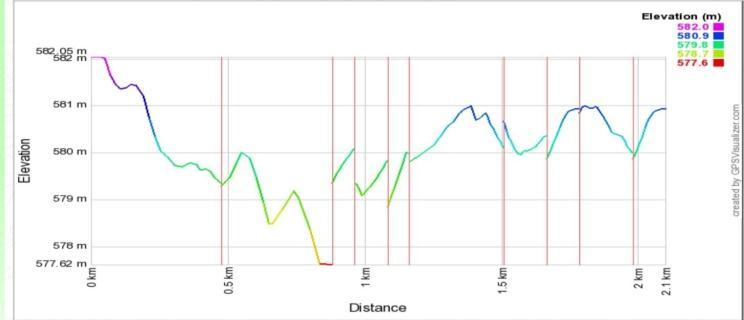
Imageno.8ProfileOfElevationThroughGoogleEarthPro 2.3.1.1Longitude,LatitudeandaltitudeDataPreparedFor WatergemsSoftwareInput.
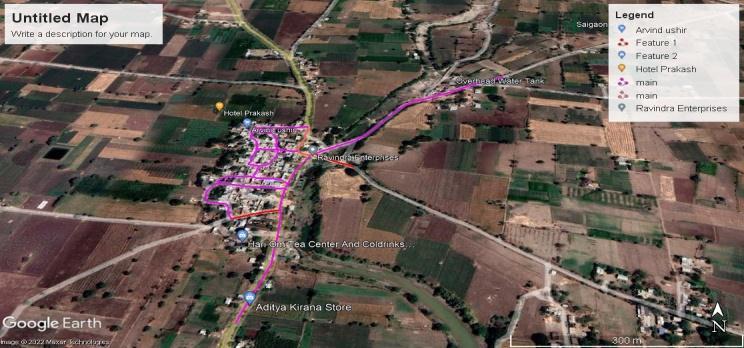
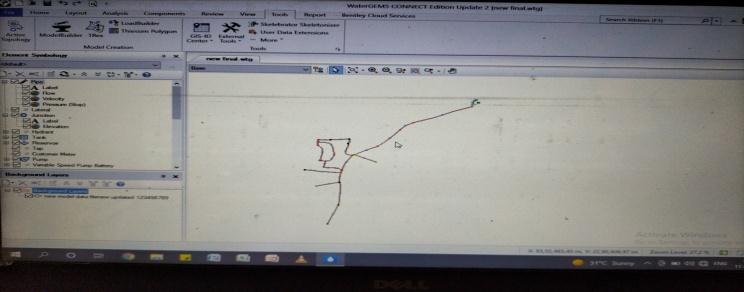
Imageno.9GoogleEarthProWaterDistributionNetwork
International Research Journal of Engineering and Technology (IRJET) e-ISSN:2395-0056
p-ISSN:2395-0072
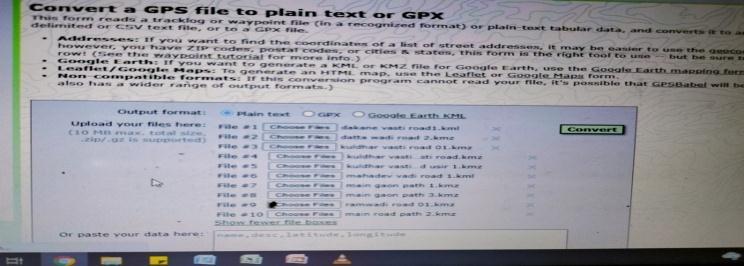
2.3.1.2 Input Data Required For Watergems Software:
Below table getting from Google earth map kml file convertedGPSFilethroughGPSVisulizerWebsitethenwe getbelowtableuseinWatergemsSoftware.
Subroad2
Sr.No. Latitude Longitude Altitude 1 20.0618 74.5806 578.8 2 20.0618 74.5806 579.0 3 20.0617 74.5806 579.2 4 20.0617 74.5800 579.5 5 20.0616 74.5800 579.9 6 20.0616 74.5799 580.0 7 20.0616 74.5799 580.0
Table -1: Latitude, Longitude, Elevation
Sr.No. Latitude Longitude(M) Altitude 1 20.0632 74.5810 579.3 2 20.0632 74.5810 579.3 3 20.0632 74.5809 579.2 4 20.0632 74.5808 579.1 5 20.0633 74.5807 579.1 6 20.0633 74.5807 579.1 7 20.0634 74.5807 579.2 8 20.0634 74.5808 579.3 9 20.0636 74.5808 579.4 10 20.0637 74.5808 579.5 11 20.0638 74.5808 579.6 12 20.0639 74.5808 579.7 13 20.0640 74.5808 579.8 14 20.0640 74.5808 579.8
Table -2: Latitude, Longitude, Elevation
MainGaonPath
Sr.No. Latitude Longitude(M) Altitude 1 20.06405 74.58089 579.8 2 20.06406 74.5809 579.8 3 20.06403 74.58051 580 4 20.064 74.58019 580.1
International Research Journal of Engineering and Technology (IRJET) e-ISSN:2395-0056
Volume: 09 Issue: 12 | Dec 2022 www.irjet.net p-ISSN:2395-0072
5 20.06401 74.58005 580.2 6 20.06401 74.57993 580.2 7 20.06394 74.57991 580.3 8 20.06381 74.57992 580.4 9 20.06372 74.57992 580.5 10 20.06362 74.58002 580.6 11 20.06354 74.58006 580.7 12 20.06341 74.58007 580.8 13 20.06331 74.58007 580.8 14 20.06318 74.58004 580.9 15 20.0631 74.58003 580.9 16 20.06303 74.58002 581 17 20.06297 74.57999 581 18 20.06295 74.57999 581 19 20.06293 74.58006 580.9 20 20.06292 74.58017 580.7 21 20.06284 74.58016 580.7 22 20.06276 74.58014 580.8 23 20.06267 74.58013 580.8 24 20.06261 74.58011 580.8 25 20.06259 74.58017 580.8 26 20.06258 74.58028 580.6 27 20.06257 74.58039 580.5 28 20.06257 74.5805 580.4 29 20.06255 74.58056 580.3 30 20.06251 74.58063 580.2 31 20.06248 74.58068 580.1 32 20.06247 74.58069 580.1
Table -3: Latitude, Longitude, Elevation
dattawadiroad
Sr.No. Latitude Longitude Altitude(M)
1 20.0632 74.581 579.4
2 20.0631 74.5811 579.5 3 20.0631 74.5813 579.7 4 20.063 74.5814 579.8 5 20.063 74.5815 579.9 6 20.0629 74.5816 580
7 20.0628 74.5817 580.1
MainGaonPath3
Sr.N. Latitude Longitude Altitude(M)
1 20.06292 74.58017 580.7
2 20.06293 74.58029 580.5 3 20.06299 74.58034 580.3 4 20.06308 74.58037 580.2 5 20.06316 74.58041 580.1 6 20.06323 74.58043 580 7 20.06329 74.58044 580 8 20.06336 74.58043 580 9 20.06342 74.58041 580 10 20.06348 74.58039 580 11 20.06355 74.58039 580 12 20.06367 74.58037 580.1 13 20.06377 74.58033 580.1 14 20.06383 74.58029 580.1 15 20.06385 74.58021 580.2 16 20.06387 74.58013 580.2 17 20.06388 74.58001 580.3 18 20.06391 74.57991 580.4
MainGaonPath4
Sr.No. Latitude Longitude Altitude 1 20.06261 74.58011 580.8 2 20.06261 74.58002 581 3 20.06261 74.57992 581 4 20.06262 74.57982 581 5 20.06263 74.57972 580.9 6 20.0626 74.57963 580.9 7 20.06255 74.57959 581 8 20.06247 74.57955 581 9 20.06241 74.57951 580.9 10 20.06236 74.57948 580.8 11 20.06229 74.57945 580.7 12 20.0622 74.57943 580.6
International Research Journal of Engineering and Technology (IRJET) e-ISSN:2395-0056
Volume: 09 Issue: 12 | Dec 2022 www.irjet.net p-ISSN:2395-0072
13 20.0621 74.57945 580.5 14 20.06203 74.57946 580.4 15 20.06201 74.5795 580.4 16 20.06198 74.57962 580.4 17 20.06197 74.57974 580.4 18 20.06195 74.5798 580.3 19 20.06187 74.57985 580.2 20 20.06178 74.57985 580.1 21 20.06174 74.57986 580.1 22 20.06166 74.57991 580 23 20.06162 74.57991 580
MainGaonPath7
Sr.No Latitude Longitude Altitude(M)
1 20.06234 74.58066 579.9 2 20.06234 74.58053 580 3 20.06235 74.58043 580.2 4 20.06234 74.58033 580.3 5 20.06237 74.58021 580.5 6 20.06236 74.5801 580.7 7 20.0624 74.57992 580.9 8 20.06243 74.57977 580.9 9 20.06245 74.57965 580.9 10 20.06245 74.57954 580.9
Table -7: Latitude, Longitude, Elevation
Mainroad1
Sr.N Latitude Longitude Altitude
1 20.06578 74.58464 582 2 20.06564 74.58434 582 3 20.06556 74.58417 582 4 20.06549 74.58401 581.7 5 20.0654 74.58385 581.5 6 20.06532 74.58371 581.4 7 20.06524 74.58356 581.4 8 20.06517 74.58342 581.4 9 20.06509 74.58323 581.4 10 20.065 74.583 581.2 11 20.06491 74.58281 580.7
12 20.0648 74.58264 580.3 13 20.06465 74.58251 580 14 20.06446 74.58238 579.9 15 20.06426 74.58224 579.7 16 20.06407 74.5821 579.7 17 20.06388 74.58194 579.8 18 20.06369 74.58175 579.7 19 20.06365 74.58167 579.6 20 20.06361 74.5816 579.6 21 20.06355 74.58151 579.6 22 20.06346 74.58135 579.6 23 20.06336 74.58121 579.5 24 20.06326 74.58107 579.3
Mainroad2nighutvasti Sr.N Latitude Longitude Altitude
1 20.06323 74.581 579.3
2 20.06295 74.58085 579.5
3 20.06277 74.58077 579.8
4 20.06261 74.58073 580
5 20.06234 74.58066 579.9
6 20.06213 74.58063 579.5
7 20.06188 74.58062 579
8 20.0617 74.58066 578.5
9 20.06161 74.58066 578.5 10 20.06127 74.58066 578.8 11 20.06088 74.58063 579.2 12 20.06071 74.58063 579 13 20.06035 74.58052 578.4
14 20.06005 74.58042 577.6 15 20.05966 74.5803 577.6
MainroadPath2 Sr.N Latitude Longitude Altitude
1 20.06333 74.58078 579.1 2 20.06333 74.58064 579.5 3 20.06336 74.58049 579.8
International Research Journal of Engineering and Technology (IRJET) e-ISSN:2395-0056
Volume: 09 Issue: 12 | Dec 2022 www.irjet.net p-ISSN:2395-0072
4 20.06336 74.58032 580.2 5 20.06337 74.58017 580.6 6 20.06338 74.58007 580.8
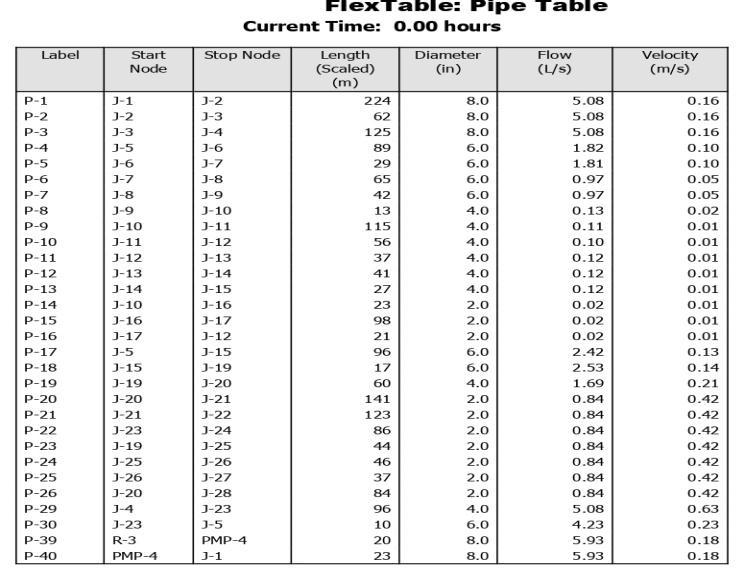
Total station Survey Sheet: After we get all Ground elevation Of Saigaon Village Then we easily put all the valuein WatergemssoftwareFor gettingaccurate results. aboveallgroundelevationverifiedwithtakingactualtotal station survey below the final survey sheet.
AboveTableshowsthatpipeP-1ToP-40 AlsoJunctionJ-1 ToJ-28,lengthofpipe,diameter,FlowandVelocityinthat particularjunctionandpipe.
.
Totalstationsurveywork(VisitDate:June24,2022)
Results:
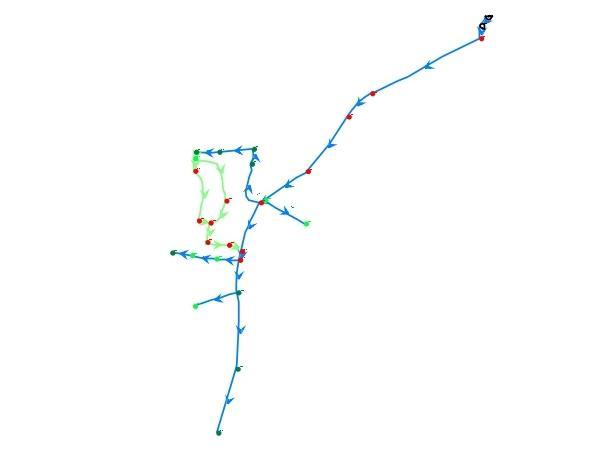
Above input data getting analysis by the watergemssoftwarethenwegetfollowingresults
Diagram No.01-Water Distribution In Saigaon Area By ColorCodingDiagramInWatergemsSoftware.
Cost estimation of water distribution pipe line:
From the planning of water distribution of Saigaon village total length of pipes planned per ward are as below.
International Research Journal of Engineering and Technology (IRJET) e-ISSN:2395-0056
Volume: 09 Issue: 12 | Dec 2022 www.irjet.net p-ISSN:2395-0072
Estimation cost for water distribution pipe:
Sr no Network Name Length Rate per meter Cost(Rs)
J-17 580.3 0.02 1344.48 1085
J-19 580.4 0.02 1344.47 1085
J-20 580 0.02 1344.47 1085
13105
2 Untitledpath 121m 19602
3 Maingaonpath 347m 52214
4 DattaWadiRoad 464m 75168
5 MainGaonPath3 162m 26244
1 Subroad2 80m 162rs/ meter
6 MainGaonpath4 198m 32076
7 Maingaonpath7 119m 19278
8 Mainroad1 480m 77760
9 Mainroad2nighutv ast 412m 66744
10 Mainroadpath2 76m 12312
TotalcostofBranchpipe 394503/TotalcostofMainandBranchpipe 1599483/-
Above Cost are approximately for getting idea the project suitabilitythathelpthegrampanchayat.
Label Elevatio n (M) Demand (L/s) Hydraulic Grade M Pressure (psi)
J-1 582 0.93 1344.45 1082
J-2 581.7 0.02 1344.45 1083
J-3 581.5 0.02 1344.46 1083
J-4 581.2 0.05 1344.46 1083
J-5 581.2 0.02 1344.48 1083
J-6 579.3 0.02 1344.48 1086
J-7 579.1 0.87 1344.49 1086
J-8 579.8 0.02 1344.49 1085
J-9 580.3 0.87 1344.48 1085
J-10 580.5 0.02 1344.48 1084
J-11 580.6 0.02 1344.48 1084
J-12 580.8 0.02 1344.48 1084
J-13 580.9 0.01 1344.48 1084
J-14 581 0.02 1344.47 1084
J-15 581 0.02 1344.47 1084
J-16 580.2 0.02 1344.48 1085
J-21 579.9 0.02 1344.46 1085
J-22 579.5 0.85 1344.46 1086
J-23 579 0.01 1344.48 1087
J-24 578.5 0.85 1344.48 1087
J-25 578.5 0.01 1344.47 1087
J-26 578.8 0.01 1344.47 1087
J-27 579.2 0.85 1344.47 1086
J-28 579 0.85 1344.46 1087
Table shows Final Result
Wecanconcludethatwaterdistributionnetwork using watergems software for Saigaon Village, Very first we need elevation of ground that we getting from Google earth pro software after getting elevation and location of village we can find out contour map also latitude, longitude and elevation from KML File from getting Google earth pro software, all this file converter in as drawing in auto cad 2d. We get shape file this file are the maininputdataforwatergems,thissoftwareveryadvance versionofWaterCAD.
We can conclude that we design pipe 2”-703 meters pipe, 4”-385 meters pipe 6”-348 meters pipe, 8”411meterspipe
The approximate cost of project that is Total cost of Branch pipe -394503/- Rs and Total cost of Main and Branchpipe-1599483/-rupeesonly
[1] Dilip Babubhai Paneria,“Analyzingtheexisting water distribution system of Surat using Bentlys Watergems”, International Journal Of Advance ResearchinEngineering,ScienceManagement.
[2] Prof. A.G.Chaudhari, “Experimental investigation by WaterGEMS software for redesign of water distribution system of Bhavani Mata ESR”, International Journal Of Advance Research in Engineering, Science Management.vol.no.6, issue no.03,march2017.
[3] Shinde Parmanand Bhaskar, “Feasibility Analysis of Water Distribution System for Yavatmal City using Water Gems Software”, International Journal Of
International Research Journal of Engineering and Technology (IRJET) e-ISSN:2395-0056
Volume: 09 Issue: 12 | Dec 2022 www.irjet.net p-ISSN:2395-0072
Innovative Research in Science, Engineering and Techomolgy.vol.6,issue7,july2017.
[4] A.Gheisi, M.forsyth, “Water distribution systems reliability”, International Journal Of Technical Research and Application.www.ijtra.com vol3,issue5(sep-oct2015),pp.174-178.
[5] MandarG.Joshi,NitinP.Sonaje.“Areviewofmodeling and application of water distribution network softwares”.
[6] Sajedkhan S. Pathan, Dr. U.J.Kahalekar, “Optimal design of water distribution network by using WaterGEMS”,IJPRET,2015;vol3(8):308-319.