1
Keywords: Machine Learning, K means, R Programming, supervised and unsupervised learning.
2HOD, Dept. of Computer Engineering, Sant Gajanan Maharaj Rural Polytechnic, Mahgaon, Maharashtra, India ***
I. INTRODUCTION
1.SupervisedLearning 2. UnsupervisedLearning
ABSTRACT: Machine learning (ML) is that the growing technology and scientific study of algorithms that enables withusedalgorithmunsupervisedinpreviousmathematicalMachinecomputerstofindoutautomaticallyfrompreviousknowledge.learningusesnumerousalgorithmstocreatemodelsandmakespredictionsexploitationknowledgeavailable.Machinelearningisartificialtelligentapplication.Machinelearningeithersupervisedorlearning.KMeansismosttypicallyusedthatisunsupervisedlearningalgorithmicprogramforclusteranalysis.DuringthispaperwetendtoworkedtheimplementationofKMeansandRProgramming.
Machine Learning, K-means Algorithm Implementation with R Mrs. Kavita Ganesh Kurale , Mrs. Rohini Sudhir Patil
Someresultsautomaticallymmakeinstruction,usingresultsdataimplementationpreviouslyautomaticallyintelligenceMachinelearningisoneofanapplicationofartificial(AI).InMachinelearningthesystemscanlearnandimprovetheperformancebyusingcalculatedresultsMachinelearningfocusesonofnewcomputerprograms.ItcanaccessandusethisdatathenlearnnewthingsandcalculateThelearningcanbestartsbyobservingknowledge,directexperienceonpreviouslyusedknowledge,orandthenpatternsarecalculatedinthatdataanddecisionsinthefuturebasedontheexamples.Theainaimistoallowthecomputerslearnwithoutmanualinterferenceandcomputebasedonalreadycomputedresults.MachineLearningMethods
Semi supervised machine learning algorithms fall nearly in between supervised and unsupervised learning, ofcognitiveproperlshouldidentifygenerallyperformsknownneededactionsandmaximizecharacteristicsandproducinglearningresources.uresourceswhenaccuracy.approachquantumgenerallysincetheyusebothlabeledandunlabeleddatafortrainingasmallquantumoflabeleddataandalargeofunlabeleddata.ThesystemsthatusethisaresuitabletoconsiderablyimprovelearningGenerally,semisupervisedlearningischosentheacquiredlabeleddatarequiresgoodandrelevantinordertotrainit/learnfromit.Else,acquiringnlabeleddatagenerallydoesnotrequireadditionalReinforcementmachinelearningalgorithmsisaapproachthatinteractswithitsenvironmentbyactionsanddiscoversbreachesorrewards.Trialerrorsearchanddelayedrewardarethemostapplicableofreinforcementlearning.Inordertoitsperformancethisapproachallowsmachinessoftwareagentstoautomaticallydeterminetheidealwithinaspecificcontext.Simplepricefeedbackisfortheagenttolearnwhichactionisstylish;thisisastheunderpinningsignal.Machinelearninganalysisofhugequantitiesofdata.Whileitdeliversfaster,moreaccurateresultsinordertoprofitableopportunitiesordangerousrisks,italsorequireextratimeandalsoresourcestotrainity.CombinationofmachinelearningandAIandtechnologiescanturnitintoeffectiveinprocessinglargevolumesofinformation.
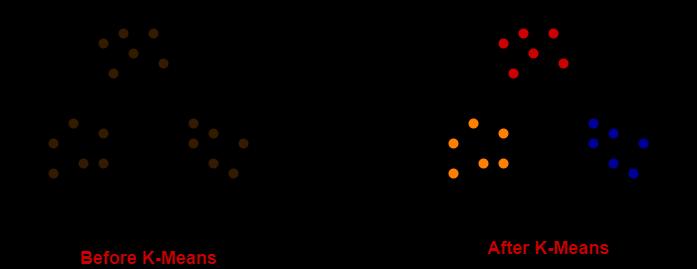
III. Clustering Clustering is the most popular approach in unsupervised learning where data is grouped based on the similarity of the data points. Clustering has numerous real life usages where it can be used in a varietyofsituations.Clusteringisusedincolorfulfields like image recognition, pattern analysis, medical informatics,genomics,datacompressionetc.inmachine
International Research Journal of Engineering and Technology (IRJET) e ISSN: 2395 0056 Volume: 09 Issue: 01 | Jan 2022 www.irjet.net p ISSN: 2395 0072 © 2022, IRJET | Impact Factor value: 7.529 | ISO 9001:2008 Certified Journal | Page1268
II. Classes of Machine Learning
2
trainlearningerrorscanalsocompareitsoutputwiththecorrectoutputandfindinordertomodifythemodelaccordingly.Inoppositetothepresent,unsupervisedmachinealgorithmsareusedwhentheknowledgeusedtoisnotclassifiedorlabeledThesystemdoe sn’tfigure outtherightoutput;howeveritexplorestheknowledgeand might draw inferences from datasets to describe hidden structuresfromunlabeleddata.
Supervisedmachinelearningalgorithms
supervised learningisalearning,wetrainthemachineheresomedata is givenwhichisprovidedwith thecorrectanswer.After that, the machine is provided with a new data set then machineagainforced workonthatnewlydatasetsothat supervised learning algorithm analyses the training data setoftrainingexamples andproducesacorrectoutcome from sorted data.After sufficient training the system providestargetsforanynewinput.Thelearningalgorithm
1Sr. Lecturer, Dept. of Computer Engineering, Sant Gajanan Maharaj Rural Polytechnic, Mahgaon, Maharashtra,India.

TheKMeansalgorithmisverysimple[3]:
5. Foreachclusterindatasetnewglobalcentroidare computed. K means algorithm Properties[3]: 1. Efficientwhileprocessinglargedataset. 2. Itworksonlyonnumbervalues.
3. Theclustersshapeisconvex.
EuclideandistanceFormula V. Implementation of K Means with R Programming
>vector1< c(1,1.5,2,2.5,3,3.5,4,4.5)
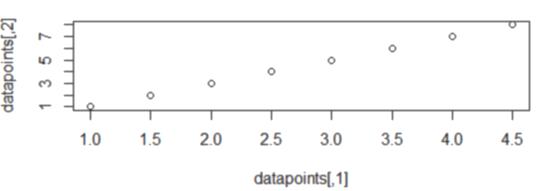
>datapoints< array(c(vector1,vector2),dim =c(8,2)) >print(datapoints)ThedataPointsdefinedhereisa2 Darray.Thefirst columnindicatedtheXcoordinates,andthesecondcolumn representY coordinates. Itisdefinedasshownbelow: [,1][,2] [1,] 1.0 1 [2,] 1.5 2 [3,] 2.0 3 [4,] 2.5 4 [5,] 3.0 5 [6,] 3.5 6 [7,] 4.0 7 [8,] 4.5 8Now in following diagram we plotted the data points and visualize them using theplotfunction in R programming.Theoutputisshownasbelow: >plot(datapoints)
1. SelectthevalueofInitialcentroidsi.e.K. 2. Repeatstepno3andstepno4foralldatapointsin givendataset. 3. Findtheclosest data point from thosecentroidsin theDataset. 4. Form K cluster. Clusters are formed by assigning eachpointtoitsnearestcentroid.
International Research Journal of Engineering and Technology (IRJET) e ISSN: 2395 0056
Objective of the K means
Journal | Page1269
Heresomerandomdataisgenerated.Twovectors are defined vector1 and vector2 and create a 2 D array named data points which defines data points i.e. (x,y) coordinatepairs.
>vector2< c(1,2,3,4,5,6,7,8)
Volume: 09 Issue: 01 | Jan 2022 www.irjet.net p ISSN: 2395 0072 © 2022, IRJET | Impact Factor value: 7.529 | ISO 9001:2008 Certified
IV. K MEANs Clustering K MeansClusteringK meansisoneofthe simplest unsupervised learning algorithms that answer the well known clustering problem. The procedure followsaneasyandstraightforwardMethodtoclassifya given data set througha particularnumber of clusters. Themainthinghereisforeverycluster;definekcenters, one for each. These centers should be placed during acunningway duetodifferentpositioncausesdifferent result.So,thebetterchoiceistoplacethemisimportant as possible far away from each other. Figure below K MeansClustering Thenextstepistotakeeachdatapoint fromagivendatasetandassignittothenearestcenter. When all data point completed,the primarystep is completed and an early group ageis completed. At this point we need tore calculate k new centroids of the clustersresultingfromthepreviousstep.(1)
Step 1: Generation of Data
learning this is part of the unsupervised learning algorithm.Thisisbecausethedata pointspresentaren't labeled and there's no explicit mapping of input and outputs.
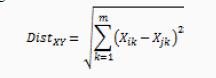
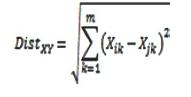
The objective of the K means clustering is to minimizetheEuclideandistancethateachpointhasfromthe centroidofthecluster.
>plot(datapoints[,1],datapoints[,2])
CalculatethedistancebetweenthecorrespondingX andYcoordinatesofthedata pointsandthecentroid. Calculatethesumofthesquareofthedifferencescomputed inStep1. Find the square root of the sum of squares of differences which is calculated in Step 2. Difference:datapointi centroid dist_frm_clst1< (datapoints[,] centroid[1,])^2 [5,][4,][3,][2,][1,]>tot_dist=array(c(dist_frm_clst1,dist_frm_clst2),distancespoiHere1.802776[1]>>dist_frm_clst2=sqrt(dist_frm_clst2[,1]+Addition>dist_fSquare3.0413813[1]>>dist_frm_clst1=sqrt(dist_frm_clst1[,1]+dist_frm_clst1[,2])dist_frm_clst10.70710681.80277561.58113881.11803403.80788666.0415230[8]5.2201533ofdifference:(datapointicentroid)2rm_clst2=(datapoints[,]centroid[2,])^2andSquareroot:dist_frm_clst2[,2])dist_frm_clst21.4142144.6097721.0000002.6925823.1622785.3851653.041381thedist_frm_clst1isthedistancewhichisbetweeneachntandthecentroid1.Likewise,wecalculatetheforcentroid2.dim=c(8,2))tot_dist[,1][,2]0.70710681.4142141.80277564.6097721.58113881.0000001.11803402.6925823.80788663.162278
We will initialize 2 clusters with 2 centroids (1.5, 2) and >>>>(3,5).k=2c1=c(1.5,2)c2=c(3,5)centroid=array(c(1.5,2,3,5),dim=c(k,2))
>print(centroid)Wedefine
Step 2: Initiate Random Centroids for k-Clusters
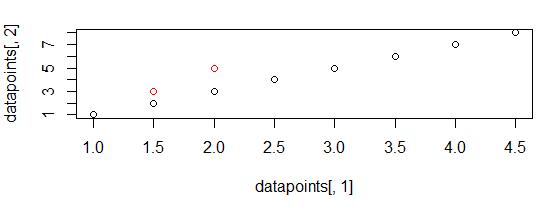
>points(centroid[,1],centroid[,2],col="red") Step 3: From each point Distance Calculation Distancebetweenthecentroidandtheremainingpointsare calculatedusingEuclideandistanceformula.TheEuclidean distanceisdefinedasfollows: We will use the above equation above in the followingsub section.HerewearecalculatedtheEuclidean distanceformulainthreesteps
thek=2numberofclusters.Anarrayof two co ordinate pairs is the centroids. the two clusters is shown below is the arraycentroidcontaining the coordinates: [,1][,2] [1,] 1.5 3 [2,] 2.0 Using5theplotfunction ,Wewillplotthedatapoints and the initial centroids on the same plot. We use thepointsfunction to specify the centroids,. Thepointsfunction is used to highlight points of interest usingdifferentcolors.Centroidsarerepresentedusingthe colorred.
International Research Journal of Engineering and Technology (IRJET) e ISSN: 2395 0056
Volume: 09 Issue: 01 | Jan 2022 www.irjet.net p ISSN: 2395 0072 © 2022, IRJET | Impact Factor value: 7.529 | ISO 9001:2008
Certified Journal | Page1270
[2] International Journal of Information & Computation Technology.ISSN0974 2239Volume4,Number17(2014),
> [2,][1,]new_centroid[,1][,2]1.6666672.3333333.4000005.800000
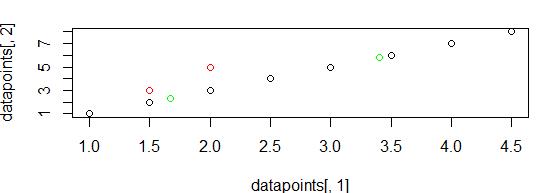
> figu>points(new_centroid[,1],new_centroid[,2],col="green")points(centroid[,1],centroid[,2],col="red")Theoldandupdatedcentroidsareshownintherebelow.
Kmeansclusteringisoneofthemostpopular and widely used clustering algorithms, usually the apply when solving clustering tasks to get an idea of the structure of the dataset. The main aim of kmeans algorithm is to group data points into distinct non overlapping subgroups such that single group contain sametypeofdata item.Hereweimplemented Kmeans algorithm using r programming and computed new global centroid for clusters successfully. Data is generated using vector in r and Euclidean distance formula is used for distance calculation. We calculated distance using mean function in r and new centroid plotted on graph. Hence we followed all K means algorithmstepsforcentroidcomputation
Let’s plot the new centroids using the following plot(datapoints[,1],code:datapoints[,2])
Step 4: Compare, finalize the Closest Centroids
International Research Journal of Engineering and Technology (IRJET) e ISSN: 2395 0056 Volume: 09 Issue: 01 | Jan 2022 www.irjet.net p ISSN: 2395 0072 © 2022, IRJET | Impact Factor value: 7.529 | ISO 9001:2008 Certified Journal | Page1271 [6,]3.04138131.802776 [7,]6.04152305.385165 [8,]5.22015333.041381
Using the logical vector above, we obtain the elementsofthefirstcluster.Theoperationusedbelowisan exampleofconditionalselection.Elementsthatsatisfythis conditioninthearraydataPointsareprinted. datapoints[,1][c(tot_dist[,1]<=tot_dist[,2])] [1]1.01.5To2.5findthecentroidofthenewlyformedcluster,we takethemeanofallthepointsobtainedabove.Thethinking isasfollows:Weneedtofindapointclosesttoallthecluster
VI. CONCLUSION
[1]InternationalJournalofPureandAppliedMathematics Volume117No.72017,157 164ISSN:1311 8080(printed version); ISSN: 1314 3395 (on line version) url: http://www.ijpam.eu Special Issue “A k means Clustering AlgorithmonNumericData”
>>arraycoordinatesusingtot_dist[,2])]))tot_disc1[1]centroid.conditionallyfunction>mean(datapoints[,1][c(tot_dipointdatapoints.Therefore,averagingthedatapointsresultsinaclosesttotheremainingpoints.st[,1]<=tot_dist[,2])])WecalculatethemeanusingtheRmean.Thisisanexampleofhowweselectelementsthatbelongstoaclusterandhowwefindits1.666667=c(mean(datapoints[,1][c(tot_dist[,1]<=t[,2])]),mean(datapoints[,2][c(tot_dist[,1]<=WecomputetheXandYcoordinatesofthecentroidthecodeabove.WestoretheXcoordinateinc1andyinc2.Wecopythedataintheseliststoanewcallednew_centroid.new_centroid[1,]=c1new_centroid[2,]=c2
Thenew_centroidcontainstheupdatedcentroidof the formed clusters. Therefore, we have implemented the algorithmsuccessfully.
REFERENCES
Let’s create a logical comparing vectordist_frm_clst_1anddis_frm_clst2.Thisvectorwillbe made up of the Boolean valuesTRUEandFALSE.For examplecreatethisvectorusingaconditionalstatement. We write the condition as follows: distance to the first clusterislessthanthesecondcluster’sdistance.Pointshere that satisfy given condition belong to cluster 1. The remainingpoints arebelongstocluster2. c(tot_dist[,1]<=tot_dist[,2]) [1]
TRUE TRUEFALSE TRUEFALSEFALSEFALSEFALSE
andInfocom[3]Clusteringhttp://www.1860©InternationalResearchPublicationsHouseIrphouse.comAReviewONKmeansDATAAPPROACH20176thInternationalConferenceonReliability,TechnologiesandOptimization(ICRITO)(TrendsFutureDirections),Sep.2022,2017,AIIT,Amity
r for data science/
“ADetailedStudy https://data flair.training/blogs/using
UniversityUttarPradesh,Noida,India
of ClusteringAlgorithms” [4]
International Research Journal of Engineering and Technology (IRJET) e ISSN: 2395 0056 Volume: 09 Issue: 01 | Jan 2022 www.irjet.net p ISSN: 2395 0072 © 2022, IRJET | Impact Factor value: 7.529 | ISO 9001:2008 Certified Journal | Page1272 pp.1847