1. Traffic congestion is one of the worldwide urban problems, which can lengthen journey time, increase energy consumption,aggravateenvironmentpollutionandresultintrafficrelatedproblems.
2. PROBLEM STATEMENT
International Research Journal of Engineering and Technology (IRJET) e ISSN: 2395 0056 Volume: 09 Issue: 01 | Jan 2022 www.irjet.net p ISSN: 2395 0072 © 2022, IRJET | Impact Factor value: 7.529 | ISO 9001:2008 Certified Journal | Page1051 “STUDY AND DESIGN OF DIGITAL TRAFFIC MAP USING GOOGLE EARTH FOR SCHOOL BUSES NEAR NAVLE BRIDGE” A. T. Gavhane1, Y. S. Kolhe2 , R. R. Lavidya3, D. V. Tandale4 Lecture, Department of Civil Engineering, Sou.Venutai Chavan Polytechnic, Pune 41 Maharashtra, India Third Year Student of Diploma in Civil Engineering Sou.Venutai Chavan Polytechnic, Pune 41 Maharashtra. *** Abstract
1. INTRODUCTION
Google earth is one of the most innovative advances in the study of geography. Google earth has a major impact on geographicanalysisandonbusinesspracticeingovernmentandtheprivatesector.Mosttransportationagenciesnowuse Google maps and Google earth and Geospatial Information Systems for Transportation is one of the largest users of this technology’s. These capabilities enable transit agencies to geo reference their bus routes, stops, time points, and other featurestoadigitalstreetcenterlinefile,andkeepallthesedatainsynch.Googleearthisafeatureloadedtoolbutyetnot sofamousapplication.Thisstudywilltrytoenlightenoneofthemanywaysbywhichgoogleearthcanbeusedtocontrol trafficlesstravellingforbuses.Theresultsshowingmapsincludingrouteforbuses,theirstopsand theirdetailscouldbe very helpful for a less time consuming traveling for buses. Google earth is a mostly used mapping platform all over the world but yet its most of the feature are still unknown to mankind. This study is particularly based on bus system of Sinhagadschoolsituatedinambegaoncampus. SinhagadSchoolAmbegaonCampusislocatedinPuneonLatitude18.4682˚NorthandLongitude73.8363˚atthecenterof PuneCitywhichisoneofthewell knowncollegeinPune,thecollegesitsonanapproximatelandmassof32hectares,with an estimated student population of about 10,000+ Different maps describe the relationship of the study area. One of the first roads with most traffic in Pune is the NH4 bypass which links Katraj to Vadgaon Navale brigde. Unfortunately, this road is a National Highway which links Pune to Bangalore. The bus route data was collected and imported into Google earthplatformwhichshowsroadfeatureswithintheareaofstudyweredigitizedandgroupedintolayers.
2. Due to uneven departure of School buses from the station (Starting point), the lot of traffic has been recorded nearNavaleBridge,VadgaonBridgeandAnandnagarwhichresultsindelay.
3. The system still keeps the record of every bus like its departure time, number of students travelling in the bus Driver’s details pick up stations, engine details, travelling details etc; in a hand written books which they would havecomputerizedforfurtherprocess.
Over the years, Digital mapping Systems technology has been implemented for a variety of purposes within the transportation field. With this many new uses, benefits, and challenges have raised. This study tries to show the capacity of Google earth to support transportation analysis and planning. The goal of this study is to show to which extent Google earth application is used in transportation for School near navle bridge. This project provides examples of how Google earth is being useful in practice for transportation arrangement for school buses. This project could help colleges and schools to understand and applied Google earth for solving their traffic issues. This will reduce traffic problems of buses as well as time which these buses consumed to travel around the city. With the help of Google earth the slow moving or highly congested traffic areas are indicated and could determine the fastest way to your destination. Most departments use Google earth , Google maps and GIS for transportation .This project is going to cover many such important topics for the betterment of traffic conditions of school buses. The goal of this paper is to analyze traffic congestions in selected routes i.e. School to navale brigide, Navale bridge to Vadgoan brige and sinhgad road in the City of Pune. The study suggested several improvements that can be executed in order to have a more easy and computerized system which useful for organization.The last part of this study examined the development of spatial and attribute database to reduce the traffic congestion and to propose another route to avoid traffic congestions.
Key Words: Traffic study, Microsoft Excel, Digital map, Google Earth etc.

D. ShowthecontributionandthepracticalapplicationofGooglemapsandGoogleearthintransportationfieldusing casestudies. ThefinalStepistorecommendsuggestionsforimprovementofdigitalmapapplicationintransportationfield.
A. Understand basics of this application and clear doubts for those who are looking forward to use this Digital application.
5.
International Research Journal of Engineering and Technology (IRJET) e ISSN: 2395 0056 Volume: 09 Issue: 01 | Jan 2022 www.irjet.net p ISSN: 2395 0072 © 2022, IRJET | Impact Factor value: 7.529 | ISO 9001:2008 Certified Journal | Page1052 3. AIM I) Tomakedigitalmapforschoolbuses. II) Findthelocationsandpointswheretrafficcongestionoccurs. 4. STUDY AREA
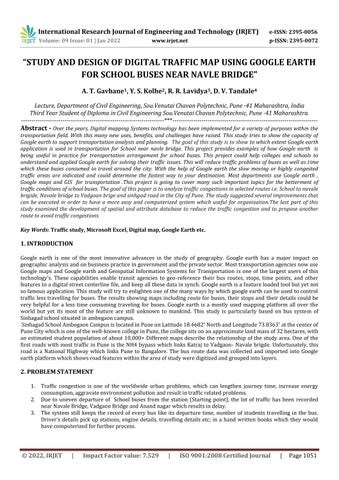
Themanyinstituteshavemorethan500busesworkingacrossPunecity.Afterdiscussingwithourauthorityandguidewe decided to choose this area for our research. These buses travel across Ambegaon, Dhayari, Katraj, and other nearby locationsinPune. 1showstheactuallocationongooglemapofareawhichislocatedinVadgoanandAmbegaonPune METHEDOLOGY
Fig
C. Reviewingtechnologysuchasusinginternetdigitalmapsintransportation.
E.
B. Exploresomepublishedworksaboutdigitalmapapplicationsintransportationanalysisandplanning.
Fig 1 : ShowingStudyAreaNearNavaleBridge

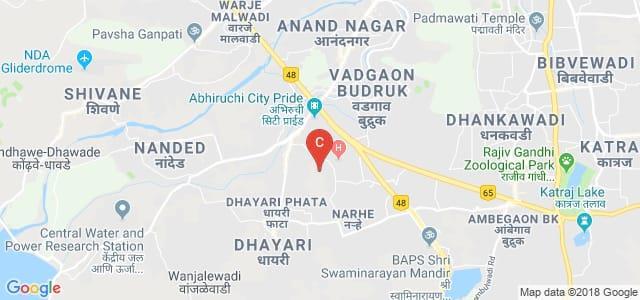
International Research Journal of Engineering and Technology (IRJET) e ISSN: 2395 0056 Volume: 09 Issue: 01 | Jan 2022 www.irjet.net p ISSN: 2395 0072 © 2022, IRJET | Impact Factor value: 7.529 | ISO 9001:2008 Certified Journal | Page1053 6. FLOW CHART Chart 1:Projectmythologyflowchart 7. SAMPLE DATA WecollecteddataformInstituteTransportationFacilitiesfromtransportoffice.Itshowsintermediatepointsonmapsand theroutestowhichitfacilitatesitsbuses.InTableISerialnumberwhichisgivenforeverybus,Source,Intermediatepoints (P1,P2,P3,P4)anddetailsofallbusesarementionedsuchasSr.number,dailyrunningkilometers,inandouttime.Forthis studyweareusingrandom22busesdataforresearchwork. Table I : Sampledatawhichshown routepointsand allinformationrelatedtoschoolbuses. StudyStatementProblemArea Collection of Data UnderstandingUnderstandingtheGoogleEarththeGoogleMapsCreationofMapson Google Earth ConclusionResults

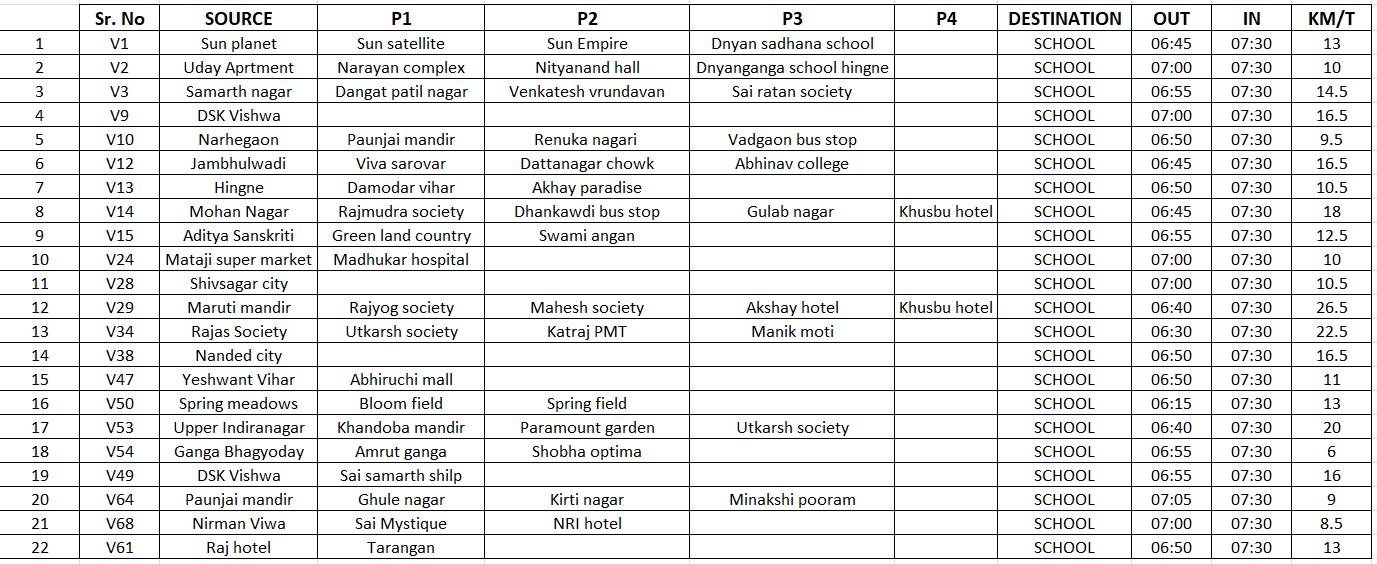
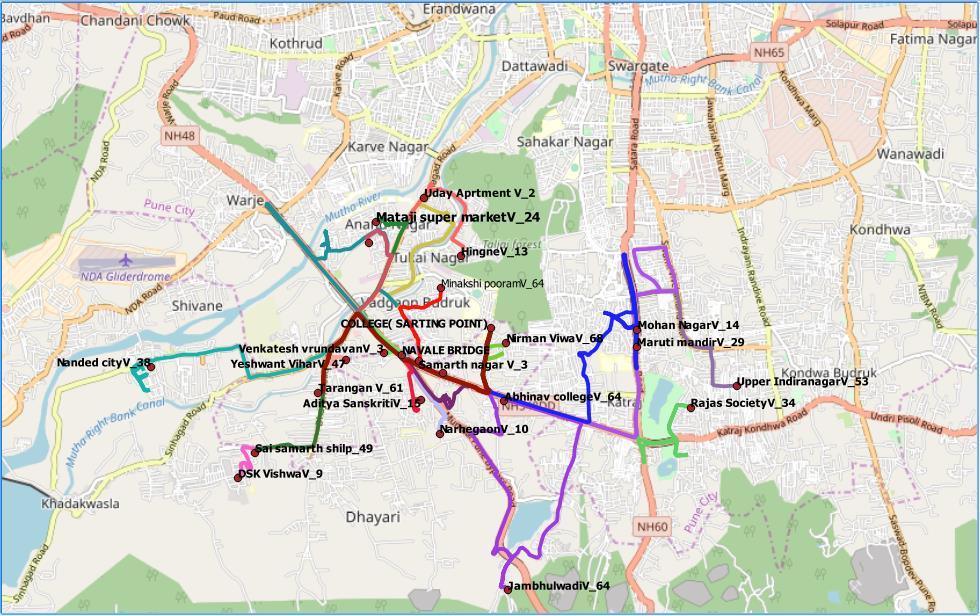
International Research Journal of Engineering and Technology (IRJET) e ISSN: 2395 0056 Volume: 09 Issue: 01 | Jan 2022 www.irjet.net p ISSN: 2395 0072 © 2022, IRJET | Impact Factor value: 7.529 | ISO 9001:2008 Certified Journal | Page1054 8. RESULTS Fig 3: Digitalmapshowinglayersofbusesroute Fig 4: DigitalmapshowingallbusesrouteonGooglemap


WeconcludethatthetrafficcongestionisthemainproblemduetoSchoolbusesandwhichalsoledtoairpollutionthatis shown our results which we get after study. On the basis of collected data, we traced some specific location and points where traffic congestion is high due to School buses. Every single bus travelling throughout the Pune city can be located andonthesametimewecanalsogetinformationaboutthenumberofstudentstravelling,upcomingstops,busdetailsand theapproximatetimeofreachingthenextstopaccordingtotrafficconditioninasingleclick.
Wehavethedatarelatedtodifferentaspectsandourresearchisbeingcarriedoutaboutenvironmentorpollutionrelated, trafficstudyanalysis,scheduleandfixingtheroutetoo.Thiscouldalsocontributetobetterfacilitationofroads,routesand discoveringnew ideas fordecreasing trafficjamsand fast movingvehicles. We created 22 buses map forthisstudy work.
9. CONCLUSION
10. FUTURE SCOPE
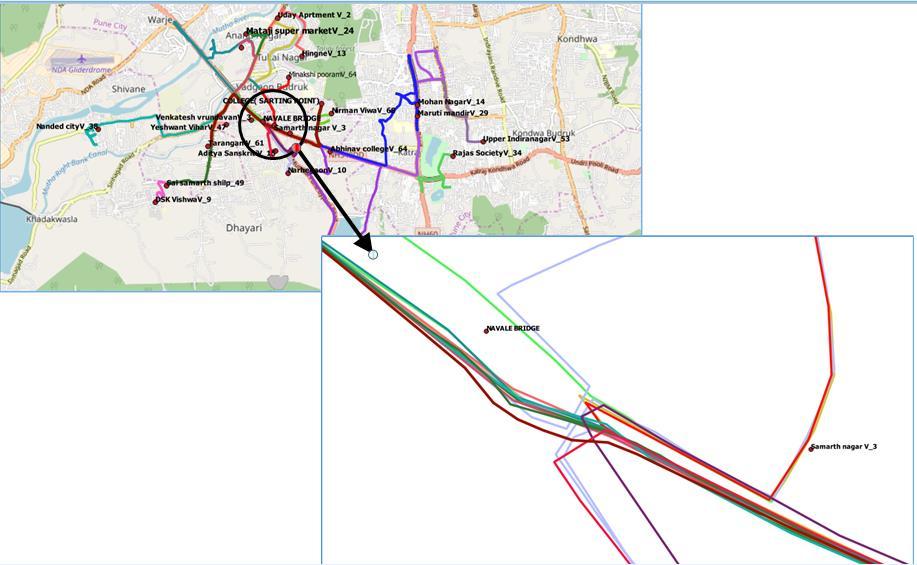
Fig 5: Digitalmapshowingtrafficcongestionatnavalebridge. The route of each bus is plotted and sources point, intermediate points and destinations are linked on Google earth respectivelyasoneofthedatasource.Thesearetheroutestravelledbyvariousschoolbuseseverydayalloverandoutside thePunecity.AccordingtoourmapweanalyzethatmostofthestudentscomesfromDhayari,VadgaonandAnandnagar. SomeplaceswherebusesgetrepeatedlystuckareatNavleBridge,Vadgaonbridge,Dhayarimainchowk,BalajiNagarand many more. After analyzing the data we came to know that this Buses are running 34391 km per month and diesel consumedbythemisapproximately7583literpermonth(allbuses). ThisstudyledtotheconclusionthatthemajorhighwayofNavalebridgearearecordedtheheaviesttraffic.This wasbased on the observed data, which was linked to a database that enabled us to manipulate it. The region of Ambegaon has recordedtheModeratetraffic.
International Research Journal of Engineering and Technology (IRJET) e ISSN: 2395 0056 Volume: 09 Issue: 01 | Jan 2022 www.irjet.net p ISSN: 2395 0072 © 2022, IRJET | Impact Factor value: 7.529 | ISO 9001:2008 Certified Journal | Page1055

[4] Wu, Y. J., Wang, Y. and Qian, D. (2007). A Google Map Based Arterial Traffi c Information System. Presented at 10thInternationalIEEEConferenceonIntelligentTransportationSystems,Seattle,Washington,USA.
[3] Seymour, E. J., Miller, B. (2007). Google Based Mapping System for Traffic c Management Center Web Navigation. Presentedatthe86thTransportationResearchBoardAnnualMeeting,Washington,DC.
[2] PurvisM.,SambellsJ.,andTurner,C.(2006).BeginningGoogleMapsApplicationswithPHPandAJAX:FromNoviceto Professional.Springer Verlag,Inc.,NewYork.
[6] E. Florido, O. Casta˜no, A. Troncoso, F. Mart´ınez ´Alvarez. Data mining for predicting traffic congestion and its applicationtoSpanishdata.IEEEpapers2015
[1] Bao, J. G., 2008. Development of a GIS based transport network analysis system, Master Thesis, Graduate School of RegionalStudies,GifuUniv. M.Young,TheTechnicalWriter’sHandbook.MillValley,CA:UniversityScience,1989.
International Research Journal of Engineering and Technology (IRJET) e ISSN: 2395 0056 Volume: 09 Issue: 01 | Jan 2022 www.irjet.net p ISSN: 2395 0072 © 2022, IRJET | Impact Factor value: 7.529 | ISO 9001:2008 Certified Journal | Page1056 Ouraiminfutureistomakemapforallbuses.Wearealsothinkingabouthowtoachievetheeconomyandreducethedaily runningcostbecausehugeamountisspendonthetransportationfacilityforschools. Sincenooneispayingattentiontothisproblem,itwouldaffecttheenvironmentandtrafficmanagementverybadly,so ourprojectisbasedontheproblemtowardsfindingbettersolutionforinstitute. REFERENCES
[7] Sandeep G. Panchal1, Ravindra S. Apare2 Engineering Student, Smt. Kashibai Navale College of Engineering Pune, Savitribai Phule Pune University, India. A Survey on Traffic Detection from Twitter Tweets Analysis. International JournalofScienceandResearch2015
[5] Google(2008),GoogleMapsAPI,http://www.google.com/apis/maps/.AccessedJuly,29,2008.