The soil used inthisstudywas Intermediate plasticclayey soil(CI)whichwasobtainedfromthepitnearpondinthe B.I.TSindriCampus. propertiesofthesoilarelistedbelow: GLASS POWDER(WGP) WasteGlasspowderwasobtainedfromAKSHAREXIM COMPANY
International Research Journal of Engineering and Technology (IRJET) e ISSN: 2395 0056 Volume: 09 Issue: 01 | Jan 2022 www.irjet.net p ISSN: 2395 0072 © 2022, IRJET | Impact Factor value: 7.529 | ISO 9001:2008 Certified Journal | Page1014 SOIL IMPROVEMENT USING WASTE GLASS POWDER AND FLY ASH Varun Thakur1 , Dr. Vikrama Pandey2 1M. Tech scholar, Dept. of Civil Engineering, B.I.T Sindri, Dhanbad 2Professor, Dept. of Civil Engineering, B.I.T Sindri, Dhanbad *** Abstract Engineering properties of soil may be altered by any method of soil stabilization, one of the methods of soil stabilization is by addition of admixtures. In this work, the waste materials like Fly Ash and Waste Glass Powder have been used as admixture to enhance the properties of soil.
1.INTRODUCTION
iii.
i.
Atterberg's limit tests (for calculating liquid limit and plastic limit), standard proctor tests (for calculating MDD and OMC), California bearing ratio (C.B.R) tests, and Unconfined Compressive strength (UCS) tests were performed on both soil and soil mixed with different percentages of fly ash (5%,7.5%,10%,12.5%and 15%),PropertieslikeMDD,CBRand UCS were found to be maximum with 10% fly ash. After that, with that sample of 10% Fly Ash, different percentages of waste glass powder (5%,7.5%,10%,12.5% and 15%) were mixed with the soil and the properties were studied
v.
Thegeotechnical
ii.
Many
Key Words: FlyAsh,WGP,ProctorTests,CBR,UCS,Liquid limit,PlasticLimit
2. 2.1MATERIALSSOIL
PRIVATE LIMITED Kolkata, West Bengal. The waste glass powder was made by collecting waste glass bottlesandcrushingthemintosmallerpieces.Thecrushed glasswasthensievedthrougha1180μmsieveandcrushed in a ball mill before being sieved again through a 300 μm sieve,yieldingwasteglasspowder. Table 2: Specifications of WGP as per manufacturer (Akshar EXIM Co. Pvt ltd Kolkata) 1. Silica(SiO2) 72.5% 2. Alumina(Al2O3) 0.4% 3. IronOxide(Fe2O3) 0.2% 4. CalciumOxide(CaO) 9.7% 5. MagnesiumOxide(MgO) 3.3% 6. SodiumOxide(Na2O) 13.7% 7. PotassiumOxide(K2O) 0.1% 8. SulphurTrioxide(SO3) 9. Percentpassingthrough425μsieve 100% 10. Percentpassingthrough75μ 0% 11. SpecificGravity 2.58
Soilimprovementisamethodortechniqueusedtoimprove soilthatdoesn’thavesufficientstrengthandotherpertinent properties.Soilimprovementistypicallydonetomeetthe requirementsofthetypeofstructurethatwillbebuiltonthe soil. By performing the soil improvement following advantagescanbeachieved: Improvementinthebearingcapacityofsoil. Reduction in the subgrade layers thickness in pavementdesign Reductioninsoftgroundsettlements Improvingstabilityofslopes soil improvement techniques are developed throughouttheyears,andtheyarestillbeingdeveloped Soil improvementmethodscanbecategorizedinfollowingmain categories: Soilimprovementwithreplacement. Soilimprovementbysoilreinforcement Soilimprovementwithgroutingandadmixturesetc. Soil improvement without admixture in coarse grained soils (Dynamic compaction, Vibro compaction,etc) Soil improvement without admixture in fine grained soils (Preloading, Dynamic Consolidation etc. [1.] Inthiswork,twoadmixtureshavebeenusedtostudy the soilpropertieswhichare: Waste Glass Powder and Fly ash.
The
Table 1: Properties of soil SerialNo Properties valueTest 1. Specificgravity 2.377 2. LiquidLimitLL(%) 40.11 3. PlasticLimitPL(%) 13.39 4. PlasticityIndex(Ip) 26.72 5. OptimumMoistureContent(%) 16.67 6. MaximumDryDensity(g/cm3) 1.8201 7. UnconfinedCompressiveStrength(UCS) (kN/m2) 55.98 8. CaliforniaBearingRatio(unsoaked)(%) 1.70 9. PercentPassingThrough75µSieve(%) 52.7 2.2 WASTE
iv.

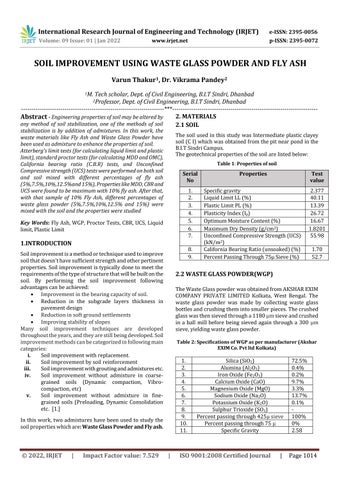
on Maximum Dry Density (MDD) and Optimum Moisture Content (OMC). ThevariationintheMDDandOMConincreasingtheFlyAsh contentareshowninfollowingtableandgraphs. Table 5: Variation in MDD and OMC values on increasing Fly Ash proportion Fly Ash (%) 0 5 7.5 10 12.5 15 MDD(g/cm3) 1.820 1.85 1.902 1.93 1.86 1.823 OMC (%) 16.67 14.28 12.12 11.11 13.04 16 Fig
5% 3.
4.1
Thestudywasconductedintwostages,thefirststagewasto mix soil with Fly Ash in soil in different percentages (5%,7.5%,10%,12.5%,15%)andtestslikeStandardProctor Tests, California Bearing Ratio Tests, Unconfined CompressiveStrengthTestsandAtterberg’sLimittests(for liquidlimitandplasticlimit)wereperformedandoptimum proportionof FlyAshwasobtainedbasedontheresultsof thetestsmentionedabove.Inthesecondstage,keepingthat proportion of Fly Ash constant, different percentages of Waste glass powder (WGP) (5%,7.5%,10%,12.5%,15%) were mixed and same tests were performed to obtain the effectiveproportionofWasteGlassPowder. RESULTS AND DISCUSSION EFFECT OF FLY ASH
Thestudywasconductedintwostages,thefirststagewas mixingofFlyAshwiththesoil.FlyAshwasmixedwiththe soilinfollowingorder: 4: Description of Samples of Soil and Fly Ash only No Soil (%) Ash 100% 95% 92.5% 4.1.1 Effect of Fly Ash 1: Variation in Maximum Dry Density on increasing the Fly Ash proportion 2: Variation in the OMC with increase in Fly Ash proportion Themaximumdrydensityincreasedfrom1.82g/cm3to 1.93g/cm3 asthepercentageofFlyAshincreasedfrom 0%to10%,whichcouldbeduetopozzolanicreactions with the lime content of the soil, resulting in the formation of Calcium Silicate Hydrates and Calcium AluminateHydrateshavinghigherspecificgravitythan thesoil[2.].WhentheFlyAshproportionisincreasedto 15%,theMDDvaluelowers,whichcouldbeduetothe residual (unreacted)Fly Ash having a lower specific
Serial
Fly
0% 2.
Table
International Research Journal of Engineering and Technology (IRJET) e ISSN: 2395 0056 Volume: 09 Issue: 01 | Jan 2022 www.irjet.net p ISSN: 2395 0072 © 2022, IRJET | Impact Factor value: 7.529 | ISO 9001:2008 Certified Journal | Page1015 2.3 FLY ASH Flyashisabyproductofthermalpowerplantsthatusescoal as a fuel. The Fly Ash used for the investigation was of C Class and collected from the Fly ash brick factory in Industrialarea,Sindri. Table 3: General Specifications of class C Fly Ash SiO2 40% Al2O3 17% Fe2O3 6% MgO 5% CaO 24% SO3 3% SpecificGravity 2.22 3. Experimental Procedure
(%) 1.
4.
7.5% 4. 90% 10% 5. 87.5% 12.5% 6. 85% 15%
Fig
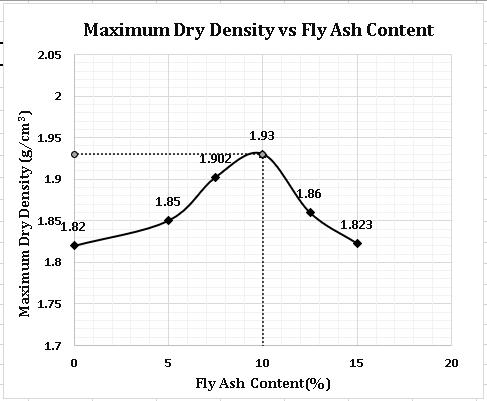
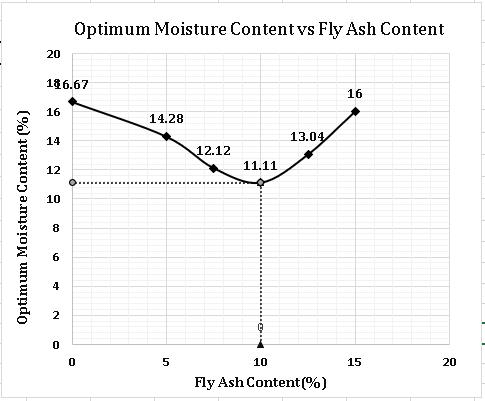
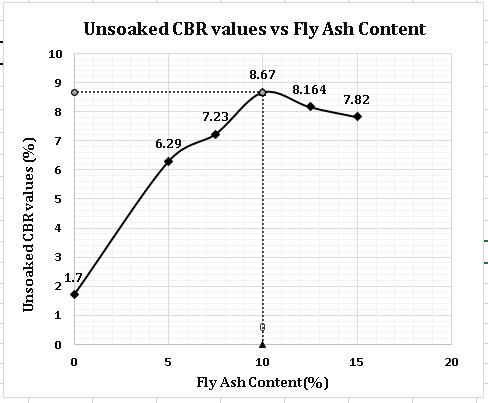
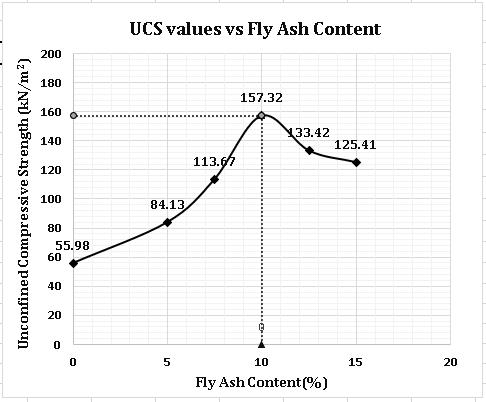
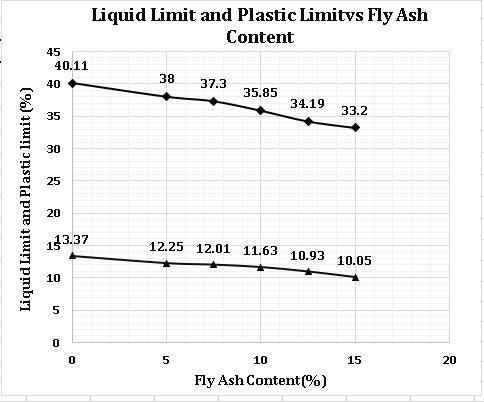
International Research Journal of Engineering and Technology (IRJET) e ISSN: 2395 0056 Volume: 09 Issue: 01 | Jan 2022 www.irjet.net p ISSN: 2395 0072 © 2022, IRJET | Impact Factor value: 7.529 | ISO 9001:2008 Certified Journal | Page1016 gravitythanthesoil,loweringthedrydensityofthesoil mass. WhiletheOMCdecreasedwiththeincreaseinFlyAsh proportion with the lowermost value of 11.11% with 10%FlyAsh. 4.1.2 Effect of Fly Ash on CBR (unsoaked) values. Table 6: Variation in Unsoaked CBR values on increasing Fly Ash proportion Fly Ash (%) 0 5 7.5 10 12.5 15 CBRUnsoaked(%) 1.7 6.29 7.23 8.67 8.164 7.82 Fig 3: Variation in CBR values with increase in fly ash proportion With the addition of Fly Ash, unsoaked CBR (values) increased from 1.7 percent to 8.67 percent, possibly because to the stronger resistance to penetration offeredbythedensermaterialobtainedasaresultofthe additionofFlyAsh. 4.1.3 Effect of Fly Ash on Unconfined Compressive Strength Table 7: Variation in UCS on increasing Fly Ash proportion Fly Ash (%) UCS (kN/m2) 0 55.98 5 84.13 7.5 113.67 10 157.32 12.5 133.42 15 125.41 Fig 4: Variation in UCS values with increase in fly ash proportion TheUCSvaluesincreasedfrom55.98kN/m2 to157.32 kN/m2 whentheproportionofFlyAshincreasedfrom 0% to 10%. The improvement in UCS value might be causedduetoincreaseinshearstrengthcausedbythe bonddevelopedbetweensoilgrainsduetocementitious propertyofFly Ash. 4.1.4 Effect of Fly Ash on Liquid Limit and Plastic Limits. Table 8: Variation in Liquid limit and Plastic limit on increasing Fly Ash proportion Fly Ash (%) Liquid Limit (%) Plastic Limit (%) 0 40.11 13.37 5 38.00 12.25 7.5 37.30 12.01 10 35.85 11.63 12.5 34.19 10.93 15 33.20 10.05 Fig 5: Variation in Liquid Limit and Plastic Limit with increase in fly ash proportion.
(%) Fly Ash (%) WGP (%) 1. 90 10 0 2. 85 10 5 3. 82.5 10 7.5 4. 80 10 10 5. 77.5 10 12.5 6 75 10 15
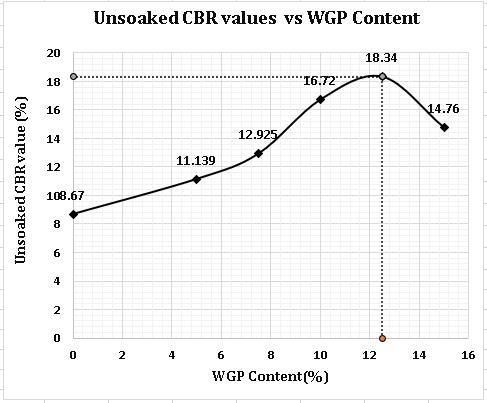
WGP (%) 0 5 7.5 10 12.5 15 CBRUnsoaked(%) 8.67 11.14 12.93 16.72 18.34 14.76 Fig
Serial No
4.2.2
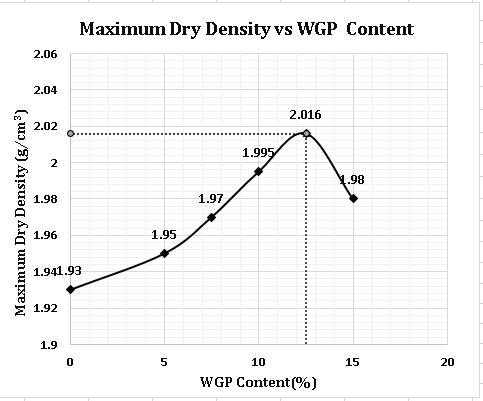
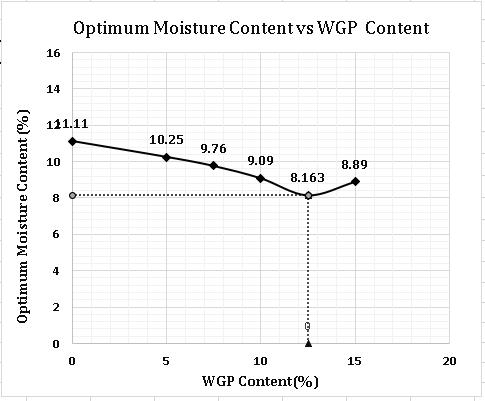
Fig 7: Variation in Optimum Moisture Content with increase in WGP proportion. AstheWGPproportionincreasedfrom0%to12.5%,the maximum dry density increased from 1.93 g/cm3 to 2.016g/cm3. The increase indry density is most likely duetothehigherspecificgravityofWGPincomparison tothespecificgravityofsoil.OnfurtherincreaseinWGP proportion to 15% the MDD decreases to 1.98 g/cm3 which may due to larger voids created by the coarser WGPparticleinthesoilmass AstheWGPproportionincreasedfrom0%to12.5%,the OMC decreased from 11.11% to 8.163%. It's possible that the decrease is due to the fact that glass powder doesnotabsorbwaterlikeclayparticlesdo. Effect of WGP on Unsoaked CBR Values. 11: Variation in unsoaked CBR values on increasing WGP proportion 8: Variation in Unsoaked CBR value with increase in WGP proportion. AstheWGPproportionincreasedfrom0%to12.5%,the UnsoakedCBRvalueincreasedfrom8.67%to18.34%. When WGPisadded which iscoarserandhavelarger Soil
Table
International Research Journal of Engineering and Technology (IRJET) e ISSN: 2395 0056 Volume: 09 Issue: 01 | Jan 2022 www.irjet.net p ISSN: 2395 0072 © 2022, IRJET | Impact Factor value: 7.529 | ISO 9001:2008 Certified Journal | Page1017 WiththeincreaseofFlyAshproportion,theliquidlimit and plastic limit decreased. It's possible that the decreaseisduetothefactthatflyashdoesnotretainas muchwaterasclayparticles. 4.2 EFFECT OF WASTE GLASS POWDER Since the MDD, CBR value and UCS value were found to maximum with 10% Fly Ash. So, it was taken as fixed proportionofFlyAshformixingofWasteGlassPowder.The WasteGlassPowderwasaddedinfollowingorder. Table 9: Description of Samples of Soil, Fly Ash and Waste Glass Powder. 4.2.1 Effect of WGP on MDD and OMC. ThevariationintheMDDandOMConincreasingtheWGP contentareshowninfollowingtable. Table 10: Variation in MDD and OMC values on increasing WGP proportion ProportionWGP (%) (g/cmMDD3) OMC (%) 0 1.93 11.11 5 1.95 10.25 7.5 1.97 9.76 10 1.995 9.09 12.5 2.016 8.163 15 1.98 8.89 Fig 6: Variation in Maximum Dry Density with increase in WGP proportion.
2. When only Fly Ash was mixed with the soil, the MDD improved from 1.82 g/cm3 to 1.93 g/cm3 and the maximumvalueof1.93g/cm3 wasobservedwith10% FlyAsh.
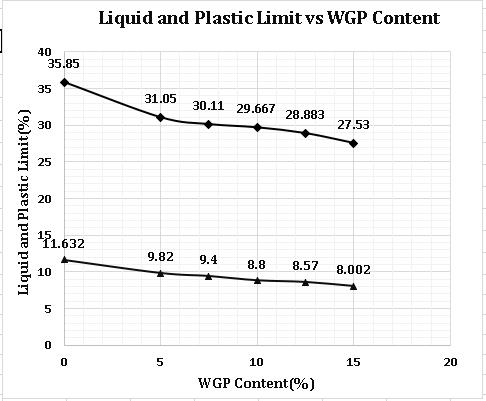
International Research Journal of Engineering and Technology (IRJET) e ISSN: 2395 0056 Volume: 09 Issue: 01 | Jan 2022 www.irjet.net p ISSN: 2395 0072 © 2022, IRJET | Impact Factor value: 7.529 | ISO 9001:2008 Certified Journal | Page1018 particlesize,theoverallgrainsizedistributionofthesoil shifts toward well graded soil, resulting in a more compactedstateofthesoilandthusahigherCBRvalue. OnfurtherincreaseinWGP proportion theCBR value dropsto14.76% 4.2.3 Effect of WGP on Unconfined Compressive Strength. Table 12: Variation in UCS values on increasing WGP proportion WGP (%) UCS (kN/m2) 0 157.32 5 199.83 7.5 222.69 10 266.734 12.5 292.824 15 259.77 Fig 9: Variation in UCS values with increase in WGP Proportion TheUCSvalueincreasedfrom157.32kN/m2to292.824 kN/m2 as the WGP proportion increased from 0% to 12.5%whichmaybeduetoincreaseinshearstrength due to shift of overall grain size distribution of soil towards well graded due to addition of WGP. On increasing the WGP proportion to 15% the UCS value decreased to 259.77 kN/m2 which may be due to decreaseincohesionduetoincreaseinWGPcontent. 4.2.4 Effect of WGP on Liquid Limit and Plastic Limit Table 13: Variation in Liquid Limit and Plastic Limit on increasing WGP proportion WGP (%) Liquid Limit (%) Plastic Limit (%) 0 35.85 11.632 5 31.05 9.82 7.5 30.11 9.4 10 29.667 8.8 12.5 28.883 8.57 15 27.53 8.002 Fig 10: Variation in Liquid Limit and Plastic Limit with increase in WGP proportion TheLiquidLimitdecreasedfrom35.85%to27.53%and PlasticLimitdecreasedfrom11.632%to8.002%asthe WGP proportion increased from 0% to 15%. The decreaseinliquidandplasticlimit ismaybebecause WGPdoesnotabsorbwaterlikeclayparticles.
1. The soil used for the study was clay of intermediate plasticity(CIsoil).
4. So,10%FlyAshwastakenasoptimumpercentageofFly AshformixingofWasteGlassPowder(WGP)
5. CONCLUSIONS
3. Similarly, when only Fly Ash was mixed with soil the UnsoakedCBRvalueincreasedfrom1.7%to8.67%and UnconfinedCompressiveStrengthincreasedfrom55.98 kN/m2 to 157.32 kN/m2. The maximum value of both unsoaked CBR and Unconfined compressive strength wasobservedwith10%FlyAsh.
6. With constant percentage of Fly Ash of 10% and different percentages of WGP, the value of unsoaked CBRincreasedfrom8.67%to18.34%andthemaximum valueofunsoakedCBRwasobservedwith12.5%WGP
5. With constant percentage of Fly Ash of 10% and differentpercentagesofWGP,highestvalueofMaximum Dry Density was observed with 12.5 % WGP and the highestvalueofMDDwas2.016g/cm3 .
Thefollowingconclusionscanbedrawnbasedontheresults of various experiments conducted on different samples of soilmixedwithFlyAshandWasteGlassPowder:
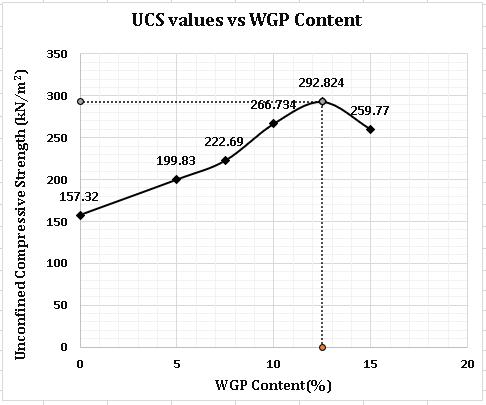
International Research Journal of Engineering and Technology (IRJET) e ISSN: 2395 0056 Volume: 09 Issue: 01 | Jan 2022 www.irjet.net p ISSN: 2395 0072 © 2022, IRJET | Impact Factor value: 7.529 | ISO 9001:2008 Certified Journal | Page1019 7. The Unconfined compressive strength also improved from 157.32 kN/m2 to 292.824 kN/m2 and the maximumUCSvaluewasobservedwith12.5%WGP. 8. Liquid limit decreased throughout the process of additionofadmixturesfrom40.11%to27.53%. 9. Plasticlimitalsodecreased throughout the processof additionofadmixturesfrom13.37%to8.002%. 10. Fromaboveresults,theoptimumpercentageofFlyAsh andWGPwerefoundtobe10%and12.5%respectively. REFERENCES [1.] JeanLouis;Briaud;“GeotechnicalEngineering: UnsaturatedandSaturatedSoils”;Onlinewiley Library;21october2013 https://doi.org/10.1002/9781118686195.ch26 [2.] RizgarA.Blayi,AryanFarH.Sherwani,HawkarHashim Ibrahim, Rabar H. Fara, Ako Daraei; “Strength improvementofexpansivesoilbyutilizingwasteglass powder”; ELSEVIER; Case Studies in Construction MaterialsVol.;13(2020). [3.] Zaid Abdul Zahra Mahdi, Noor S. Al Hassnawi; “Assessment of Subgrade Soil Improvement By Waste GlassPowder”InternationalJournalofCivilEngineering andTechnology(IJCIET);Volume9,Issue 10,October 2018,pp.12 21 [4.] Syed Aaqib Javed, Sudipta Chakraborty; “Effects of Waste Glass Powder on Subgrade Soil Improvement”; ELSEVIER;Vol.08Issue.03(2020) [5.] S. Andavan, Vamsi Krishna Pagadala; “Experimental study on addition of lime and fly ash for the soil stabilization”;ELSEVIER;Vol.22,Part3,2020,Pp.1065 1069. [6.] BakhtZamin,HassanNasir,AsimFarooq,BeenishJehan, M.TariqBashir;“WasteGlassPowderontheSwelling and Strength Characteristic of Karak Expansive Clay”; http://dx.doi.org/10.33317/ssurj.362 [7.] M.S. Deepak, S. Rohini, B.S. Harini, G. Beulah Gnana Ananthi; “Influence of fly ash on the engineering characteristics of stabilised clay soil”; ELSEVIER; Volume37,Part2,2021,pg2014 2018 [8.] VishalSharma,SandeepSingh;“Modellingfortheuseof waste materials (Bottom ash and fly ash) in soil stabilization”;ELSEVIER;Vol.33,Part3,2020,pg1610 1614 [9.] Rintu Renjith, Dilan Robert, Sujeeva Setunge, Susanga Costa,AbbasMohajerani;“Optimizationofflyashbased soil stabilization using secondary admixtures for sustainableroadconstruction”;ELSEVIER;Vol.294,20 April2021. [10.] Hanifi Canakci, Aram AL Kaki, Fatih Celik; “Stabilization of Clay with Waste Soda Lime Glass Powder”;ELSEVIER;ProcediaEngineering161(2016) pg600 605 [11.] V. Janani, P.T. Ravichandran; “Effect of industrial waste on the behaviour of expansive soil”; ELSEVIER; MaterialsTodayProceedings17july2020 [12.] PratikSomailya,YashwantZala,RushikeshDangar; Stabilization Of Expansive Soil Using Fly Ash;2013(Source:researchgate). [13.] Karanbir Singh Randhawa, Rajiv Chauhan; StabilizingblackcottonsoilinsubgradewithMunicipal Solid Waste Incineration (MSWI) ash for lowering [14.]onlinegreenhousegasemission:Areview;ELSEVIER;Available22August2021
IS 2720 PART III: “Determination of Specific Gravity”,1980 [15.] IS 2720 (Part 4) 1985, “Method of Test for Soil (GrainSizeAnalysis)”. [16.] IS 2720 (Part 5) 1985, “Method of Test for Soil (DeterminationofLiquidandPlasticLimit) [17.] IS 2720 (Part 8) 1983. “Method of Test for Soil (Determination of Optimum moisture content and Maximumdrydensityformodifiedproctortest) [18.] IS 2720(Part 10): Determination of Unconfined CompressiveStrength [19.] IS2720(Part16)LaboratoryDeterminationofCBR