International Research Journal of Engineering and Technology (IRJET) e-ISSN: 2395-0056

Volume: 09 Issue: 10 | Oct 2022 www.irjet.net p-ISSN: 2395-0072
International Research Journal of Engineering and Technology (IRJET) e-ISSN: 2395-0056
Volume: 09 Issue: 10 | Oct 2022 www.irjet.net p-ISSN: 2395-0072
1Graduate Student, Dept. of Mechanical Engineering, NIT Warangal 2Research Scholar, Dept. of Mechanical Engineering, NIT Warangal 3 Professor, Dept. of Mechanical Engineering, NIT Warangal, Telangana, India ***
Abstract - Automobile manufacturers and end users are exhibitinginterest inElectric Vehicles (EVs) due tothethreats posed by fossil fuel driven vehicles mainly rising air pollution levels. As EVs are yet to play vital role and larger penetration into markets, hybrid electric vehicles especially Fuel Cell Hybrid Electric Vehicles (FCHEVs) are showing promising signs. Moreover, this is also creating interest among researchers tofindbetter performingandaffordable EVs. The problem with battery electric vehicle is long charging time, less travelrange andhigh Batterycost.Fuelcellhybridelectric vehicles would solve these limitations to some extent. In the present work, the AdvancedVehicleSimulator (ADVISOR) has been used to investigate the impact of the degree of hybridization (DOH) on the performance an FCHEV (Toyota Mirai 2021 model). The fuel economy, acceleration performance and Gradeability performance of the various configurations (different DOHs) are compared with the original vehicle's findings. The vehicle configuration with maximum degree of hybridization (DOH = 68.7%) showed a 16.3% improvement in fuel economy. Furthermore, the best vehicle configuration is recreated across a variety of driving cycles in order to investigate its performance under various driving conditions.
Key Words: Fuel Cell, Battery, Hybrid Electric Vehicle, Driving Cycle, ADVISOR Software, Range
AsperthereportsofIEA(InternationalEnergyAgency)in 2016,thetransportationsectorcontributedfor33.7percent ofenergyusedworldwideand24.4percentofCO2emissions [1].VehiclesdrivenbytraditionalICEnginesgettheirenergy fromfossilfuels.Thepriceoffossilfuelshasbeenincreasing daybydayandalsoemissionsemittedbythetraditionalIC engine driven vehicles are affecting the environment drastically.
Bothresearchersaswellasmanufacturersaretryingtheir best to cope with the stringent emission norms being legislatedperiodically.Ithasbecomemandatorytocomply withEUROVInormssinceApril2020allovertheworld.In theprocessofmeetingemissionnormseitherfocusisbeing shifting to include cost intensive engine modifications adopting exhaust aftertreatment device or employing alternativecombustiontechniquesoralternativefuels[2].
However, owing to the persistent problem of harmful emissionsduetovariousreasonsandalsotolookforother alternatives for fossil fuelled ICE vehicles, interest is growingtowardselectrificationofthetransportsectorboth inheavydutyandpassengerdomains.
Automobilemakersarebeingforcedtodevelopinnovative solutions as the public's desire to safeguard the environmentgrows.Asaresult,automakersarebecoming moreinterestedinEVs-ElectricVehiclesandHEVs-Hybrid Electric Vehicles [3,4]. But the problem with full electric vehicles is large refuelling time, shorter drive range and availabilityofchargingstations.Sohybridvehiclescanbe thebestalternativeoption provided witha better energy management system. Hybrid vehicles are characterized basedondrivetrainarrangementandsourceofenergy.The powersuppliedbytheICEenginewouldeitherbedirectly utilized to drive the wheels or be used to replenish the battery,whichinturnaidsintherotationofthemotorin ICE hybrid cars. There are mainly three versions under whichtwopowersourcescouldbeconnectedtopropelthe vehicle,inawayhowtheICEandthebatteryorotherthan ICE is connected such series, parallel and series-parallel versions.
Though battery and ICE combined hybrids have started emergingbuttheissuewithbatterycharginghasremained as an issue. In this direction, fuel cell powered energy storagehasstartedemerginginhybridelectricvehicles.
The fuel cell is the principal source of energy in fuel cell hybrid electric vehicles (FCHEV) [5]. Fuel cell is an electrochemical device that transforms chemical energy available [mostly in hydrogen] directly into electrical energy.TheyarecategorizedasPEMFC,AFC,MCFC,SOFC, andPAFCdependingonthe kindofelectrolyteutilizedin the fuel cells [6,7]. The attractive features of Proton Exchange Membranes (PEM) fuel cell that make its applicabilityinhybridsare;thesimplicity,viability,quick start, better power density, lower temperature operation [8-11].OversizeofFCdoesnothinderitsuseintransient conditions. However, it becomes an expensive option for hybrid vehicles. The contribution from FC is frequently reduced and hybridized with some other energy storage technology to minimize cost rise. The fuel cell enabled hybrid power-train system essentially comprises of
2022, IRJET | Impact Factor value: 7.529 | ISO 9001:2008 Certified Journal | Page111
International Research Journal of Engineering and Technology (IRJET) e-ISSN: 2395-0056
Volume: 09 Issue: 10 | Oct 2022 www.irjet.net p-ISSN: 2395-0072
batteries or ultracapacitors for energy storage and an electricmotor[12].Onlyparticularcircumstancesallowthe electricalenergystoragedevicestofunction.Thefuelcellis the primary power source for the electrical motor in this investigation.Whenthefuel cell'spowerisinsufficientto operate the motor during sudden acceleration, a battery systemisused.
Turkmen,etal[13]builtafuelcellhybridelectriccarmodel usingADVISOR software and studied the impact of fuel power and fuel cell type on vehicle performance. Ahmadi and Bathaee [14] to regulate the energy in the fuel cell hybridcarproposedtwoenergymanagementmethodshave been developed (FCHV with fuzzy logic control (FLC) and operationalmodecontrol(OMC)arethetwo.Thesemethods arecomparedtoothermethodsthatareavailableinadvisor software.Maxoulisetal[15]exploredhowmodifyingdesign factors including maximum stack power, catalyst activity, and water concentration in the fuel cell stack's channels affectedtheoverallperformanceandfuelconsumptionofa
fuel cell electric car. Degliuomin et al [16] suggested a methodforon-boardhydrogenproductionfrombio-ethanol that is used in conjunction with a Proton Exchange Membrane Fuel Cell aboard the vehicle. The car is put throughitspacesontypicaldrivingcyclesanddeterminedto beadequate.Itwasalsoproposedthatthecomponentsbe resized to increase fuel economy. Das et al [17] in theirreviewpaperdiscussedvariousFCHEVconfigurations and power converter topologies. The advantages and disadvantages of each topology, safety standards, current situation and environmental impact of FCHEV were also discussed.Zhangetal[18],madeuseofADVISORsoftware, created a fuel cell drive train model for a locomotive, featuringafuelcellastheprimaryenergysourceandaleadacid battery as secondary energy storage. As an energy managementsystem,afuzzylogic-basedcontrolmethodis designed, and the efficiency of the FC improves by 6.8%, while the gradeability at 36 km/h increases from 8.9% to 11.1%.Feroldietal[19]proposedamethodologyforscaling offuelcellandnumberofsupercapacitorsinfuelcellhybrid electric vehicles integrated with supercapacitors. By enlargingthefuelcellandadjustingtheenergymanagement strategy'sparameters,vehicleperformanceisinvestigated. Wipke et al [20] gave a clear insight about how ADVISOR softwareworksandexplainedaboutbackwardandforward approach techniques used in the software. Advantages of ADVISORsoftwareoverothersoftware’sworkedbasedon forwardfacingtechniquesarealsopresented.Incomparison, withotherforward-facingvehiclemodelsoftware,ADVISOR mimicsvehicleperformanceonregulardrivingcyclearound 2.6and8.0timesfaster.
Chrisetal[21]emphasizedtheimportanceofsimulationand modellinginthedevelopmentofelectricandhybridvehicles discussed the methods (i) physics-based Resistive CompanionFormtechniqueand(ii)BondGraphmethodfor the powertrain component system.They brieflylisted out
the capabilitiesof other modelling tools in addition to ADVISORforsimulationofEVsandHEVs.Theystressedthe importanceofnumericaloscillationsindynamicsimulations involvingpowerelectronics.
Inthepresentwork,anFCHEVmid-sizecarismodelledand simulated in ADVISOR (Advanced Vehicle SimulatordesignedbytheNationalRenewableEnergyLaboratory,US) [22,23].withvaryingfuelcellstackpowerbatterypackby keepingmaximumtotalpowerofthevehicleasconstantand performance parameters such as power consumption, accelerationperformance,Gradeability,drivingrange,fuel economy etc., are compared among each model. Studies weredonerelatedtotank-to-wheelandwell-to-wheel and discussed the energy consumption and greenhouse gas emissions for the chosen engine configuration. Urban and cruising driving conditions for chosen for the simulation. Also, a Wankel engine would be an appealing choice for a plug-inhybridelectricvehicle'srangeextender[24].
AvanishKumarandThakura[25]feltthatelectricvehicles would be alternative to ICE vehicles. They were of the opinion that hybrid electric vehicles would be immediate optioninplaceofEVsduetoissuessuchasshorter range andlongerrechargingperiodsforelectricvehiclesasHEVs wouldexhibitbetterefficiencyandreliableoperatingmodes . Using the ADVISOR software, they evaluated the performanceofatinyHEVpureICEwithseriesHEV,and parallelHEV configurations.Theaccelerationperformance andgradeabilitytestandvehicleemissionswerestudied.To combat issue ofpoor quality in urban areas, that hybrids, specifically, Battery Electric Vehicles andFuelCellElectric Vehicles were becoming important source of automobiles [26].
Forthepresentstudy,specificationsofthenew2021Toyota Mirai fuel cell hybrid Electric Vehicle is considered. The improved model is simulated across different Degrees of Hybridizationandmultipledrivingcycles.
ToyotaMiraiFCEVSedan-2021ProductInformation was chosenfortheinvestigation.Thepower-trainismodelled with reference to the 2021 Toyota Mirai FCEV's vehicle specifications. Power drivetrain comprises of hydrogen tank,fuelcellstack,dc/dcconverter,battery,electricmotor, dc/ac inverter. Table 1 shows the essential vehicle characteristicsforthiskindofvehicle.Ingeneral,combining an FC energy systemwith battery storage increases the vehicle's performance and its fuel efficiency. The hybridization ratio is defined as the ESS power to total power. FCHEVs engine economy, recovery from braking energy, and fuel cell life-span can be improved by using hybridization. The importance of hybridization leads to higher fuel efficiency in urban(transient) and accelerated driving circumstances. The fuel cell produces primary powerforsteady-statedriving,whereasthebatteryboosts
2022, IRJET | Impact Factor value: 7.529 | ISO 9001:2008 Certified Journal | Page112
International Research Journal of Engineering and Technology (IRJET) e-ISSN: 2395-0056
Volume: 09 Issue: 10 | Oct 2022 www.irjet.net p-ISSN: 2395-0072
powerinaccelerationsurgesandpeakloadconditionsand recovers kinetic energy during braking. The equivalent internalresistanceofthebattery,whichhasahigherenergy density, is a critical limitation for hybrid power management.In the present work,at different degrees of hybridization conditions Fuel cell system power and the battery capacity are varied by keeping maximum total power 174kW asconstant tocalculatethefuel efficiency andaccelerationperformanceineachcase.
Thecharacteristicofvehiclespeedversustimeillustratesa typical VehicleDrivingCycle.Itcanbetreatedasareplication or simulation of driving conditions on the road. Different nationsandorganizationsdevelopdrivingcyclestoevaluate avehicle'sperformanceinavarietyofways,includingfuel efficiency,therangeofanelectriccar,andemissions.Driving cyclesarealsousedforsimulationstopredictimposing road anddrivingconditionsforarrivingatvehicle’sperformance andemissions.
The popular driving cycles include- the UDDS (Urban DynamometerDrivingSchedule),NREL2VAIL UrbanDriving Cycle (UDC) and the Extra Urban Driving Cycle (EUDC) cycles,arecombinedtoformtheNewEuropeanDriveCycle (NEDC).InthecontextofIndia,ModifiedIndiandrivingcycle (MIDC)isusedtotestvehiclesoperatedinIndia.TheNEDC depicts high-speed driving circumstances with fast speed variations,aswellasdriverbehavior.TheWLTC(Worldwide Harmonized Light Vehicle Test Cycles) are the tests on chassis dynamometers, used to determine energy consumption and emissions from light-duty vehicles. It representsthedrivingconditionsforaspanof14.41miles (23.2 km) with 8 stops in between and total test time is around 1800 sec. The whole cycle is divided into low, medium,high,extrahighi.e.,4partswithrespecttospeed andachievesamaximumspeedof81.65mph(131.4kmph).
Theratioofthebatteriesmaximumpowertothe drivetraintotalpoweristhedegreeofhybridizationfor anFCHEV.
DoH=
Where pB,max isthebatterymaximumpowerand pFCS,max is thefuelcellmaximumpower. Inthepresentwork, pFCS,max and pB,max arevariedaccordingly maintaining the vehicle’stotalpowerunaltered(174kW).
FCEVsmustsatisfythefollowing
ii. Thevehicleshouldbeabletoacceleratefrom0to 96.6km/hin12seconds,accordingtothePNGV.
PerformanceofvehicleswithvariousDoH(degreesof hybridization)willbeevaluated,butonlyforautomotive modelsthatadheretotheaforementionedrequirements.
Vehicle configurations with varied DOHs are studied in ADVISORsoftware,toseehowthedegreeofhybridization affects vehicle performance. ADVISOR makes use combination of forward-facing and backward-facing combinationforsimulationfeatures.It'sdevelopedforquick comparisons of traditional, electric, and hybrid vehicle performanceandfuelefficiency.ADVISORalsoservesasa foundation for extensive simulation and analysis of userdefined drivetrain components, as well as a source of validatedvehicledataandalgorithmsfromwhichtofullyuse SIMULINK's modelling freedom and MATLAB's analytic capabilities. In our current work, overall power of the powertrainiskeptconstantacrossallconfigurations,with justthepercentageofpoweravailablefromthebatteryand thefuelcellsystemaltering.
i. Toinvestigatehowenergyisusedandlostacross the drivetrains of conventional, hybrid and electricvehicles.
ii. Toseetheoperationofanenergymanagementplan forthefuelconverterinyourhybridcar.
[20]
i. FCSmustbeabletokeepthevehiclemovingat55 mph(88.5km/h)ata6.5percentgradientfor20 minutesonitsown.
iii. Calculate the tailpipe emissions from a variety of cycles.
iv. To adjust the gear ratios in the transmissions in order to reduce fuel consumption or increase performance,forexample.
International Research Journal of Engineering and Technology (IRJET) e-ISSN: 2395-0056
Volume: 09 Issue: 10 | Oct 2022 www.irjet.net p-ISSN: 2395-0072
v. To learn about the fuel efficiency of automobiles thathaveyettobeproduced.
As described in the previous section, the simulation resolutionresultsobtainedthroughADVISORfortheToyota Miraivehiclearepresentedanddiscussed.
EffectoftheDegreeofHybridization(DoH):
This section discusses how the degree of hybridization affects FCHEV's performance. Table - 2 summarizes the accelerationandgradeabilityfindingsforeachsetup.Inthe acceleration test the time taken to reach 60 mph, 85 mph from0and60mphfrom40mpharenoted.
Table-2 Acceleration,Gradeabilityperformanceresults
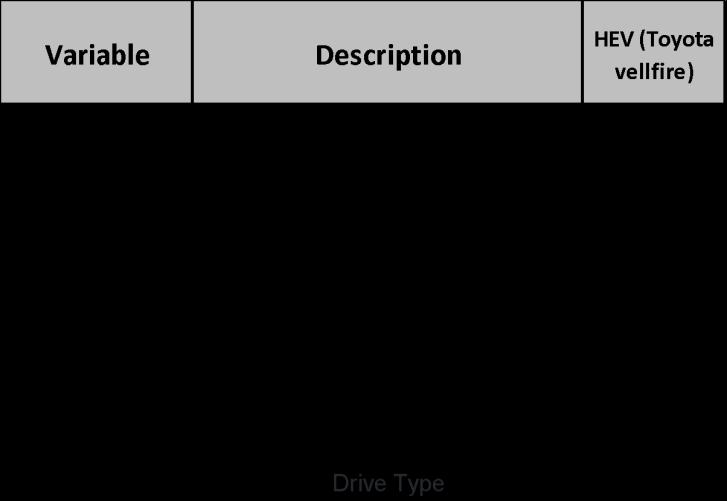
Figure1:InputwindowofADVISORsoftware
DoH (%)
Acceleration test (Time Taken to reach) Gradability test at 55 mph for 20 mins (%) 0-60 mph 40-60 mph 0-85 mph
Figure2:SimulationsetupwindowinADVISOR
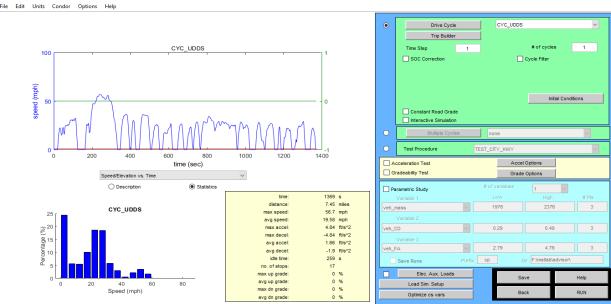
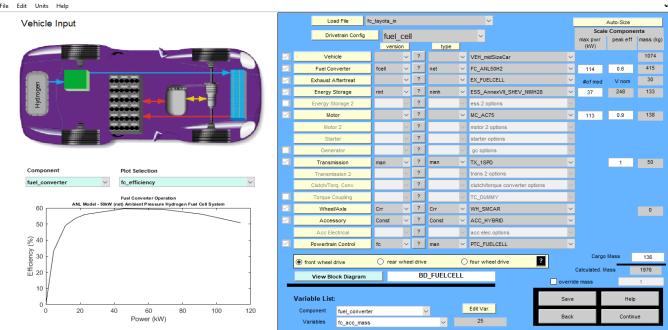
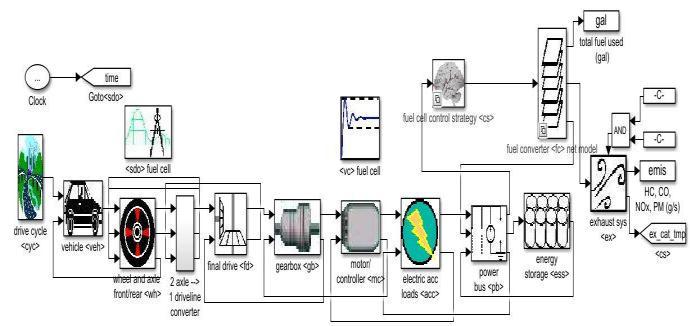
Figures1–4illustratethe input,setup,simulationsample resultsinterfaceandvehicleblockdiagramrespectively.
ThedrivingcyclesarecodedinMATLABasdetailed below:
29.89 12.1 6.5 25.6 16 31.03 12 6.3 25 15.2 34.5 10.7 6 23.4 14.6 44.83 9.8 51 20 12.5 50 9.3 4.7 18.7 11.3 59.77 8.5 4.2 16.8 8.7 64.94 8.1 4 15.9 7.3 67.8 7.8 3.8 15.4 6.5 68.4 7.7 3.7 15.3 6.3
Table-3Maximumspeed,fueleconomy,Initialtravel distanceresults
DoH (%) Maximum Speed (mph) Distance travelled in 5 sec (ft) Gasoline equivalent
Figure3.ResultswindowinADVISOR
29.89 97.9 163.431.03 97.9 165.6 63.8 34.5 97.9 168.6 65.1 44.83 97.5 176.6 68.9 50 97.5 182.1 71.1 59.77 97.3 187.5 72.9 64.94 97.2 190.2 74.9 67.8 97.2 192.5 75.7 68.4 97.2 192.8 -
Figure4:FCHEVBlockdiagraminADVISOR
2022, IRJET | Impact Factor value: 7.529 | ISO 9001:2008 Certified Journal | Page114
International Research Journal of Engineering and Technology (IRJET) e-ISSN: 2395-0056
Volume: 09 Issue: 10 | Oct 2022 www.irjet.net p-ISSN: 2395-0072
It is observed that with rising DoH, there is a decreasing tendency in acceleration time. With increase in battery power, the acceleration time should decrease due to the battery'sgreaterreactiontopowerincreasethanthatofthe fuel cell. The Gradeability test determines the maximum gradethatthevehiclecantravelat55mphfor20minutes. AstheDoHmovesawayfromtheinitialDoH,themaximum gradesupportedbytheFCEVintheGradeabilitytestat55 mphdecreases.
Table-3 summarizes the maximum speed, fuel economy, travel distance in first 5 secs findings for each setup. Max speedremainsalmostconstantwithchangeinDoH.Distance traveledinthefirst5secisincreasingasthevehicleDoHis increasing since in the initial condition’s battery is solely used to run the motor. Maximum acceleration remained constant.Fuel economyofFCHEVisdeterminedforUDDS cycleatallconfigurations.34.5%istheDoHcorresponding totheoriginalToyotaMirai,thefueleconomycorresponding tothisconfigurationis65.1mph,whileMirai’sfueleconomy is 67 mph, we can see a difference of around 2.8%. The lowest DoH configuration has a worse fuel efficiency, as shown in Table-3, while the vehicle with maximum DoH configurationhashighestfuelefficiency.Itisfeasibletosee an improvement in fuel efficiency with the help of DoH. Whenevaluatingavehicle'sfuelefficiencywithoriginalDoH configurationtothatofmaximumDoHconfiguration,there is a 16.3 percent improvement in case of maximum DoH configuration’sperformance.ButwithincreaseinDoHthe gradeability decreases significantly, maximum speed also decreases slightly. DoH for Toyota Mirai is restricted between 31%-67.8% (from Table-2). The vehicle configurationcorrespondingto67.8percentDoHhasgood acceleration performance and also has improved fuel economysothecorrespondingvehicleconfigurationcanbe treatedasoptimumToyotaMiraiconfiguration.
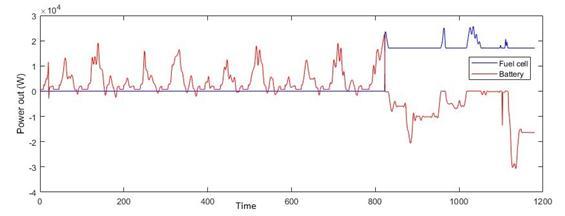
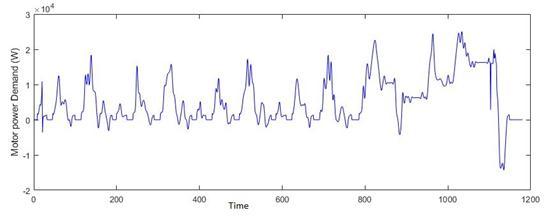
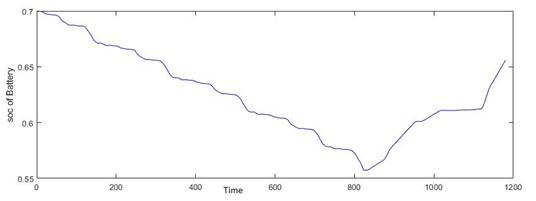
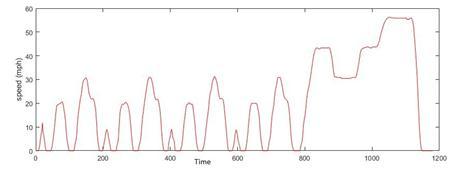
ActualToyotaMiraiFCEVissimulatedwithrespecttoMIDC driving cycle. The simulation results for vehicle speed, batterystateofcharge,motorpowerrequirement,fuelcell power,andbatterypowerareshowninFig.5.The battery SOCreducesfrom70percentto56.4percentduringthefirst 810seconds.Duringthefirst810secthespeedisverylow due to this only the battery is producing the total power neededandfuel cell is inideal state.After810 sec, due to highspeeds,thefuelcellsystemsimultaneouslyrecharges the battery i.e SOC increases as well as supplies power to motor.Thefuelcellenergysystemcompletelycompensates the peak demand of the motor, which is roughly 26.3 kW. Fuelcellisinoffmodeformostofthetime.Between810sec to 1180 sec power generated by the fuel cell is utilized to chargethebattery.
(a)
(b) (c)
(d)
Figure:5SimulationresultsduringMIDCcycle
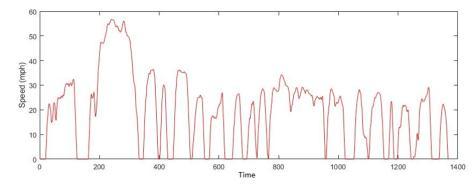
Fig.6showsthesimulationfindingsinrelationtotheUDDS. During the vehicle beginning phase of 100 seconds, the battery SOC reduces from 74.5 percent to 70.2 percent, beforereturningtoitsbaselineSOCafter400Seconds.To meetthemotorpeakpowerrequirementof47.2kW,thefuel cellandbatteryprovide41.6kWand7.9kW,respectively.
International Research Journal of Engineering and Technology (IRJET) e-ISSN: 2395-0056
Volume: 09 Issue: 10 | Oct 2022 www.irjet.net p-ISSN: 2395-0072
SOCofbatteryattheendofthecycleis70.5percent.Only thebatterysupportsthemotorduringthevehicle'sstarting andlow-speedsituations.Forthemostpart,thefuelcellis switchedoff.
systemtakescareofthemajorityofthemotor'speakpower requirement,whichisaround43.7kW.
Mostofthetime,thefuelcellisidle.Overallfuelcellsystem efficiencyincreaseswhentheneedforhybridpowercontrol islowornegative.ThesimulationplotsaredepictedinFig.7.
Figure6:UDDScyclesimulationresults
ii)NREL2VAIL(usedtopredicttheperformanceat mountainareas)
The NREL2VAIL driving cycle is often used to estimate vehicleperformanceinoff-roadcircumstances,particularly in mountainous terrain. The NREL2VAIL driving cycle is beingusedtoforecastvehicleperformance.Ithasbothuphill and downhill sections. Between 1200 and 2800 seconds, uphillcircumstancesmaybeseen,withelevationsranging from2270to3280meters.Thehighestpowerconsumption ofthemotorisroughly78.3kW,whichissupportedbyboth energysources,namelythefuelcell(8.3kW)andthebattery system(71.4kW).Mostofthetime,boththebatteryandthe fuel cell work together to provide the power need. The battery'sSOChasstayedstableat70%.Between4900and 5700 seconds, downhill conditions may be seen, with elevationsrangingfrom3190to2520meters.Thebattery
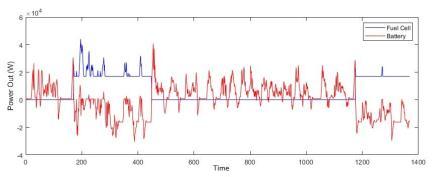
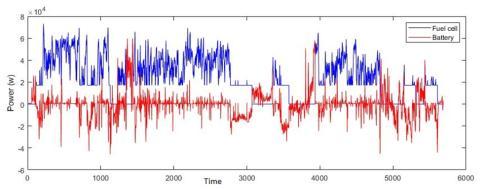
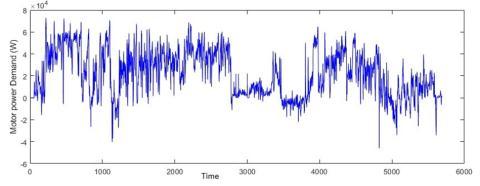
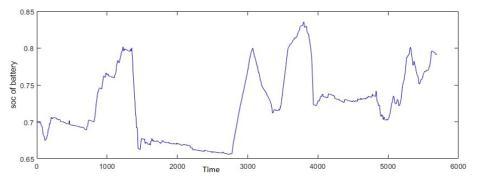
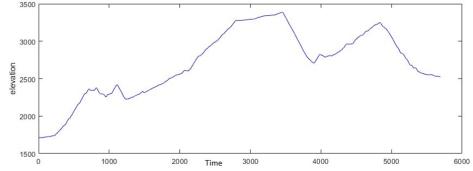
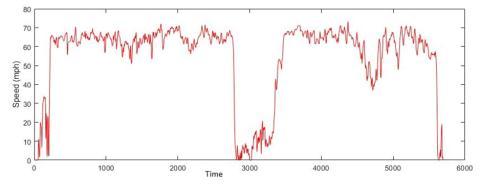
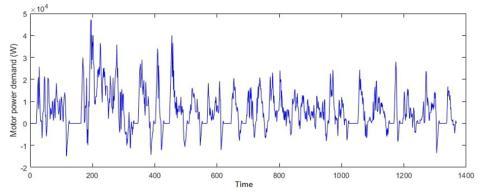
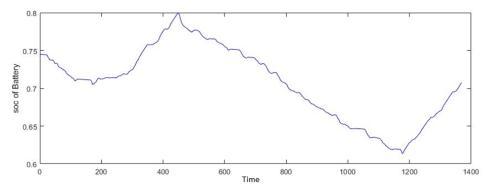
Figure7:NREL2VAILdrivingcycle simulationresults
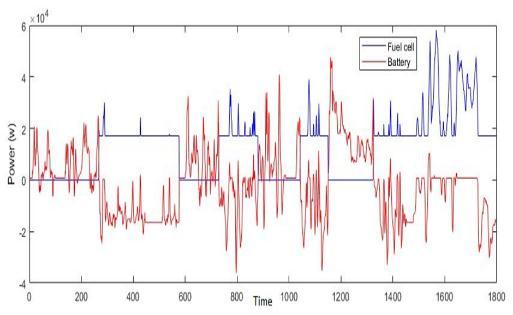
Considered WLTC class-3 driving cycle for our present simulation.ThebatterySOCreducesfrom70percentto64.4 percentduringthefirst280sec,afterthisthefuelcellstarts providing required power to the motor and reaches a maximumSOCof80.5percentageataround600seconds.It
2022, IRJET | Impact Factor value: 7.529 | ISO 9001:2008 Certified Journal | Page116
International Research Journal of Engineering and Technology (IRJET) e-ISSN: 2395-0056
Volume: 09 Issue: 10 | Oct 2022 www.irjet.net p-ISSN: 2395-0072
canbeobservedthatthefuelcellaloneprovidedmotorpeak powerof58.3kWand79.5percentistheSOCofbatteryat the end of the cycle. Only the battery supports the motor during the vehicle's starting and low-speed situations, duringthissituationthefuelcellisinidlestate.Thedetails areillustratedinFig.8.

3.2Comparisonofperformanceondifferentdrivingcycle:
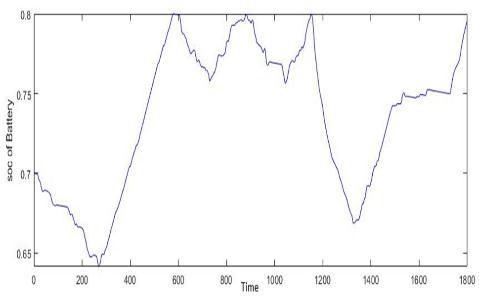
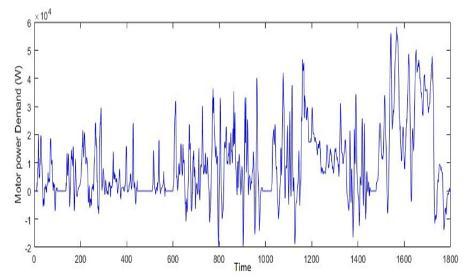
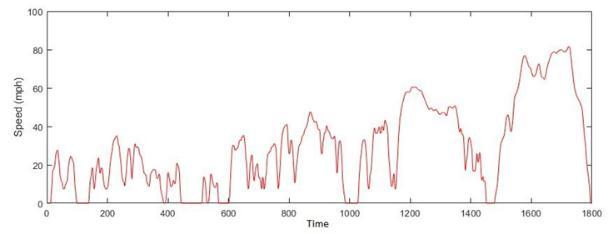
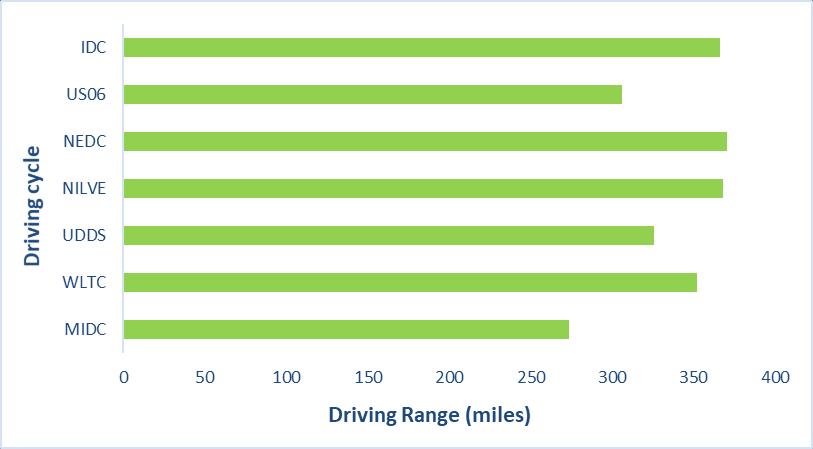
Table 4 represents the Toyato Mirai performance during differentdrivingconditions.Thevehicleperformsbetterin NEDC,WLTCi.eitsbestsuitedforEuropeanandJapanese drivingconditions.ThecomparisonplotsareshowninFig.9.
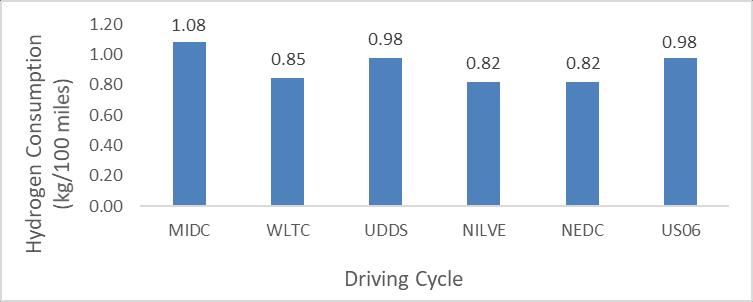
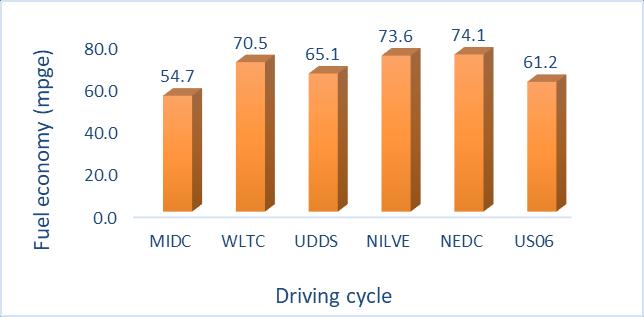
Table-4 SimulationresultsofToyatoMirai
S N o
Drivin g cycle
Hydrogen Consumpti on (kg/100 miles)
Fuel econo my (mpge)
Drivin g Range (miles )
Energy Consumpti on per100 miles
1 MIDC 1.08 54.7 273 61.1
2 WLTC 0.85 70.5 352 47.4
3 UDDS 0.98 65.1 326 51.3
4 NILVE 0.82 73.6 368 45.4
5 NEDC 0.82 74.1 370 45.1
6 US06 0.98 61.2 306 54.6
7 IDC 0.82 73.2 366 45.6
8 HWFE T 0.98 61.5 308 54.3 (a) (b)
(c)
International Research Journal of Engineering and Technology (IRJET) e-ISSN: 2395-0056
Volume: 09 Issue: 10 | Oct 2022 www.irjet.net p-ISSN: 2395-0072
[4] P. K. Prathibha,R.S.Elizabeth and A. Unnikrishnan, “Parameter Study of Electric Vehicle (EV), Hybrid EV and Fuel Cell EV Using Advanced Vehicle Simulator (ADVISOR) For Different Driving Cycles,” Green Buildings and Sustainable Engineering . pp.491–504, https://link.springer.com/chapter/10.1007/978-98115-1063-2_42.
[5] T.Bahattin, H.TArat, E.Baltacıoğlu and K.Aydın, “Overview Of The Next Quarter Century Vision Of Hydrogen Fuel Cell Electric Vehicles,” International Journal Of Hydrogen Energy, 44[20], 19 April 2019, pp.10120-10128, https://doi.org/10.1016/j.ijhydene.2018.10.112.
Figure9:Simulatedperformanceresultsundervarious cycles.
The simulation of actual FCHEV mid-size automobile modellingfordifferentDoHandperformancearediscussed. The hybrid powertrain is modelled using widely used software-ADVISOR in a MATLAB/Simulink-based environment. It is observed that with increasing the DoH improvedthevehicle'saccelerationperformance.Thefuel economy result supports the DOH that it significantly enhancesvehicleperformance.Ifthefueleconomyissimilar, thereisa16.3percentimprovementwhenmaximumDOH configuration’siscomparedtooriginalDOHconfiguration. Significant improvement in acceleration performance can alsobenoticed.Loweringthefuelcellpowerandboosting the battery modules enhances the battery pulse power capabilitieswhilealsoreducingthefuelcellstacksize,cost, andimprovingvehicleacceleration.TheactualToyotaMirai FCHEV is simulated over different driving cycles and the vehicleconfigurationisfoundouttobeperformingwellin EuropeanandJapanesedrivingconditions.
TheauthorsaregratefultotheauthoritiesofNITWarangal forprovidingallfacilities.
[1] InternationalEnergyAgency.Totalfinalconsumption bysector,2017[Online].
[2] G.A.P. Rao and T.K. Sharma, Engine Emission Control Technologies.AppleAcademicPress(TalyorandFrancis Group),2020.
[3] V.H.Johnson, “Battery Performance Models in ADVISOR,”JournalofPowerSources,110[2],22August 2002, pp.321-329, https://doi.org/10.1016/S03787753(02)00194-5.
[6] C.Celik, G.B.S.Fatma and H. IbrahimSarac, “Effects of Operation Conditions on Direct Borohydride Fuel Cell Performance,” Journal Of Power Sources, 185[1], 15 October 2008, pp.197-201, https://doi.org/10.1016/j.jpowsour.2008.06.066.
[7] B.H.Liu,Z.P.LiandS.Suda,“AnodicOxidationOfAlkali Borohydrides Catalyzed By Nickel,” Journal Of The Electrochemical Society, 150 [3], 7 February 2003, https://doi.org/10.1149/1.1553785.
[8] Z.Liu, H.Zhang, C. Wang, and Z. Mao, “Numerical Simulation For Rib And Channel Position Effect On PEMFC Performances”, International Journal Of Hydrogen Energy, 35[7],April 2010, pp.2802-2806, https://doi.org/10.1016/j.ijhydene.2009.05.020
[9] A.C.Turkmen,S.Salim,andC.Celik,“AnalysisofFuelCell Vehicles with Advisor Software”, Renewable And Sustainable Energy Reviews, 70,April 2017, pp.10661071,https://doi.org/10.1016/j.rser.2016.12.011
[10]O.Barbera,A.Stassi,D.Sebastian,J.L.Bonde,G.Giacoppo, C.D'Urso,V.BaglioandA.S.Aricò,“SimpleAndFunctional DirectMethanolFuelCellStackDesignsForApplication In Portable And Auxiliary Power Units,” International Journal Of Hydrogen Energy, 41[28], 27 July 2016, pp.12320-12329, http://dx.doi.org/10.1016/j.ijhydene.2016.05.135.
[11]K.Haraldsson and K.Wipke, “Evaluating PEM Fuel Cell SystemModels,”JournalofPowerSources,126[1–2],16 February 2004, pp.88-97, https://doi.org/10.1016/j.jpowsour.2003.08.044.
[12]K.V. Koteswara Rao, G.Naga Srinivasulu and V. Venkateswarlu,“AReviewonEnergyAllocationofFuel Cell/Battery/Ultracapacitor for Hybrid Electric Vehicles,”InternationalJournalofEnergyResearch,26 July2018,doi.org/10.1002/er.4166.
[13]Turkmen, A.Can,S. Salim,and C. Celik , “Analysis OfFuelCellVehiclesWithAdvisorSoftware,”Renewable
© 2022, IRJET | Impact Factor value: 7.529 | ISO 9001:2008 Certified Journal | Page118
International Research Journal of Engineering and Technology (IRJET) e-ISSN: 2395-0056
&SustainableEnergyReviews,70,Apr2017,pp.10661071,DOI10.1016/j.rser.2016.12.011.
[14]S.Ahmadi,and S.M.T.Bathaee,“Multi-ObjectiveGenetic OptimizationoftheFuelCellHybridVehicleSupervisory System: Fuzzy Logic And Operating Mode Control Strategies,”InternationalJournalOfHydrogenEnergy, 40 [36], 28 September 2015, pp.12512-12521, http://dx.doi.org/10.1016/j.ijhydene.2015.06.160.
[15]Maxoulis, Tsinoglou andKoltsakis, “Modeling of Automotive Fuel Cell Operation in Driving Cycles,” EnergyConversionandManagement45[4],Mar2004, pp.559-573.
[16]L.N.Degliuomini, D.Feroldi, D.Zumoffen, and Marta Basualdo,“DynamicModelingandControlofaFuelCell
Hybrid Vehicle with Onboard Fuel Processor,” http://dx.doi.org/10.3182/20100705-3-BE-2011.0187
[17]H.S.Das, C.W.Tan and A.H.M. Yatim, “Fuel Cell Hybrid ElectricVehicles:AReviewonPowerConditioningUnits and Topologies,” Renewable and Sustainable Energy Reviews, 76,September 2017, pp.268-291, http://dx.doi.org/10.1016/j.rser.2017.03.056.
[18]G.Zhang,W.ChenandQ.Li,“Modeling,Optimizationand Control of a FC/Battery Hybrid Locomotive Based on ADVISOR,” International Journal of Hydrogen Energy, 42[29], 20 July 2017, pp.18568-18583, https://doi.org/10.1016/j.ijhydene.2017.04.172
[19]D.Feroldi and M.Carignano, “Sizing for Fuel Cell/SupercapacitorHybridVehiclesBasedonStochastic Driving Cycles,” Applied Energy, 183 [1] December 2016, pp.645-658, http://dx.doi.org/10.1016/j.apenergy.2016.09.008
[20]K.Wipke, T.Markel and D.Nelson, “Optimizing Energy ManagementStrategyandDegreeofHybridizationfora Hydrogen Fuel Cell SUV,” https://www.researchgate.net/publication/2868610.
[21]M.Chris, A. Masrur and D.W. Gao, “Modeling And Simulation Of Electric And Hybrid Vehicles,” 04 May 2011,doi.org/10.1002/9781119998914.ch12
[22]Advisor software: National Renewable Energy Laboratory(NREL),Advisor DocumentationAnd Help Files, World Wide Web: 〈http://www.ctts.nrel.gov/analysis/download.html〉
[23]T.Markel,A.Brooker,T.Hendricks,V.Johnson,K.Kelly, B.Kramer,M.O’Keefe,S.SprikandK.Wipke,“ADVISOR: A Systems Analysis Tool For Advanced Vehicle Modelling,”J.PowerSources,110[2],pp.255–266.
[24]Varnhagen,Same,Park and JW, “A Numerical Investigation On The Efficiency Of Range Extending SystemsUsingAdvancedVehicleSimulator,”JournalOf PowerSources196[6],Mar152015,pp.3360-3370.
[25]Avanish Kumar and Thakura, “ADVISOR-Based PerformanceAnalysisOfAHybridElectricVehicleAnd ComparisonWithAConventionalVehicle,”IETEJournal OfResearch,05Nov2020.
[26]Nassif,GG,D.AlmeidaandSCA,“ImpactOfPowertrain HybridizationOnThePerformanceAndCostsOfAFuel CellElectricVehicle,”InternationalJournalOfHydrogen Energy45[41],Aug212020,pp.21722-21737.
Volume: 09 Issue: 10 | Oct 2022 www.irjet.net p-ISSN: 2395-0072 © 2022, IRJET | Impact Factor value: 7.529 | ISO 9001:2008 Certified Journal | Page119