International Research Journal of Engineering and Technology (IRJET)
e-ISSN: 2395-0056
Volume: 08 Issue: 08 | Aug 2021
p-ISSN: 2395-0072
location
Shivgang a suzuki, Udyam nagar, Kolhapu r
Test pH
Point source 8.15
TDS
1150
TSS Oil & grease BOD
www.irjet.net
Results Combined source 6.86
700 600 500
pH
1160
400
TDS
1700
760
300
TSS
10.39
200
Oil and grase
10.95
100
BOD
150
70
0
COD Point source
COD 360 140 Table- XI: Results station for 7th
Combined source
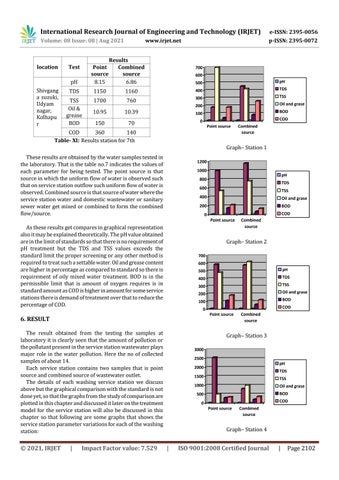
Graph– Station 1 These results are obtained by the water samples tested in the laboratory. That is the table no.7 indicates the values of each parameter for being tested. The point source is that source in which the uniform flow of water is observed such that on service station outflow such uniform flow of water is observed. Combined source is that source of water where the service station water and domestic wastewater or sanitary sewer water get mixed or combined to form the combined flow/source.
1200 1000
pH
800
TDS
600
TSS
400
Oil and grase
200
BOD COD
0 Point source
As these results get compares in graphical representation also it may be explained theoretically. The pH value obtained are in the limit of standards so that there is no requirement of pH treatment but the TDS and TSS values exceeds the standard limit the proper screening or any other method is required to treat such a settable water. Oil and grease content are higher in percentage as compared to standard so there is requirement of oily mixed water treatment. BOD is in the permissible limit that is amount of oxygen requires is in standard amount as COD is higher in amount for some service stations there is demand of treatment over that to reduce the percentage of COD.
Graph– Station 2 700 600 500
pH
400
TDS
300
TSS
200
Oil and grase
100
BOD COD
0 Point source
6. RESULT The result obtained from the testing the samples at laboratory it is clearly seen that the amount of pollution or the pollutant present in the service station wastewater plays major role in the water pollution. Here the no of collected samples of about 14. Each service station contains two samples that is point source and combined source of wastewater outlet. The details of each washing service station we discuss above but the graphical comparison with the standard is not done yet, so that the graphs from the study of comparison are plotted in this chapter and discussed it later on the treatment model for the service station will also be discussed in this chapter so that following are some graphs that shows the service station parameter variations for each of the washing station:
© 2021, IRJET
|
Impact Factor value: 7.529
Combined source
Combined source
Graph– Station 3 3000 2500 pH
2000
TDS
1500
TSS
1000
Oil and grase BOD
500
COD
0 Point source
Combined source
Graph– Station 4
|
ISO 9001:2008 Certified Journal
|
Page 2102


