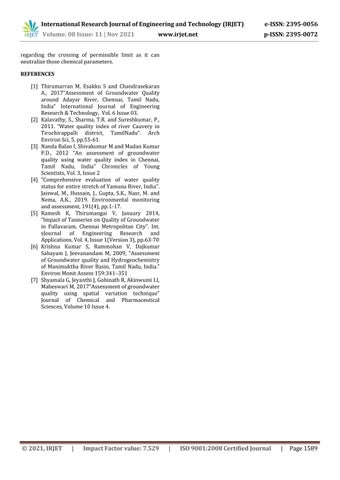
3. METHODOLOGY
International Research Journal of Engineering and Technology (IRJET) e ISSN: 2395 0056 Volume: 08 Issue: 11 | Nov 2021 www.irjet.net p ISSN: 2395 0072 © 2021, IRJET | Impact Factor value: 7.529 | ISO 9001:2008 Certified Journal | Page1584
Water parameters were slightly higher in the wet season than in the dry season. Artificial rechargingofgroundwaterbyrechargewellwill be a good action for the improvement of groundwaterqualityinurbanregion.
1. INTRODUCTION
ASSESSMENT OF GROUNDWATER QUALITY IN AND AROUND AREAS OF PANRUTI BLOCK IN CUDDALORE DISTRICT
1.1 Objectives Themainobjectivesofthisprojectare, To evaluate the groundwater quality in and aroundblocksofPanruti. Tocomparethedifferentvaluesofvariouswater quality parameters among the villages and townsinandaroundPanrutiblock Tocategorizeparametersofthegroundwaterby mapping them with spatial variation method using GIS for giving out clear representation of the distinct components of water which deterioratesthequalityofgroundwaterbybeing very less in its standard quantity or by being morethantheneededappropriatequantity.
To check the suitability of groundwater for drinking purposes using WQI method and BIS standards.
The quantity and composition of the dissolved mineralsinnatural groundwaterdependsuponthetype ofenvironmentalsurroundingithas,whichwill oftenbe changing due to the industrial or developmental activities in that particular region. Quality of groundwater may vary from one place to another place according to the outer environmental conditions which will beconstantlyalteringduetomanmadechanges.So itisessentialtoanalyzethegroundwaterinanareawith various tests to check the various quality of the groundwater which they should be possessing to attain the level of potable water. The experiments will be majorly concentrated on analyzing chemical characteristics of the water sample collected from certain townsandvillages ofPanruti block in Cuddalore district.
2. LITERATURE SUMMARY It is evident that the WQI index for the water sample obtained from industrial areas were greaterthanthenormalwatersamples.
ABSTRACT
The major and essential source of drinking water is groundwater, nearly 80% of our country’s drinking water comes from groundwater and most of the agricultural, industrial and domestic water needs are fulfilled by groundwater, but the quality of groundwater nowadays remains questionableduetothedevelopment of industries and disposal of various kinds of waster into the ground. So this project deals with testing the groundwater based on several water parameters using water quality index (WQI) to find whether they are potable or not according to BIS and WHO standards and creating spatial distribution maps using ArcGIS software for clear representation and understanding of the presence of variousgroundwaterqualityparameters.
So a pretreatment for sewage water coming from industrial area should be done before draining them into nearby water sources and polluted water should be treated with appropriatetreatmenttechnologies.
KEYWORDS Groundwater quality, ArcbGIS, Spatial distribution, water quality index(WQI), BIS, WHO Standards.
S. Jayasri Devi1 , C. Sivasubramanian2 1UG student, Dept. of Civil Engineering, IFET College of Engineering, Tamil Nadu, India. 2Assistant professor, Dept. of Civil Engineering, IFET College of Engineering, Tamil Nadu, India ***

4.3. Bi Carbonates Presence of excess Bi Carbonate in drinking water will lead to alkalizing effect on water increasingthebitternessinwater.All thewatersamples havelimitedbicarbonateconcentration. Thepermissible limit of bicarbonate is 300 500 mg/l. A high level of bicarbonate in your blood are often from alkalosis, a condition that causes a pH increase in tissue. Alagappasamuthiram has less Bi Carbonate content (17.08 mg/l) and Siruvathur has high Bi Carbonate content (288.01 mg/l). Injection of slightly acidified water in the water system may help in reducing the Bi
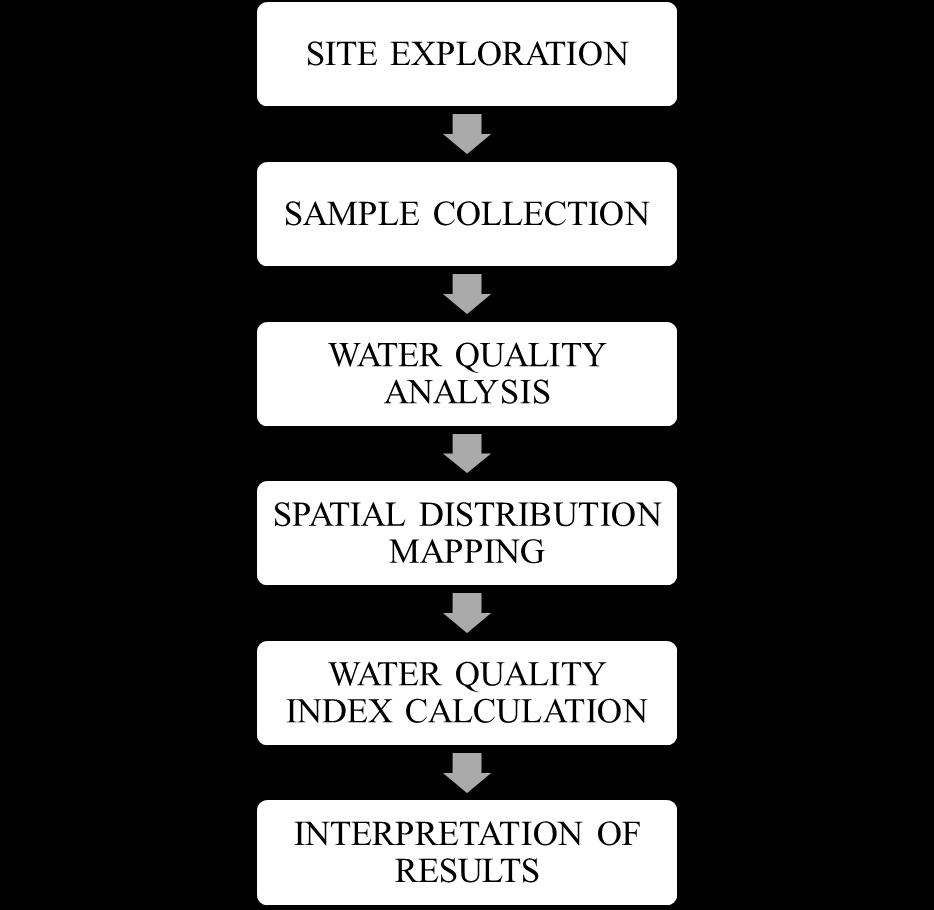
4.1.PARAMETERSpH
It is basically the measure of acidity or basicity of the water, the range being 0 1o 14, water sample containing pH less than 7 will be considered acidic, above 7 will be considered basic and 7 will be neutral. Among these samples collected from villages, 42.5% of themarehavingacidicwaterwhileothersarebeingwith permissiblelimit.HighpHlevelcancauseskintobecome dry,itchyandirritated.Fromtheseresultsitisseenthat Melmambattu has highly acidic water (pH 5.2) and Meliruppu has neutral pH. The water system should be injected with Sodium Carbonate and Sodium Carbonate which will neutralize the effect of low pH and will increaseittotheneutrallevel
International Research Journal of Engineering and Technology (IRJET) e ISSN: 2395 0056 Volume: 08 Issue: 11 | Nov 2021 www.irjet.net p ISSN: 2395 0072 © 2021, IRJET | Impact Factor value: 7.529 | ISO 9001:2008 Certified Journal | Page1585 Fig. 1-Study area Table 1 Parameters analysed S.NO PARAMETERS 1. pH 2. Electricalconductivity 3. Bi Carbonate 4. Chloride 5. Sulphate 6. Calcium 7. Magnesium 8. Sodium 9. Potassium 10. Carbonate 4. SPATIAL DISTRIBUTION OF WATER QUALITY
Fig.2 Spatial distribution of pH 4.2. Electrical Conductivity Electrical conductivity of drinking water should be between 200 800 (μS/cm) Almost 82.5% the water samples from the villages are high in electrical conductivity and so the salt contamination will be more leading to high salinity and poortaste.KadampuliyurhashighEC(4000μS/cm)and SathipattuhaslowEC(380μS/cm)HighECinwatermay be due to high amount of ions which will have adverse effectondrinking.Reverseosmosissystemcanbesetup toreducetheexcessivedissolvedionsinthewater.
Fig. 3 Spatial distribution of Electrical Conductivity

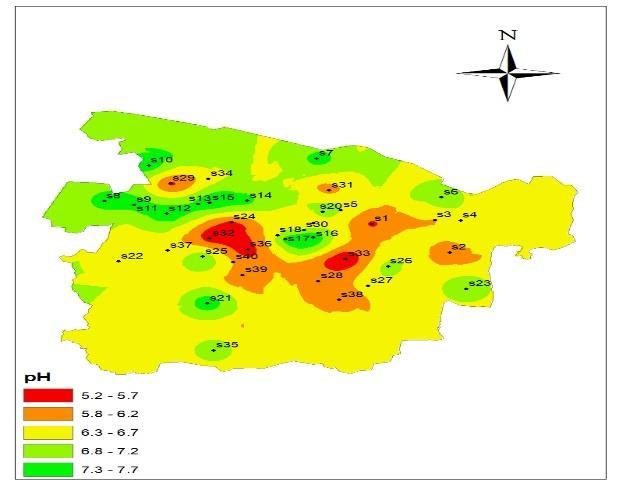

Carbonates, a non harming amount of sulfuric acid or phosphoricacidcanbeinjectedinthosecases. Fig. 4-patial distribution of Bi-Carbonate
4.7. Magnesium
Fig. 6 Spatial distribution of Sulphate
4.5. Sulphate
The permissible limit of Magnesium in drinking water is 30 mg/l. about 30% of the collected samples were exceeding the acceptable limit of Magnesium. People who intakes high Magnesium contaminatedwatercouldhavehighbloodpressureand heart ailments. Palapattu has less Magnesium level (1.944 mg/l) and Marungur has high Magnesium level (95.7 mg/l). Excess Magnesium is treated by water softener where Sodium or Potassium ions will be replacingtheMagnesiumions
4.6. Calcium Permissible limit of Calcium in water 75 mg/l. 15% of the water samples have higher Calcium content than the acceptable limit. Excess of Calcium content deteriorates the quality of water and will cause formation of kidney stones in consumers. Alagappasamuthiram groundwater has less Calcium content (18.83 mg/l) and Keeliruppu has high Calcium content (252.1 mg/l). Addition of Sodium Carbonate in the water system will break the excess Calcium and Magnesiumpresentinwater
4.4. Chloride
Fig. 7 Spatial distribution of Calcium
ThepermissiblelimitofSulphateinwater is 200 mg/l. Over 42.5% of the water samples are high in Sulphate concentration. Excess of Sulphate in water cancausebadodourinwater.Higheramountofsulphate willcausediarrhoeaanddehydration.Palapattuhashigh Sulphate contamination (49.4 mg/l) in water and Poongunam has less Sulphate content (367.4 mg/l). Reverse osmosis system can be set up to reduce the excessiveSulphateionsinthewater.
International Research Journal of Engineering and Technology (IRJET) e ISSN: 2395 0056 Volume: 08 Issue: 11 | Nov 2021 www.irjet.net p ISSN: 2395 0072 © 2021, IRJET | Impact Factor value: 7.529 | ISO 9001:2008 Certified Journal | Page1586
The permissible limit of Chloride in drinking water 250 mg/l. 67.5% of the water source tested are crossing the permissible limit of Chloride whichmaybecausingheartailmentsinpeopleintaking them. Chloride reacts with metal ions to form soluble salts thus increasing levels of metals in drinking water and giving unpleasant taste and odour Palapattu (141.4 mg/l)haslessChloridecontentand Thideerkuppamhas high Chloride content (918.1 mg/l). Excessive Chloride can be taken out of water with the help of reverse osmosisprocessorbyadistiller. Fig. 5 Spatial distribution of Chloride
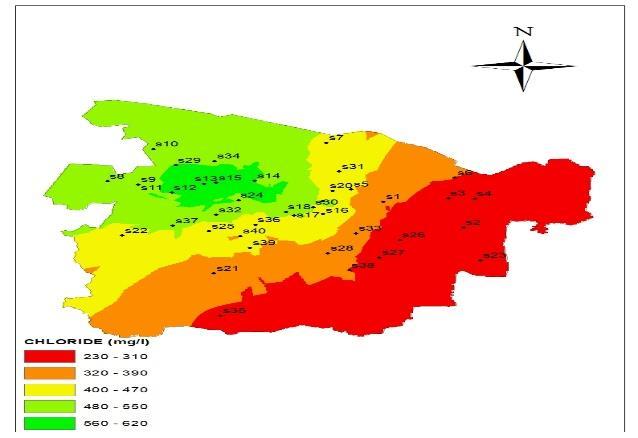
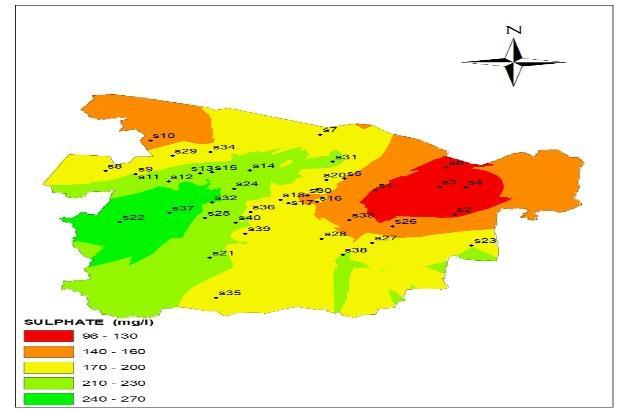
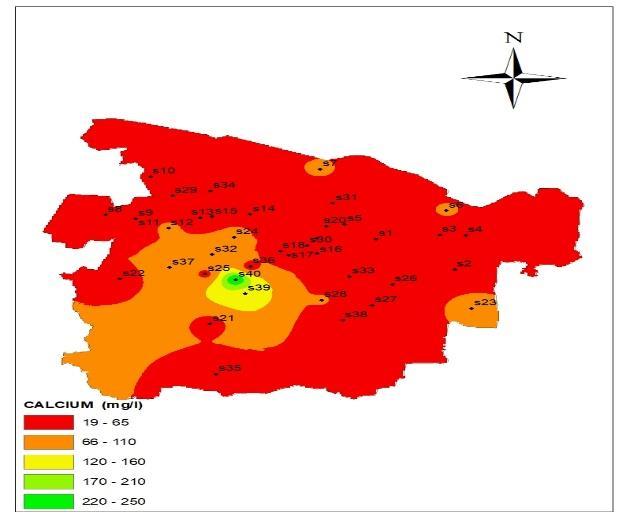
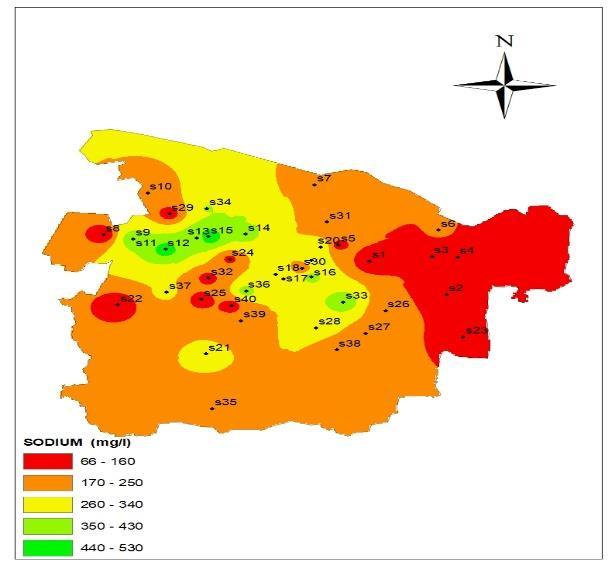
Fig. 8 Spatial distribution of Magnesium 4.8. Sodium Permissible limit of Sodium in drinking water is 200 mg/l. nearly 45% of the obtained samples areexceedingtheacceptablelimitoftheparameter.HighSodiumcontentwillgivepoorsaltytastetothewaterandcancausemuscular exchangeordistillationsystems.
STEP 3 This step deals with assigning of quality rating scaleforeachandeveryparameter. qi =(Ci /Si ).100 Where, qi the quality rating, Ci concentration of each chemical parameter in each water sample in mg/l, and Si guideline value/desirable limit as given in Indian drinkingwaterstandard. For calculating WQI, the sub index (SI) should be found for each chemical parameter, which is then used to find theWQIasperthisequationbelow, SIi =Wi.qi WQI=ΣSIi
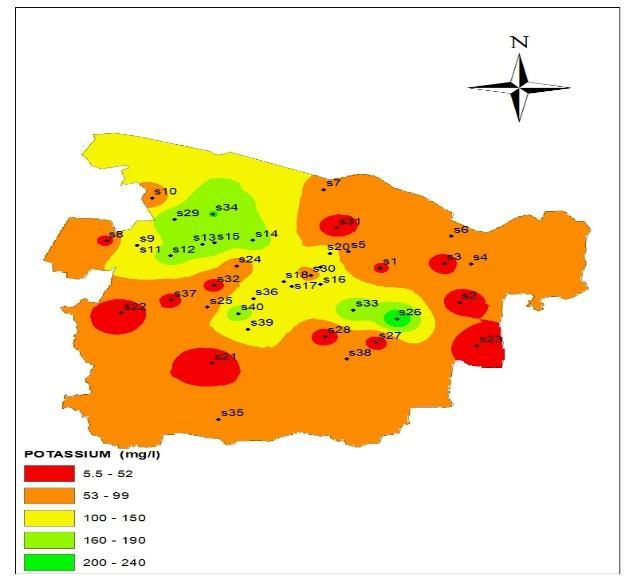
Fig. 9 Spatial distribution of Sodium 4.9. Potassium-PermissiblelimitofPotassiumis50 mg/l. 72.5% ofthesamplesobtainedareexceededthe acceptablelimitaccordingtoBIS.Highamountof PotassiummayleadtoMuscle,fatigue,Weakness, Paralysis,Abnormalheartrhythms(arrhythmias). Reverseosmosisisusuallyusedingettingridofexcess Potassiumionsinthedrinkingwater.Vallam groundwater KeelmambattuhaslessPotassiumcontentandhashighPotassiumcontent.
Thewaterqualityindex(WQI)isasignificant tooltofindthedrinkingwaterqualityinurban,ruraland industrialarea.Therearethreemajorstepstofindwater STEPqualityindex.1Certainweightsshouldbeassignedtothechosen parameter according to their relative importance in the overallqualityofwaterfordrinkingpurposeswhichmay berangingfrom1to5.
International Research Journal of Engineering and Technology (IRJET) e ISSN: 2395 0056 Volume: 08 Issue: 11 | Nov 2021 www.irjet.net p ISSN: 2395 0072 © 2021, IRJET | Impact Factor value: 7.529 | ISO 9001:2008 Certified Journal | Page1587
5. WATER QUALITY INDEX
STEP 2 Relative weight of the parameter should be foundoutusingthefollowingformula Wi=wi /∑wi (i=1ton) Where, Wi Relative weight, wi is the weight of every parameterandn numberofparameter
Fig. 10 Spatial distribution of Potassium 4.10. Carbonate-Carbonate content is negligible in all the water samples collected from the villages. The permissiblelimitforCarbonateis60 120mg/l.Excessof CalciumCarbonatewillincreasethehardnessofwater.

International Research Journal of Engineering and Technology (IRJET) e ISSN: 2395 0056 Volume: 08 Issue: 11 | Nov 2021 www.irjet.net p ISSN: 2395 0072 © 2021, IRJET | Impact Factor value: 7.529 | ISO 9001:2008 Certified Journal | Page1588 Table 2 Water quality index and Corresponding class S.NO WATER QUALITY INDEXVALUE WATER QUALITY CLASSES 1 <50 Excellent 2 50 100 GoodWater 3 100 200 PoorWater 4 200 300 VeryPoorWater 5 >300 Water Unsuitable fordrinking 5.1. ASSESSMENT OF WATER QUALITY INDEX VALUES FOR STUDY AREA The values of examined parameters of groundwater quality data and BIS water quality standards were used for calculating water quality indices. Quality range is assigned on the basis of calculatedvaluesofwaterqualityindices. Table 3-Groundwater parameter and corresponding relative weight OS.N RSPARAMETE VALUERDSTANDA GEWEIGHTAASSIGNED(W I) WWEIGHT(RELATIVE I) 1 pH 6.5 8.5 4 540.1538461 2 Chloride 250 5 920.1923076 3 Sulphate 200 3 150.1153846 4 Calcium 75 4 540.1538461 5 Magnesium 30 3 150.1153846 6 Sodium 200 5 920.1923076 7 Potassium 50 2 770.0769230 Table 4 WQI Values of the collected water samples S.NO SAMPLINGLOCATION WQI 1 SATHIPATTU 61 2 PALAPATTU 46 3 NARIMEDU 50 4 PALUR 89 5 THIRUVADHIGAI 92 6 KEEZHKAVARAPATTU 102 7 RASAPALAYAM 113 8 VEERAPERUMANALLUR 56 9 KUDUMIYANKUPPAM 90 10 SIRUGRAMAM 81 11 THIDEERKUPPAM 215 12 THIRUVAMUR 181 13 KOLAPPAKAM 201 14 ELANDHAMPATTU 201 15 SEMAKOTTAI 178 16 PANIKKANKUPPAM 156 17 PILLAYARPALAYAM 139 18 MALIGAMPATTU 126 19 P.ANDIKUPPAM 131 20 PANRUTI 145 21 VALLAM 110 22 VISUR 110 23 SILAMBINADHANPETTAI 91 24 SIRUVATHUR 99 25 MELIRUPPU 86 26 KEEZHMAMBATTU 112 27 ALAGAPPASAMUTHIRAM 76 28 KADAMPULIYUR 104 29 NATHAM 149 30 PANIKKANKUPPAM 91 31 POONGUNAM 92 32 SEMMEDU 95 33 MELMAMBATTU 115 34 RAYARPURAM 128 35 SORATHUR 81 36 THALAMPATTU 157 37 KARUKKAI 137 38 MARUNGUR 118 39 PERIYAKAATUPALAYAM 131 40 KEELIRIUPPU 143 CONCLUSION Asaresultofthetestsandanalysisitisfound that over 57.5% of the villages are having highly contaminated groundwater and three of them are severely polluted which is too dangerous for the people using them for domestic purposes and those water sourcehavingimproperwaterqualityindexareunfitfor drinking. So it is suggested to follow the above given treatment methods for every polluted water source before letting them to public usage. From the water quality analysis it is found that most of the villages are having deteriorated water quality which has to be treated properly to neglect the health effects arising from them. On the other hand some villages have water quality ranging from excellent to good, according to the water quality index calculations and BIS standards. As a whole electrical conductivity, Chloride and Potassium are the dominant chemical parameters which are exceeding beyondthepermissiblelimitsinthesampling areas. Reverse osmosis is found to be the appropriate treatment for most of the water quality problems
[2] Kalavathy, S., Sharma, T.R. and Sureshkumar, P., 2011. “Water quality index of river Cauvery in Tiruchirappalli district, TamilNadu” . Arch EnvironSci,5,pp.55 61.
[1] Thirumarran M, Esakku S and Chandrasekaran A., 2017“Assessment of Groundwater Quality around Adayar River, Chennai, Tamil Nadu, India” International Journal of Engineering Research&Technology, Vol.6Issue03.
REFERENCES
[3] NandaBalanI,ShivakumarMandMadanKumar P.D., 2012 “An assessment of groundwater quality using water quality index in Chennai, Tamil Nadu, India” Chronicles of Young Scientists,Vol.3,Issue2
International Research Journal of Engineering and Technology (IRJET) e ISSN: 2395 0056 Volume: 08 Issue: 11 | Nov 2021 www.irjet.net p ISSN: 2395 0072 © 2021, IRJET | Impact Factor value: 7.529 | ISO 9001:2008 Certified Journal | Page1589 regarding the crossing of permissible limit as it can neutralizethosechemicalparameters.
[4] ”Comprehensive evaluation of water quality statusforentirestretchofYamunaRiver,India” Jaiswal, M., Hussain, J., Gupta, S.K., Nasr, M. and Nema, A.K., 2019. Environmental monitoring andassessment,191(4),pp.1 17.
[5] Ramesh K, Thirumangai V, January 2014, “ImpactofTanneriesonQualityofGroundwater in Pallavaram, Chennai Metropolitan City”. Int. sJournal of Engineering Research and Applications,Vol.4,Issue1(Version3),pp.63 70 [6] Krishna Kumar S, Rammohan V, Dajkumar Sahayam J, Jeevanandam M, 2009, “Assessment of Groundwater quality and Hydrogeochemistry of Manimuktha River Basin, Tamil Nadu, India.” EnvironMonitAssess159:341 351 [7] ShyamalaG,JeyanthiJ,GobinathR,AkinwumiI.I, MaheswariM,2017“Assessmentofgroundwater quality using spatial variation technique” Journal of Chemical and Pharmaceutical Sciences,Volume10Issue4.
