International Research Journal of Engineering and Technology (IRJET) Volume: 07 Issue: 09 | Sep 2020
www.irjet.net
e-ISSN: 2395-0056 p-ISSN: 2395-0072
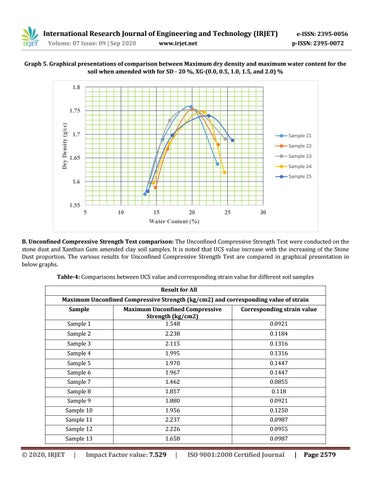
Graph 5. Graphical presentations of comparison between Maximum dry density and maximum water content for the soil when amended with for SD - 20 %, XG-(0.0, 0.5, 1.0, 1.5, and 2.0) % 1.8
Dry Density (g/cc)
1.75
1.7
Sample 21 Sample 22 Sample 23
1.65
Sample 24 Sample 25
1.6
1.55 5
10
15 20 Water Content (%)
25
30
B. Unconfined Compressive Strength Test comparison: The Unconfined Compressive Strength Test were conducted on the stone dust and Xanthan Gum amended clay soil samples. It is noted that UCS value increase with the increasing of the Stone Dust proportion. The various results for Unconfined Compressive Strength Test are compared in graphical presentation in below graphs. Table-4: Comparisons between UCS value and corresponding strain value for different soil samples Result for All Maximum Unconfined Compressive Strength (kg/cm2) and corresponding value of strain Sample
Š 2020, IRJET
Corresponding strain value
Sample 1
Maximum Unconfined Compressive Strength (kg/cm2) 1.548
Sample 2
2.238
0.1184
Sample 3
2.115
0.1316
Sample 4
1.995
0.1316
Sample 5
1.970
0.1447
Sample 6
1.967
0.1447
Sample 7
1.462
0.0855
Sample 8
1.857
0.118
Sample 9
1.880
0.0921
Sample 10
1.956
0.1250
Sample 11
2.237
0.0987
Sample 12
2.226
0.0955
Sample 13
1.658
0.0987
|
Impact Factor value: 7.529
|
0.0921
ISO 9001:2008 Certified Journal
|
Page 2579
