International Research Journal of Engineering and Technology (IRJET)
e-ISSN: 2395-0056
Volume: 07 Issue: 08 | Aug 2020
p-ISSN: 2395-0072
www.irjet.net
Study of Traffic Congestion in Lucknow Wetetsou Losou1, Dr Ravi Prakash Verma2, Mr Kekhriesituo Sachu3 1Student,
Department of CSE, Bansal Institute of Engineering & Technology, Uttar Pradesh, India
2Professor
3Student,
HOD IT, Bansal Institute of Engineering & Technology, Uttar Pradesh, India
Department of CSE, Bansal Institute of Engineering & Technology, Uttar Pradesh, India
---------------------------------------------------------------------***---------------------------------------------------------------------
Abstract - Traffic congestion is one of the major problems
typically done by traffic officers. Other application areas include: surveillance, management of freeway and arterial networks, intersection traffic light control, congestion and incident management.
that are faced in many of the Indian cities along with other countries. Traffic congestion has a negative impact on economy, the environment as well as the overall quality of life. Traffic jamming, road accidents, increase in pollution levels are some of the common traits that can be observed in. Therefore, it is high time to effectively manage the traffic congestion problem. This paper describes the identification of problem or issues that cause traffic congestion, identifying at what time of the day traffic congest the most, which zones has the highest traffic and basing on the findings, necessary suggestions and recommendation are provided so as to bring about improvement in traffic congestion in Lucknow.
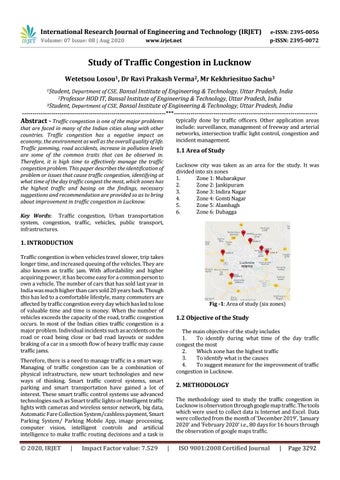
1.1 Area of Study Lucknow city was taken as an area for the study. It was divided into six zones 1. Zone 1: Mubarakpur 2. Zone 2: Jankipuram 3. Zone 3: Indira Nagar 4. Zone 4: Gomti Nagar 5. Zone 5: Alambagh 6. Zone 6: Dubagga
Key Words: Traffic congestion, Urban transportation system, congestion, traffic, vehicles, public transport, infrastructures.
1. INTRODUCTION Traffic congestion is when vehicles travel slower, trip takes longer time, and increased queuing of the vehicles. They are also known as traffic jam. With affordability and higher acquiring power, it has become easy for a common person to own a vehicle. The number of cars that has sold last year in India was much higher than cars sold 20 years back. Though this has led to a comfortable lifestyle, many commuters are affected by traffic congestion every day which has led to lose of valuable time and time is money. When the number of vehicles exceeds the capacity of the road, traffic congestion occurs. In most of the Indian cities traffic congestion is a major problem. Individual incidents such as accidents on the road or road being close or bad road layouts or sudden braking of a car in a smooth flow of heavy traffic may cause traffic jams.
Fig -1: Area of study (six zones)
1.2 Objective of the Study The main objective of the study includes 1. To identify during what time of the day traffic congest the most 2. Which zone has the highest traffic 3. To identify what is the causes 4. To suggest measure for the improvement of traffic congestion in Lucknow.
Therefore, there is a need to manage traffic in a smart way. Managing of traffic congestion can be a combination of physical infrastructure, new smart technologies and new ways of thinking. Smart traffic control systems, smart parking and smart transportation have gained a lot of interest. These smart traffic control systems use advanced technologies such as Smart traffic lights or Intelligent traffic lights with cameras and wireless sensor network, big data, Automatic Fare Collection System/cashless payment, Smart Parking System/ Parking Mobile App, image processing, computer vision, intelligent controls and artificial intelligence to make traffic routing decisions and a task is
© 2020, IRJET
|
Impact Factor value: 7.529
2. METHODOLOGY The methodology used to study the traffic congestion in Lucknow is observation through google map traffic. The tools which were used to collect data is Internet and Excel. Data were collected from the month of ‘December 2019’, ‘January 2020’ and ‘February 2020’ i.e., 80 days for 16 hours through the observation of google maps traffic.
|
ISO 9001:2008 Certified Journal
|
Page 3292