International Research Journal of Engineering and Technology (IRJET)
e-ISSN: 2395 -0056
Volume: 04 Issue: 07 | July -2017
p-ISSN: 2395-0072
www.irjet.net
Comparision of Base Shear Capacity of RC Frame By IDA And SPA Vinod Tiwari1, Dr. Ashok Kasnale2 1PG
student,Department of Civil Engineering Dr. D. Y. Patil School of Engineering& Technology, Pune-412105,India 2Principal, Dr. D. Y. Patil School of Engineering& Technology, Pune-412105,India ---------------------------------------------------------------------***--------------------------------------------------------------------1.2. Incremental Dynamic Analysis of G+7 Building Abstract - Structures subjected to force like earthquake must be resisted by structure as they are dynamic in nature. It causes unsafe condition. Performance based analysis of structure is required. This can be achieved by incremental dynamic analysis (IDA) which can be done by SAP ( static pushover analysis) but in Incremental Dynamic analysis is more accurate. Incremental dynamic analysis involves different intensity of ground motion which is selected for complete collapse. In present work increment dynamic analysis of reinforced concrete G+ 7 and G+ 11 building is carried out buildings susceptible is check, inter story drift ratio from IS 1893 : 2002 is checked. Basic base shear capacity of G+ 7 and G+ 11 are calculated base shear curve of top displacement is compared with SPA (static pushover analysis).pushover analysis is of two types Force control and displacement control. Force control in which lateral loads are applied in small increment. Distance by which structure is proportional to horizontal translation.This paper deals with the Incremental Dynamic analysis of G+7 and G+11 building.
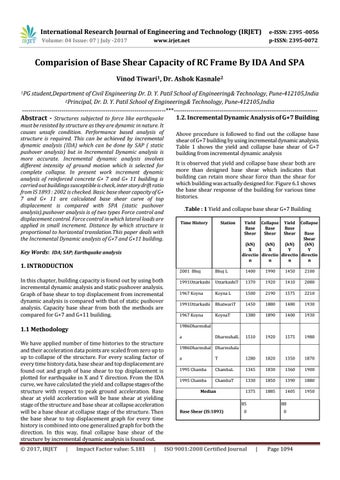
Above procedure is followed to find out the collapse base shear of G+7 building by using incremental dynamic analysis. Table 1 shows the yield and collapse base shear of G+7 building from incremental dynamic analysis It is observed that yield and collapse base shear both are more than designed base shear which indicates that building can retain more shear force than the shear for which building was actually designed for. Figure 6.1 shows the base shear response of the building for various time histories. .Table : 1 Yield and collapse base shear G+7 Building Time History
Station
In this chapter, building capacity is found out by using both incremental dynamic analysis and static pushover analysis. Graph of base shear to top displacement from incremental dynamic analysis is compared with that of static pushover analysis. Capacity base shear from both the methods are compared for G+7 and G+11 building.
Collapse
2001 Bhuj
Bhuj L
1400
1990
1450
2100
1991Uttarkashi
UttarkashiT
1370
1920
1410
2080
1967 Koyna
Koyna L
1500
2190
1575
2210
1991Uttarkashi
BhatwariT
1450
1880
1480
1930
1967 Koyna
KoynaT
1380
1890
1400
1930
DharmshalL
1510
1920
1575
1980
a
We have applied number of time histories to the structure and their acceleration data points are scaled from zero up to up to collapse of the structure. For every scaling factor of every time history data, base shear and top displacement are found out and graph of base shear to top displacement is plotted for earthquake in X and Y direction. From the IDA curve, we have calculated the yield and collapse stages of the structure with respect to peak ground acceleration. Base shear at yield acceleration will be base shear at yielding stage of the structure and base shear at collapse acceleration will be a base shear at collapse stage of the structure. Then the base shear to top displacement graph for every time history is combined into one generalized graph for both the direction. In this way, final collapse base shear of the structure by incremental dynamic analysis is found out. |
Yield Base Shear
1986Dharmshal
1.1 Methodology
Š 2017, IRJET
Collapse Base Shear
Base Shear (kN) (kN) (kN) (kN) X X Y Y directio directio directio directio n n n n
Key Words: IDA; SAP; Earthquake analysis
1. INTRODUCTION
Yield Base Shear
Impact Factor value: 5.181
|
1986Dharmshal Dharmshala a
T
1280
1820
1350
1870
1995 Chamba
ChambaL
1345
1830
1360
1900
1995 Chamba
ChambaT
1330
1850
1390
1880
1375
1885
1405
1950
Median
Base Shear (IS:1893)
85
88
0
0
ISO 9001:2008 Certified Journal
|
Page 1094