International Research Journal of Engineering and Technology (IRJET)
e-ISSN: 2395 -0056
Volume: 04 Issue: 05 | June-2017
p-ISSN: 2395-0072
www.irjet.net
Implementation Of Distributed Canny Edge Detection Technique Heena S. Shaikh, Narayan V. Marathe 1M.Tech
Student,Electronics Department of Walchand college of engineering,Sangli Department of Walchand college of engineering,Sangli ---------------------------------------------------------------------***--------------------------------------------------------------------2 Professor,Electronics
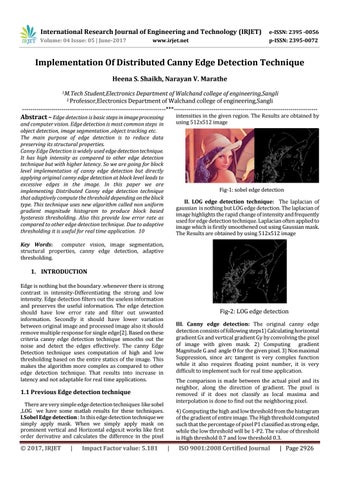
intensities in the given region. The Results are obtained by using 512x512 image
Abstract – Edge detection is basic steps in image processing and computer vision. Edge detection is most common steps in object detection, image segmentation ,object tracking etc. The main purpose of edge detection is to reduce data preserving its structural properties. Canny Edge Detection is widely used edge detection technique. It has high intensity as compared to other edge detection technique but with higher latency. So we are going for block level implementation of canny edge detection but directly applying original canny edge detection at block level leads to excessive edges in the image. In this paper we are implementing Distributed Canny edge detection technique that adaptively compute the threshold depending on the block type. This technique uses new algorithm called non uniform gradient magnitude histogram to produce block based hysteresis thresholding. Also this provide low error rate as compared to other edge detection technique. Due to adaptive thresholding it is useful for real time application. 10
Fig-1: sobel edge detection II. LOG edge detection technique: The laplacian of gaussian is nothing but LOG edge detection. The laplacian of image highlights the rapid change of intensity and frequently used for edge detection technique. Laplacian often applied to image which is firstly smoothened out using Gaussian mask. The Results are obtained by using 512x512 image
Key Words: computer vision, image segmentation, structural properties, canny edge detection, adaptive thresholding.
1. INTRODUCTION Edge is nothing but the boundary .whenever there is strong contrast in intensity-Differentiating the strong and low intensity. Edge detection filters out the useless information and preserves the useful information. The edge detection should have low error rate and filter out unwanted information. Secondly it should have lower variation between original image and processed image also it should remove multiple response for single edge[2]. Based on these criteria canny edge detection technique smooths out the noise and detect the edges effectively. The canny Edge Detection technique uses computation of high and low thresholding based on the entire statics of the image. This makes the algorithm more complex as compared to other edge detection technique. That results into increase in latency and not adaptable for real time applications.
Fig-2: LOG edge detection III. Canny edge detection: The original canny edge detection consists of following steps1) Calculating horizontal gradient Gx and vertical gradient Gy by convolving the pixel of image with given mask. 2) Computing gradient Magnitude G and angle ϴ for the given pixel. 3) Non maximal Suppression, since arc tangent is very complex function while it also requires floating point number, it is very difficult to implement such for real time application. The comparison is made between the actual pixel and its neighbor, along the direction of gradient. The pixel is removed if it does not classify as local maxima and interpolation is done to find out the neighboring pixel.
1.1 Previous Edge detection technique There are very simple edge detection techniques like sobel ,LOG we have some matlab results for these techniques. I.Sobel Edge detection : In this edge detection technique we simply apply mask. When we simply apply mask on prominent vertical and Horizontal edges.it works like first order derivative and calculates the difference in the pixel
© 2017, IRJET
|
Impact Factor value: 5.181
4) Computing the high and low threshold from the histogram of the gradient of entire image. The High threshold computed such that the percentage of pixel P1 classified as strong edge, while the low threshold will be 1-P2. The value of threshold is High threshold 0.7 and low threshold 0.3.
|
ISO 9001:2008 Certified Journal
| Page 2926