
Volume: 11 Issue: 06 | Jun 2024 www.irjet.net
Volume: 11 Issue: 06 | Jun 2024 www.irjet.net
Apoorva Rajpoot, M. Tech Student, Department of Electrical Engineering, Government Women Engineering College, Ajmer.
Pushpendra Singh, Assistant Professor, Department of Electrical Engineering, Government Women Engineering College, Ajmer. ***
Abstract This research proposes a unique technique to optimize the integration of distributed energy resources (DERs) inside distribution networks, with the goal of improving system performance and meeting ancillary service requirements. This study employs Metaheuristic Optimization Techniques, especially a hybrid ABC-WOA algorithm, to determine the ideal position and size of DERs. The proposed model's effectiveness is assessed using detailed simulations of benchmark distribution systems, including the IEEE 33-bus and 69-bus test networks. Using MATLAB 2021a and the MATPOWER 7.1 toolbox, the optimization procedure exhibits remarkable convergence behavior, as shown in convergence graphs for both systems. The findings show considerable improvements in voltage profile and a decrease in active power losses after the installation of DGs, demonstrating the efficacy of the suggested strategy. Detailed analyses, including voltage magnitudes, active power losses, and comparison tables displaying the locations and capacities of the DGs, demonstrate the ABC-WOA-based optimization model's practical feasibility and benefits in improving the integration of DERs into distribution networks
Key Words: Distributed energy resources (DERs), Distribution network, Metaheuristic optimization techniques, ABC-WOA algorithm, System performance, Optimization,Voltageprofile.
In recent years, there have been several improvements in theelectricpowerindustry.Customersarebecomingpickier about dependability and power quality, while distribution network operators (DNOs) are being forced to increase energy efficiency to save costs as a result of the current trend toward deregulation in the power industry. Shunt capacitors (SCs) and distributed generators (DGs) are two examples of distributed energy resources (DERs) that are crucial for obtaining increased energy efficiency in distribution system functioning. To meet smart grid efficiency objectives of loss reduction and high-quality electricity provided to the end user, integrated solutions to well-formulated challenges that reflect the reality on the ground where all such devices coexist are needed[1]. While
improperDERplacementmayraisesystemlossesaswellas networkcapitalandoperatingcosts,optimalDERplacement can enhance network performance in terms of better node voltage profiles, decreased power flows, reduced feeder losses, improved power quality, and reliability of electric supply.RegardlessofthespecificmotivationforaDNO,such as permitting the connection of more DG capacity, decreasing energy losses, or enhancing network dependability, the DG planning tools need to include fundamental network limitations like voltage and heat thresholds[2].
In recent times, there have been several efficacious endeavors to address the issue of the ideal distribution of either SCs or DGs independently[3]. Nevertheless, the deploymentstrategyofDERsintandemismorefeasibleand can independently configure and manage the flow of both reactive and actual power in a distribution network (DN) [4] Using analytical or heuristic techniques, this simultaneousallocationmethodandhaveshownthemutual influence of these devices on the distribution network's performance. An analytical method for the simultaneous installationofSCsandDGstominimizeinvestmentcosts.By using an analytical technique to identify voltage support zones, they narrowed the search area, and then used a hybridABC-WOAtoaddresstheissue.
ABC-WOAtechniquewasusedtoascertaintheidealposition and amount of distributed generation (DG) power factor in order to reduce power losses under different circumstances[5]It has been shown that the results have significantlyimprovedintermsoflossreductionandvoltage profile improvement. A heuristic method in which the best candidatesitesarefoundbyanodesensitivityanalysis,and the capacity of the SCs/DGs is then found through the recommendation of a heuristic curve fitting procedure. To address this multi-objective optimization issue, a combined imperialist competitive algorithm (ICA)–genetic algorithm (GA) approach. Using this strategy, dispersed resource placement and size are initially determined by the ICA, and these solutions are then further refined by the GA operators[6]
International Research Journal of Engineering and Technology (IRJET) e-ISSN: 2395-0056
Volume: 11 Issue: 06 | Jun 2024 www.irjet.net
Toreducepowerlosses,severalDGtypesareusedforactual and reactive power injections. ABC-WOA together with an analytical method is used to address the issue. The authors concluded that bigger systems are better suited for the heuristic method. Nevertheless, the issue goals in these efforts have mainly been loss reduction and node voltage improvement;peakpowerlosses,feedercurrentprofiles,and substation capacityrelease forDER allocation have not been considered.
Another operational technique that has been widely employedtoaccomplishseveralperformancegoals,including power loss reduction, voltage profile improvement, and congestion control, is distribution network reconfiguration, orDNR.Asaresult,acoordinatedstrategyforDERallocation in conjunction with DNR may more successfully accomplish goals like improved substation capacity release, reduced peak power losses, and greater energy efficiency. The electricity distribution company typically installs SCs, although private investors own DGs. In order to assign DGs and SCs concurrently, the electric utility should provide the DGinvestoracoordinatedsolutionforthelocationand scale of DERs. As a matter of fact, a concerted effort of this kind may provide the greatest possible advantages for the networkoperatorand/orusers,aswellasassesstheviability of DER investment in comparison to other conventional planningchoices[7]
appropriate placement of DERs in DN requires determining the appropriate quantity, size, and location. It is a nonlinear, complicatedcombinatorialoptimizationproblem.Swarmand evolutionary optimization approaches, such as GA and PSO, have been shown to achieve global or near-global optima. When applying these approaches to large-scale applications[8], it's important to prevent premature or sluggishconvergenceduetothevastsearchareaavailable.
Only a few of the highest-priority nodes on this list are chosenforDERallocation.However,thesemethodologiesare not infallible and only give general recommendations on the importance of prospective nodes. The node sensitivities are determinedassumingnosuchdevicesareinstalled.Selecting just the top few nodes as sensitive components did not provide an accurate representation of the distribution network[9].
ABC's mechanical bee hive contains three distinct species: resorted to the use of bees, which are tasked with finding specificfoodsources;observerbees,scoutbees,whohuntfor food sources at random, and worker bees, who watch the
utilized bees dance around the hive to choose a food source, are examples of the former. Observers and observers are commonly referred to as jobless beekeepers since they are unemployed. Initially, it is up to the scout bees to locate all sourcesoffood.
HereishowtheABCalgorithmoftenworks[10]:
Initializationphase-
The scout bees set the control parameters and initiate the population of food source vectors (m=1....SN, SN:). Each nutrient source, denoted by, represents a vector solution to an optimization problem where the objective function is minimized by optimizing a set of n independent variables, denoted by [11], It's possible to use the following definition whilesettingthingsup:
mxxxx y=l+rand(0,1)*(u-l) (1)
EmployeesBeesPhase-
Utilized bees will seek out new food sources close to those they've previously visited and remembered providing a higherconcentrationofnectar.Theylookaroundtheareafor food sources and assess their viability (fitness). [12] They may,forinstance,use the formula thatisincludedinsidethe equationinordertodiscoverafoodsourcethatissituatedin theimmediatearea:
mxmxmxmxkx υ=y+f(y-y) (2)
where is a randomly chosen food source, is a parameter index determined at random, and is a randomly chosen integer between and [-a, a]. After establishing fitness, a greedyselectionismadebetweenitandexistingfoodsource. Theformulabelowmaybeusedtocalculatethefitnessvalue ofthesolution forminimizationproblems.
OnlookerBeesphase-
There are two categories of bees who are unable to find work: onlooker bees and scout bees. Using the term presentedinequation,youcancomputetheprobabilityvalue withwhichanobserverbeechooses.
International Research Journal of Engineering and Technology (IRJET) e-ISSN: 2395-0056
Volume: 11 Issue: 06 | Jun 2024 www.irjet.net
Anobserverbeepicksafoodsourceatrandom,andthenuses the equation to find a nearby source and assess its fitness. Between and, Like the utilizing bee's phase, self-absorbed selectionisutilizedduringthisphase.
The Whale Optimization programme (WOA) is an optimization programme that is built on how humpback whalesinteractwitheachotherandhowtheyhunt.TheWOA programme tries to find food in the water like humpback whalesdo.IntheWOAalgorithm,apointvectorinthesearch space is used to show each possible answer. The algorithm startswithagroupofpossibleanswersthataregeneratedat randomfromthesearchfield.Apossiblesolution'squalityis judgedbyhowwellitanswerstheoptimizationproblem[13] This is done with a fitness function. The algorithm works by going through several steps called iterations. Each iteration has three main steps: Search, surround, and bubble are all options.Duringthesearchstage,thepositionofeachfeasible solution is modified such that it is closer to the best answer identified so far. [14]. This step is a simulation of how humpbackwhaleslookforfood.Theydothisbyfollowingthe bestavailablesigns.
TheWOAalgorithmhasbeenshowntobeeffectiveatsolving a wide range of optimization problems, such as those in engineering design, data mining, and machine learning. The methodiseasytouseandonlyhasafewsettingsthatneedto betweaked.But,likeotheroptimizationalgorithms,theWOA algorithm's success depends on the problem being solved and how the algorithm settings are set [15]. So, to get the best results for a given problem, it is important to carefully tunethealgorithm'ssettings[16].
Table 1 WhaleOptimizationAlgorithm
Algorithm 1 The Standard Whale Optimization Algorithm
Initializeapopulationofrandomwhales W
thebestsearchagent t
While (t iterations) foreachwhale UpdateWOAparameters andp) if (0.5) p if BL
1 . t WWBDis
endif
p-ISSN: 2395-0072
elseif (0.5) p
endif endfor
Evaluatethewhale 1 t W
Update W if 1 t W ifbetter 1 tt endwhile return W
Where,
ix denotesthesetofhyperparametersatthatiteration. Nistheoverallnumberofiterations.
1 ()() ii MetricxMetricx indicates the improvement in the segmentation measure gained by adjusting the hyper parametersfromiteration 1 i to i iteration.
The objective function ()fx computes the total improvementinthesegmentationmetricduringtheduration of the optimization procedure. The hybrid ABC-WOA algorithm attempts to maximize this objective function by repeatedly modifying the hyper parameters to improve segmentationperformance.
This study utilized a hybrid ABC-WOA optimization method to specifically select relevant features associated with soil moisture and temperature data from the provided dataset. Through this approach, we effectively isolated critical information,essentialforsubsequentanalysisandmodelling. Thisfeatureselectionprocessaimedtoenhancetheaccuracy andefficacyofourstudy'spredictivemodelsinthecontextof smartirrigationsystems.
Table 2 ProposedAlgorithm
Algorithm 1 Hybrid ABC-WOA Algorithm for Hyper parameter Tuning
1:Initializeparameters,hyperparameters,populationforABC andWOA
2: while notconvergencecriteriamet do 3: for eachsolutioninABCpopulation do 4: Employbeeforexploration
5: Evaluatefitness
6: Updatesolution
7: end for
8: for eachsolutioninWOApopulation do 9: UpdatepositionusingWOAequations
10: Evaluatefitness
International Research Journal of Engineering and Technology (IRJET) e-ISSN: 2395-0056
Volume: 11 Issue: 06 | Jun 2024 www.irjet.net p-ISSN: 2395-0072
11: end for 12: Select best solutions from both ABC and WOA populations
13: UpdatehyperparametersofVGG19model 14: Checkforconvergence 15: end while
The optimal allocation of DERs aims to maximize annual savings and profit by reducing charges for energy losses, peak power losses, and substation capacity release, while maintaining better node voltage and feeder current profiles undermulti-levelloads.Apenaltyfunctiontechniqueisgiven for determining the maximum node voltage variation and temperature limit of distribution feeders. The objective functionisexpressedasfollows:
node voltage penalty function pfV and the feeder current penaltyfunction pf I ,asseenbelow:
where N and L represent the number of system nodes and load levels, respectively. The multi-level piece-wise yearly load profile considers the number of load levels and their durations ( LN and j H respectively). , lossbjP and , lossajP representpowerlossesforuncompensatedandcompensated systems at the thj load level, respectively. , lossbP and , lossaP represent peak power losses for uncompensated and compensated systems. p bS represents the base case substation capacity, while p a S represents the sub-station capacity after DER allocation and reconfiguration. SCQ and DGP represent reactive and active compensation at a candidate node. epSSCDGKKKKK are the unit costs of energy, peak power losses, sub-station capacity release, shuntcapacitorinstallation,andDGinstallation,respectively. Thefirstandsecondtermsreflectthecostsofreducingyearly energylossandpeakpowerloss,respectively.Thethirdterm covers the yearly costs for substation capacity release. The fourth and final periods represent the yearly costs for installing SCs and DGs, respectively. The penalty function is designed to address node voltage variations and feeder currentconstraints.Itisdefinedasthegeometricmeanofthe
Equation (3) demonstrates that pfV is derived by assessing thehighestdeviationinnodevoltageacrossallsystemnodes, consideringallloadlevels.Here, njV representsthevoltage deviation of the thn node from the source voltage at the jth load level. Similarly, the value of pf I is calculated using equation (4), where njI represents the deviation of the current in the thn feeder from its rated ampacity during the thj loadlevel.Thevaluesof njnjIandV aredeterminedby using equations (5) and (6), respectively. A soft voltage limitation is implemented in (5) by establishing a minimum specified node voltage, min S V , which must be maintained below the minimum allowable node voltage, minV , as determinedbythepowerregulatingauthority. max V refersto the highest allowable voltage at a node as determined by regulatory bodies, whereas max n I represents the designated lineampacityforthenthline.
As follows, the capital recovery factor for DER investmentsarecalculated:
wheredrepresentsthediscountrateandYdenotesthe DER allocation project's planning horizon. Thesubsequentoperationallimitationsareimplemented:
International Research Journal of Engineering and Technology (IRJET) e-ISSN: 2395-0056
Volume: 11 Issue: 06 | Jun 2024 www.irjet.net p-ISSN: 2395-0072
()0; j ghjL (12)
where () j gh denotesthecollectionofpowerflowequations applicabletothe thj loadlevel. At each node, the aggregate active and reactive power introduced by DG and SCs must remain within the permissiblerange,whichisdelineatedasfollows:
,min,,max; SCSCnSC QQQnN (13)
,min,,max; DGDGnDG PPPnN (14)
where ,minDGP and ,maxDGP represent, respectively, the minimum and maximum active power generation limits at a node.Inthesamemanner,theminimumandmaximumlimits on reactive power generation at a node are denoted as ,minSCQ and ,maxSCQ , respectively. Thefollowingarethedefinedsystempowergenerationlimits forSCsandDGs:
, 1 ; loc SCnD n QQnN (15)
, 1 ; loc DGnD n PPnN (16)
It is postulated that the combined active and reactive power injected by DGs and SCs at every candidate node location should be in excess of the system's nominal active power demand DQ and reactive power demand DP , respectively. Prohibited by equations (13) and (14) is the duplication of candidatesitesforDERs.
,, ;, SCaSCb NNabN (17)
,, ;,DGaDGb NNabN (18)
where NDG and SC refer, correspondingly, to candidate sites for DGs and SCs. Given that discrete sizes of DERs are commerciallyavailable,theyaremodeledasfollows:
;0,1,2,...,SCbbb QKQKnsc (19)
;0,1,2,...,DGddd PKPKndg (20)
bQ and dP denotetheunitsizeofSCsandDGs,respectively.
bK and dK denote the quantity of capacitor banks and discretedispatchesofDG,respectively. Initially optimizing the solution, it determines the ideal location and dimensions of Distributed Energy Resources (DERs),consideringtheyearlydemandprofile.
Next, the optimization process is performed individually for each demand level to find the most efficient power distribution of the deployed Distributed Energy Resources
(DERs). Nevertheless, the locations for Distributed Energy Resources (DERs) remain fixed and their capacity is limited to the size determined by the solution reached. The supplementary limitations necessary to ascertain the most efficient allocations of SCs and DGs are represented as follows:
,, ;0,1,2,...,/ SCnttSCn QKQKQQ (21)
,, ;0,1,2,...,/ DGnmdmdDGn PKPKPP (22)
P
and Q indicatetherelativediscretesizesofavailable commercialSCsandDGs.
AfterproperlylocatingDistributedEnergyResources(DERs), the distribution network is changed individually for each demand level. The reconfiguration issue aims to reduce actual power loss lossP at the thj load level, while ensuring compliance with different operational restrictions of the network. The mathematical framework for the DNR issue is expressedas:
Theactiveandreactivepowerflowsinthenthbranchofthe system are denoted by njP and njQ , respectively, where E indicates the total number of branches. The symbol n R represents the resistance of the thn branch, whereas njV representsthevoltageatthe thn nodeatthe thj loadlevel. Equation(19)isboundbythefollowinglimitations:
1. Radial topology constraint
The revised network configuration must be radial, meaning that it should not have any closed paths. Thus, the radiality constraintfortherth radialtopologyisdefinedas: ()0; j rjL (24)
() j r representsthesymbolicrepresentationofaclosed loop.
2. Node voltage constraint
DuringtheDNR,astringentvoltagelimitisimplementedasa crucial operating strategy for the network. During the optimization process, it is necessary to ensure that all node voltages njV of the system remain within the specified minimum( minV )andmaximum( max V )limits. minmax;, nj VVVnNjL (25)
Thepowerflowconstraintisdeterminedbyequation(8).
2023, IRJET | Impact Factor value: 8.226 | ISO 9001:2008
International Research Journal of Engineering and Technology (IRJET) e-ISSN: 2395-0056
Volume: 11 Issue: 06 | Jun 2024 www.irjet.net p-ISSN: 2395-0072
Theradialitylimitationisthemostsignificant obstaclewhen addressingtheissueofnetworkreconfiguration.Theissueis solved using the codification described in[17] in the current study. This is a rule-based method for detecting and correcting radial topologies that are not practical. Based on this codification, three criteria have been formulated using graph theory to detect and rectify infeasible individuals that mayarisethroughoutthecomputingprocess.
Simulation results:
The proposed approach is tested using IEEE 33-bus and 69bus test distribution systems. In matlab 2021a, the obtained resultsarebriefedoutinthissectionasfollows.
IEEE-69 and 33 bus system:
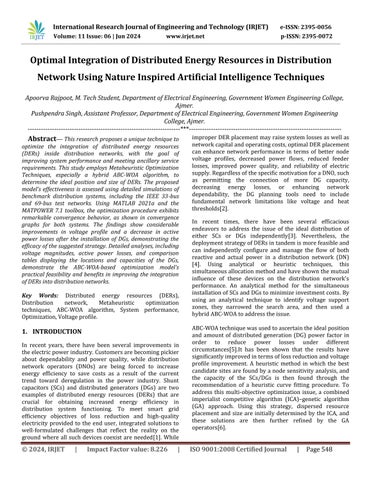
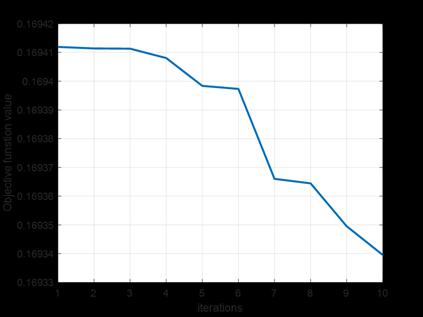
TheIEEE69,33BUSsystemsareutilizedbyusingmatpower 7.1 toolkit and the optimal locations for DG’s and capacities are obtained using a hybrid ABC-WOA algorithm. figure1 &2 shows the objective function value converges over the given numberofiterations.
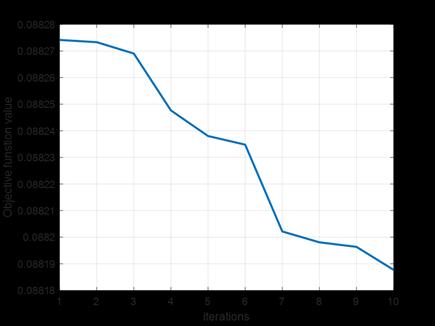
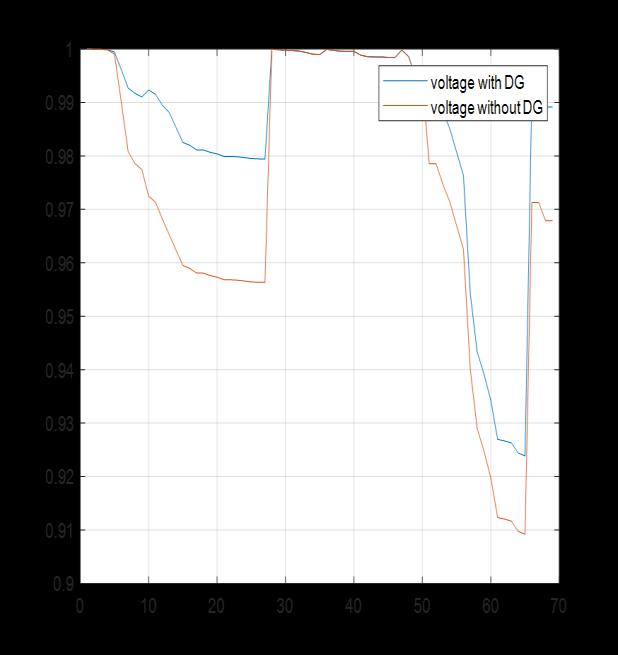
The obtained voltage magnitudes with and without DG placementofa69and33bussystemisshowninfig3and4. It is observed that is voltage profile enhances due to the placementofDG’s.
3:69-Busvoltageprofile
International Research Journal of Engineering and Technology (IRJET) e-ISSN: 2395-0056
Volume: 11 Issue: 06 | Jun 2024 www.irjet.net p-ISSN: 2395-0072
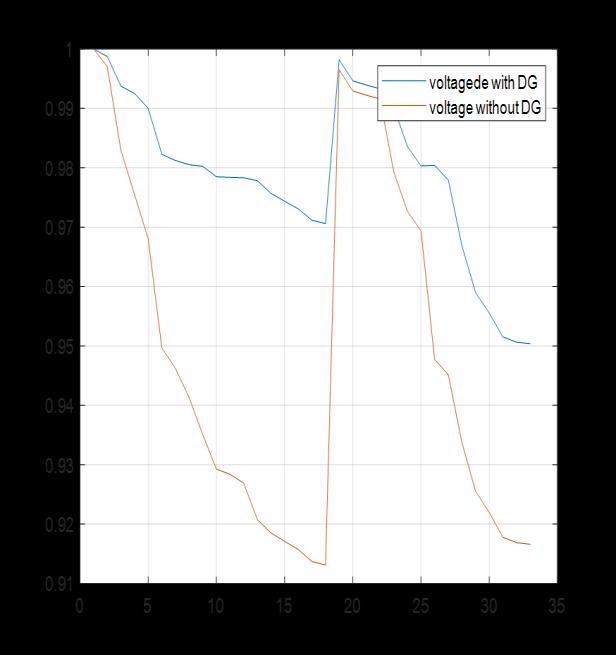
Figure 4:33-Busvoltageprofile
Infigure5 and 6 depicts theactivepower loss of the 33and 69 bus systems, and it is observable that the loss is significantlyreducesduetotheplacementsofDG’s.
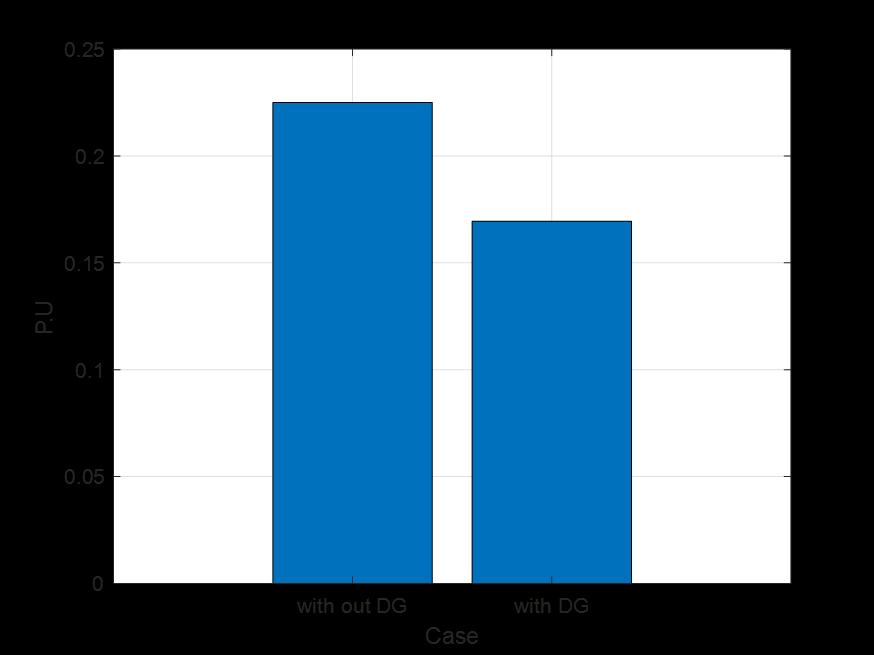
Figure 5-busactivepowerloss
Figure 6:33-bus active power loss
ThelocationandcapacityofplacedDG’saregivenintable3.
Table 3 Comparisontable
Thesuggestedtechnique,testedonboththeIEEE33-busand 69-bus test distribution systems, yields encouraging results, as seen by simulation results. Using the MATLAB 2021a environment and the hybrid ABC-WOA method for optimum DG placement, the research successfully demonstrates system performance improvements. Figures 1 and 2 provide convergence graphs for objective function values across iterations, demonstrating the effectiveness of the optimizationprocess.Thesubsequentexaminationofvoltage profiles, shown in Figures 3 and 4, demonstrates the real advantages of DG deployment, with significant increases in voltage magnitudes throughout both systems. Furthermore, the decrease in active power losses, as shown in Figures 5 and 6, supports the suggested methodology's usefulness in
International Research Journal of Engineering and Technology (IRJET) e-ISSN: 2395-0056
Volume: 11 Issue: 06 | Jun 2024 www.irjet.net p-ISSN: 2395-0072
improving system efficiency. Table 3 contains a thorough comparison of the locations and capabilities of the deployed DGs, which provides insights into their strategic deployment withinthesystems.Overall,thesefindingssupportthehybrid ABC-WOA algorithm's practicality and usefulness in optimizing DG placement, which contributes to improved system performance, voltage stability, and reduced power lossesinboth33-busand69-busdistributionsystems.
[1] M. El-Hawary, “The Smart Grid–State-of-the-Art and FutureTrends,” Electr. Power Components Syst.,2014.
[2] G. P. Keane, A.; Ochoa, L.F.; Borges, C.L.T.; Ault, G.W.; Alarcon-Rodriguez, A.D.; Currie, R.A.F.; Pilo, F.; Dent, C.J.; Harrison, “State-of-the-Art Techniques and ChallengesAheadforDistributedGenerationPlanning andOptimization,” IEEE Trans. Power Syst.,2013.
[3] D. Das, “Optimal placement of capacitors in radial distribution system using a Fuzzy-GA method,” Int. J. Electr. Power Energy Syst.,2008.
[4] A. Nabavi and A. Akbarimajd, “A Method for Placement of DG Units in Distribution Networks,” IEEE Trans. Power Deliv.,2000.
[5] F. S. Abu-Mouti, “Optimal Distributed Generation Allocation and Sizing in Distributed Systems via Artificial Bee Colony Algorithm,” IEEE Trans. Power Deliv.,2011.
[6] M.Moradi,“Anefficienthybridmethodforsolvingthe optimal sitting and sizing problem of DG and shunt capacitor banks simultaneously based on imperialist competitive algorithm and genetic algorithm,” Int. J. Electr. Power Energy Syst.,2014.
[7] P. S. Georgilakis, “Optimal Distributed Generation Placement in Power Distribution Networks: Models, Methods,andFutureResearch,” Power Syst.,2013.
[8] D. Kaur, “Multiperiod shunt capacitor allocation in radial distribution systems,” Int. J. Electr. Power & Energy Syst.,2013.
[9] A. El-Fergany, “Cuckoo Search-based Algorithm for Optimal Shunt Capacitors Allocations in Distribution Networks,” Electr. Power Components Syst.,2013.
[10] G.S.C.aAwaisAhmada,MuradKhanb,AnandPaulc, Sadia Din c, M. Mazhar Rathore c, Gwanggil Jeon d, “Toward modeling and optimization of features
selectioninBigData based social InternetofThings,” Futur. Gener. Comput. Syst.,2018.
[11] X. L. d Shan Jiang a, Jiannong Cao a, Hanqing Wu a, Kongyang Chen b c, “Privacy-preserving and efficient data sharing for blockchain-based intelligent transportationsystems,” Inf. Sci. (Ny).,2023.
[12] A. P. Dikshit, A. P. Sengupta, and A. P. Bajpai, “Recent Trends on Privacy-Preserving Technologies under Standardization at the IETF,” ACM SIGCOMM Comput. Commun. Rev.,2023.
[13] A. T. Siahmarzkooh and M. Alimardani, “A Novel Anomaly-based Intrusion Detection System using Whale Optimization Algorithm WOA-Based Intrusion Detection System,” … J. Web Res.,no.December2021, 2021.
[14] S. Chowdhury, P. Mayilvahanan, and R. Govindaraj, “Optimal feature extraction and classificationoriented medical insurance prediction model: machine learning integrated with the internet of things,” Int. J. Comput. Appl., vol. 44, no. 3, pp. 278–290,2022,doi:10.1080/1206212X.2020.1733307.
[15] M. Shakil, “( 2019 ) A novel dynamic framework to detect DDoS in SDN using metaheuris- tic clustering . Transactions on Emerging Telecommunications Technologies . Downloaded from : https://espace.mmu.ac.uk/622897/ Publisher : Wiley A Novel DynamicFrameworktodetec,”vol.33,2019.
[16] L.Haghnegahdarand Y. Wang,“Awhaleoptimization algorithm-trained artificial neural network for smart grid cyber intrusion detection,” Neural Comput. Appl., vol. 32, no. 13, pp. 9427–9441, 2020, doi: 10.1007/s00521-019-04453-w.
[17] K. R. Swarnkar, Anil ; Gupta, Nikhil ; Niazi, “A novel codification for meta-heuristic techniques used in distribution network reconfiguration,” Electr. Power Syst. Res.,2011.