
International Research Journal of Engineering and Technology (IRJET) e-ISSN: 2395-0056
Volume: 11 Issue: 06 | Jun 2024 www.irjet.net p-ISSN: 2395-0072
International Research Journal of Engineering and Technology (IRJET) e-ISSN: 2395-0056
Volume: 11 Issue: 06 | Jun 2024 www.irjet.net p-ISSN: 2395-0072
Emma Foley1,2
1Graduate Research Assistant, Bredesen Center, University of Tennessee, TN, United States 2Grid Communication and Security, Oak Ridge National Laboratory, TN, United States
Abstract –This paper describes an implementation of warped Gaussian process using a simple example. The results show the advantages of this method over a traditional Gaussian process. The flexibility of the warped Gaussian process maintains interpretability and mathematical foundation while accounting for nonGaussian and/or noisy data. These features provide a basis for using this method in power grid applications, where this methodisunderrepresentedintheliterature Asexemplified by measurements taken in the Autonomous Intelligence Measurement Sensors and Systems (AIMS) project, data collected from sensors to support grid operations is nonGaussian and noisy in nature. Warped Gaussian process is a flexible method suitable for analyzing multiple different typesofpowergriddata.
Key Words: Gaussian,warpingfunction,tutorial,sensing, smartgrid
A Warped Gaussian Process (WGP) is a variation of the traditionalGaussianProcess(GP).Thismethodintroduces awarpingfunctionthatcanaccountfornon-Gaussiandata, non-Gaussian noise, and capture more of the uncertainty in the data than the traditional Gaussian Process [1]. This tutorial will walk through the mathematical background andpresentastraightforwardexampleusingPython[2]
2.1
In a traditional GP, we define a prior distribution over multiple functions so that we can infer a posterior distribution that better represents the actual underlying distribution. Once the posterior is determined, it can be used to calculate mean, variance, etc. GPs are particularly useful froma function spaceperspective [3],whichishow we will proceed in this tutorial. First, define X to be a vector of random variables that follow a Gaussian distribution,then
[ ]
where µ is the mean and Σ is the covariance matrix. Then there is a corresponding collection of function values that alsofollowsaGaussiandistribution:
f(x)=[f(x1)f(x2) … f(xn)]T
By definition, a GP is a collection of random variables whichhaveajointGaussiandistribution[4].Thus, f(x)isa Gaussianprocessandcanbefurtherdefinedasfollows:
f(x)∼GP(m(x),k(x,x ′))
m(x)=E[f(x)]
k(x,x ′) =
E[(f(x) m(x))(f(x ′) m(x ′))]+δijσ2
ϵ ∼N(0, σ2)
where m(x) is the mean function, k(x,x ′) is the covariance function(alsoknownasakernel), δ istheKroneckerdelta, and ϵ is the independent and identically distributed Gaussiannoise.
Inordertowarptheobservationspacetolatentspace,let z beavectoroflatenttargetvaluesmodelledbyaGP.The nonlinear monotonic function g maps all the entries from theactualtargetspacetothelatentspace:
zn = g(f(x);Ψ)
where Ψ is a parameter. The function g can be any functionbutmustbemonotonictomaintainthevalidityof the probability distribution over f(x). Once the target values have been warped into latent space, GP progresses asnormalusing z.Theconditionaldistributiondetermines thepredictiveequationsaccountingfornoise:
f∗|Z,f + ϵ,Z∗∼N(f∗,cov(f∗)) ≜E[Z,f + ϵ,Z∗]= K(Z∗,Z)[K(Z,Z)+σ2I] 1[f + ϵ]
cov(f∗)= K(Z∗,Z∗) K(Z∗,Z)[K(Z,Z)+σ2I] 1K(Z,Z∗)
wherethestarsubscriptdenotesdatafromthetestsubset. Themarginallikelihoodisdefinedbelow:
( | ) [ ] [ ] [ ] [ ]
International Research Journal of Engineering and Technology (IRJET) e-ISSN: 2395-0056
Volume: 11 Issue: 06 | Jun 2024 www.irjet.net p-ISSN: 2395-0072
OnceyouhavetheGaussianbasedonthelatentspace,that Gaussian is passed back through the warping function to get the distribution intheobservation space, the shape of whichwilldependonthewarpingfunction.Extractingthe meanandmedianisdescribedbelow:
f(xn+1)med = g 1(z ˆ n+1)
E(f(xn+1))=E(g 1)
In cases where the inverse of the warping function is undefined,itwillneedtobeapproximated.
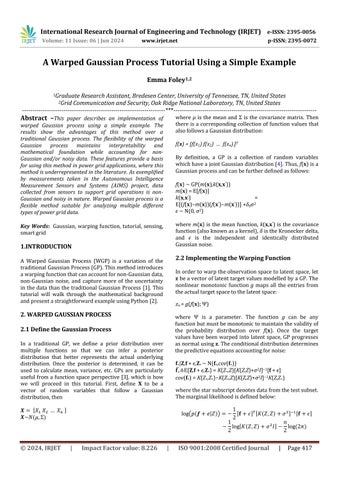
In this section we will use a simple example to demonstrate the benefits of WGP. The function f(x) = x ∗ sin(x) defines the dataset over π to π with additional Gaussian noise inserted. Chart 1 shows the underlying function and noisy observation data. The data is split into training and test data for analysis. The chosen warping function is (see Chart 2). Once the data has beenwarpedintolatentspace,GPprogressesasdescribed inSection1,treating z asthetargetvalues. Chart3shows the heatmaps of the covariance matrices for the warped targets that will be used to calculate predictions. The predictionsfromthewarpedtargetvaluesarethenpassed back through the warping function to retrieve the predictions in the true observation space where f(x) are the target values. Chart 4 shows the results of the WGP methodaswellasatraditionalGPmethodforcomparison. The predictions are charted with dashed lines and the 95%confidenceintervalsareshadedinlightgray(GP)and darkgray(WGP).
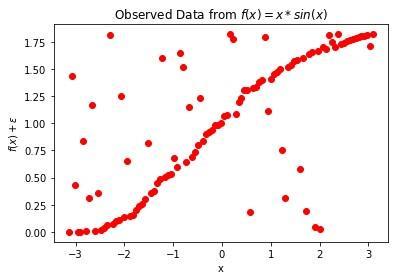
Chart -1:Observeddata f(x)= x ∗ sin(x)+ ϵ
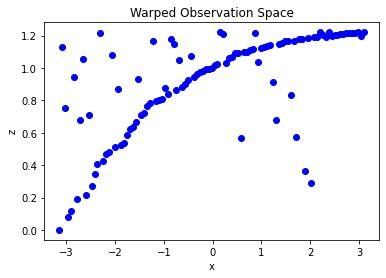
Chart -2:Observeddataafterbeingtransformedbythe warpingfunction (a) (b) (c)
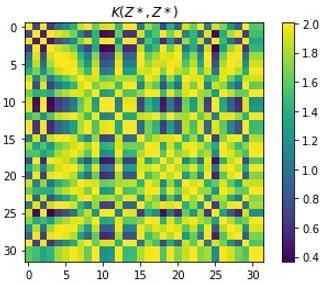
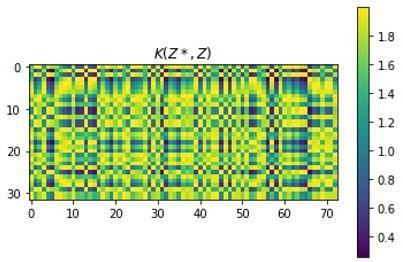
Chart-3:Covariancecalculationsonthewarpedtargets, z: (a) K(Z,Z),(b) K(Z*,Z*),(c) K(Z*,Z)
International Research Journal of Engineering and Technology (IRJET) e-ISSN: 2395-0056
Volume: 11 Issue: 06 | Jun 2024 www.irjet.net p-ISSN: 2395-0072
The results of this example show the advantage WGP has inmodelingnoise.AsshowninChart4,theGPpredictions do closely follow the underlying function f(x) = x ∗ sin(x), butattheexpenseofcapturingthenoisinessofthedata.In a real-world scenario, noise is often a factor and must be modelledaccurately.Inthisexample,theaddednoisewas Gaussian,butthatneednotbethecase.ThenatureofWGP allows it to model non-Gaussian noise. The WGP better approximates all the data over the entire distribution, which leads to lower error values (shown in Table 1) in bothmeanabsoluteerrorandmeansquareerror.
Table -1: Resultsofanexampleusing f(x)= x ∗ sin(x): WGPclearlyoutperformsGPintermsofmeanabsolute errorandmeansquareerror.
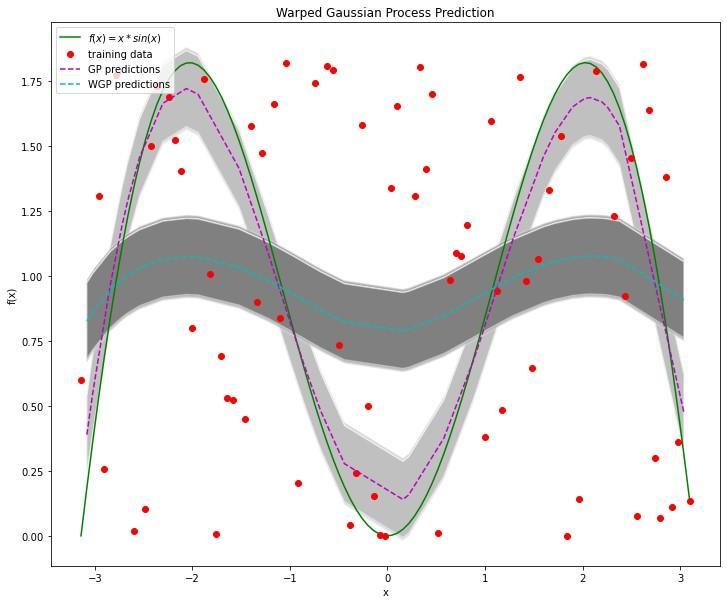
Chart-4:Resultsofanexampleusing f(x)= x∗sin(x):The WGPmethodbetteraccountsfornoise,leadingto improvedMAEandMSE.
3.1
For simplicity, I used a one-dimensional problem with a well-knownfunction.Inareal-worldscenario,boththeGP and WGP have parameters that will need to be tuned and investigated to determine what effect changing them has ontheanalysis.GPperformancecanalsobeinfluenced by choice of basis and kernel functions. Additionally, the warping function itself is something that has not been deeplyinvestigatedintheliterature.Thechoiceofapower warpingfunctionversusandradialbasisfunctionmaynot have much effect on MAE or MSE but would change the shapeofthefinaldistribution.Anotheravenuewouldbeto learnthewarpingfunctionfromthedatapriortoanalysis
to determine if an “ideal” function can be determined. Using WGP methodology should also be evaluated for overfitting. Accounting for noise can improve accuracy, but if the model is too reliant on training data it may not be usable on unseen data. Finally, one major drawback of WGP is the computational complexity, which was not evaluated here since the example was simple (the dataset contained105datapoints).

Data management and analysis is a key issue for the grid sincethepowergridhasalargemagnitudeofdiversedata associatedwithitsoperation.Figure1highlightstheareas where data collection can occur using different sensors. Thequantityanddiversityofthisdata suggeststhatthere willbenon-Gaussianrepresentations,non-Gaussiannoise, asymmetrical andnon-stationarydata,all ofwhichcanbe served by the flexibility and interpretability of WGP. This methodisunderutilizedinpowergridresearch
WGPisamethodwellsuitedtopowergridanalysisdueto its ability to model non-stationary, non-symmetric, nonGaussian data Given how crucial grid operations are to managing infrastructure, the interpretable nature of WGP is a strength. WGP has all the benefits of traditional GPs withtheadvantageofhigheraccuracysincethismethodis more adept at capturing noise. Incorporating this method into analysis for the Autonomous Intelligence Measurement Sensors and Systems (AIMS) project will
International Research Journal of Engineering and Technology (IRJET) e-ISSN: 2395-0056
Volume: 11 Issue: 06 | Jun 2024 www.irjet.net p-ISSN: 2395-0072
provide research opportunities for applications on a diversesetofreal-worlddata.
[1] E.Snelson,Z.Ghahramani,andC.Rasmussen,“Warped gaussianprocesses,”in AdvancesinNeuralInformation Processing Systems (S. Thrun, L. Saul, and B. Schoellkopf,eds.),vol.16,MITPress,2003.
[2] J. Maucher, “Gaussian process: Implementation in python.”GitHub,2022.
[3] A. Zhang, Z. C. Lipton, M. Li, and A. J. Smola, Dive into Deep Learning. Cambridge, United Kingdom: CambridgeUniversityPress,2023.
[4] C. E. Rasmussen and C. K. I. Williams, Gaussian Processes for Machine Learning. Cambridge, MA: MassachusettsInstituteofTechnology,2006.
[5] E. P. R. Institute, “Sensor technologies for a smart transmissionsystem.”AnEPRIWhitePaper,2009.