
International Research Journal of Engineering and Technology (IRJET) e-ISSN: 2395-0056
Volume: 11 Issue: 06 | Jun 2024 www.irjet.net p-ISSN: 2395-0072
International Research Journal of Engineering and Technology (IRJET) e-ISSN: 2395-0056
Volume: 11 Issue: 06 | Jun 2024 www.irjet.net p-ISSN: 2395-0072
Peter Fuhr1 , Elizabeth Piersall2 , Gary Hahn3, Jason Richards3
1Distinguished Scientist, Oak Ridge National Laboratory, Oak Ridge, TN 37831 USA
2Research Scientist, Oak Ridge National Laboratory, Oak Ridge, TN 37831 USA
3Technical Professional, Oak Ridge National Laboratory, Oak Ridge, TN 37831 USA ***
Abstract - A system for detecting radio frequency (RF) signals using a set of four software defined radio (SDR) detectors with directional antennas and then displaying them in a visual heatmap manner is described. With the directional antennas pointing in differing (but slightly overlapping) directions, a 1 MHz bandwidth frequencybandwithinthe902928 MHz spectrum is chosen for analysis. The outputs from the SDRs are measured and analyzed from which an intensity/color variable structured light pattern is generated. The four light patterns, one for each directional SDR, are arranged in a four-quadrant pattern and overlaid by a visual image of the RF measurement location. The system may be mounted on a drone thereby providing RF signal direction finding from an aerial platform. A description of this design, which is constructed based on a combinationofopticalandRF techniques and technologies is described. The net result being an Enhanced Reality (ER) view of signals in selected radio frequencies with integration within the Autonomous IntelligenceMeasurement Sensors andSystems (AIMS)project.
Key Words: software defined radio, drones, sensors, structuredlight
1.INTRODUCTION
Radio frequency (RF) signals may be converted into visible optical representation through the use of a combinationofdirectionalantennae,RFdetectors,Software DefinedRadios(SDRs)andmathematicalsignalprocessing. Directionality is achieved in the following manner: each directionalantennaarrangedinamatrix/arraysubtendsan anglethat is identical toits array“neighbors1”but eachis pointing in slightly different directions due to the (machined/printed) antenna mounts. Algorithmic
1 IdenticalRFantennasareused–thereforewithidenticalfieldsof-view(radiationpattern). Eachantennaispointinginaslightly differentdirectionthantheothers
processing allows for varying the tunable SDRs thereby havingthecapabilitytoscanradiofrequencies.Inaddition, the microprocessor acquires the signal strength readings from each SDR, then records those values into an NxN matrix. The radio signal level of each matrix element is mappedtoasignallevelthatisusedtosettheintensityand wavelengthof anarrayofLEDs(orsimilarlightsource).
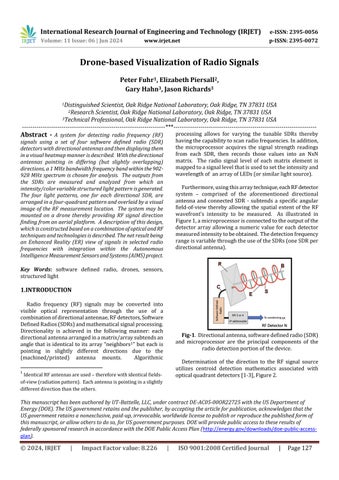
Furthermore,usingthisarraytechnique,eachRFdetector system – comprised of the aforementioned directional antenna and connected SDR - subtends a specific angular field-of-view thereby allowing the spatial extent of the RF wavefront’s intensity to be measured. As illustrated in Figure1,amicroprocessorisconnectedtotheoutputofthe detector array allowing a numeric value for each detector measuredintensitytobeobtained. Thedetectionfrequency rangeisvariablethroughtheuseoftheSDRs(oneSDRper directionalantenna).
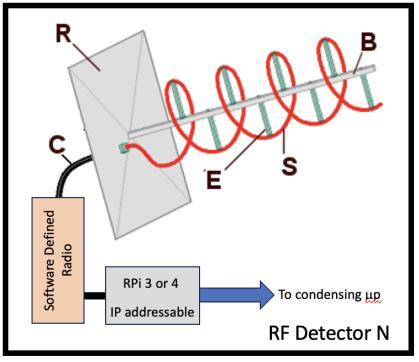
Determination of the direction to the RF signal source utilizes centroid detection mathematics associated with opticalquadrantdetectors[1-3],Figure2. and microprocessor are the principal components of the radiodetectionportionofthedevice.
This manuscript has been authored by UT-Battelle, LLC, under contract DE-AC05-00OR22725 with the US Department of Energy (DOE). The US government retains and the publisher, by accepting the article for publication, acknowledges that the US government retains a nonexclusive, paid-up, irrevocable, worldwide license to publish or reproduce the published form of this manuscript, or allow others to do so, for US government purposes. DOE will provide public access to these results of federally sponsored research in accordance with the DOE Public Access Plan (http://energy.gov/downloads/doe-public-accessplan).
© 2024, IRJET | Impact Factor value: 8.226 | ISO 9001:2008 Certified Journal | Page127
Volume: 11 Issue: 06 | Jun 2024 www.irjet.net p-ISSN: 2395-0072
. Opticalquadrantdetectioncentroiddetermination.
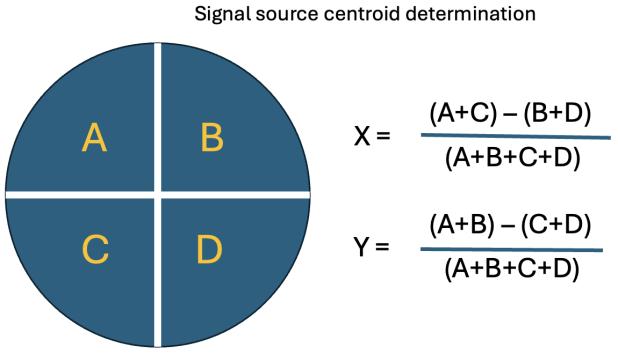
Figure3ismeanttoillustratehoweachantennahasan identical"fieldofview"butispointinginauniquedirection. Inaddition,aninterfacedcamerahasthecenterofitsfieldof viewalignedwiththecenter(intersectionpoint)oftheRF antennas. Thisarrangementprovidesanenhancedreality viewoftheRFmeasurementswithaviewastowherethe systemis"looking".
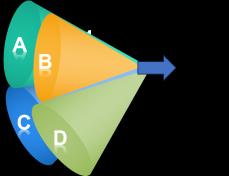
Fig-3. Directionalantennaeandcompanionvisible camerafieldsofview.
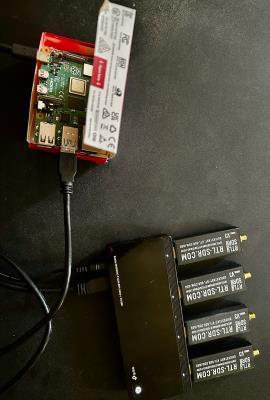
The proof-of-principle system utilized four directional antennasandtheirassociatedRTL-SDRV3s. Initially,each SDR was interfaced to a Raspberry Pi in a one-to-one correspondence, Figure 4.a. Initial testing incorporated directionalantennasthatweretunedoutsideoftheSDRs'RF tuning range (500 kHz - 1.7 GHz). The Yagi antennas in Figure 4 provided 10dB gain across the 2.355 - 2.6 GHz frequency range. Placement of the antennas into a Styrofoam disc, Figure 4.b, allowed for prototype-level determinationoftheantennaemechanicalanglestoachieve the slight radiation/detection pattern overlap shown in Figure3.
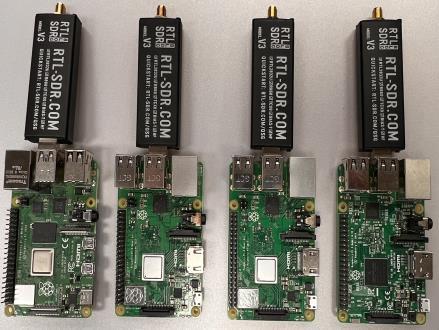
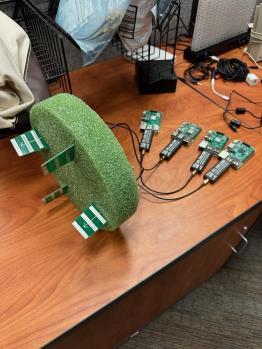
Fig-4. (a)Initialhardwareconfiguration. (b)Directional antennasmountedinaStyrofoamdisc.
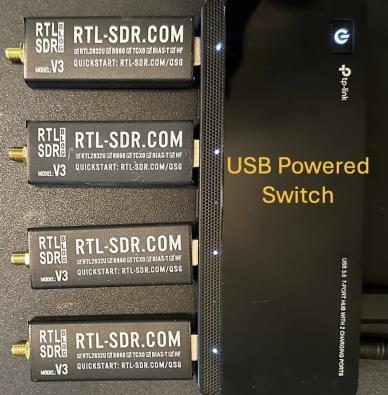
Initialsystemtrialsindicatedthatthesoftwareusedforthe SDRsignalprocessingwasrelativelycomputationally"light". Therefore, the hardware configuration was modified with only one RPi being used2, Figure 5. Note that the power requirementsforeachSDR,270-280mAat5V,necessitated use of a four-port powered USB switch and a single RPi (350mA,1.9W).(again,Figure5).
The output from the set of RF detectors is read using the rtl_power utility that comes with the librtlsdr library. An RMS value is calculated from the FFT measurements provided from rtl_power each second. Centroid determinationisperformedusingeachdetector/quadrant's RMSvalueintheequationshowninFigure2. TheRMSis then normalized to the range 0 to 1 to map the signal strength to a heat map palette color. The RPi then sequentiallystepsthroughtheRFsignalarray(inthiscase
2 ThisreductioninnumberofRPi'shadtheassociatedbenefitof reducingthepowerrequirementsaswellaspackagingofthe componentsbothofwhichimpacted(simplified)the"package" mountedonthedrone.
International Research Journal of Engineering and Technology (IRJET) e-ISSN: 2395-0056
Volume: 11 Issue: 06 | Jun 2024 www.irjet.net p-ISSN: 2395-0072
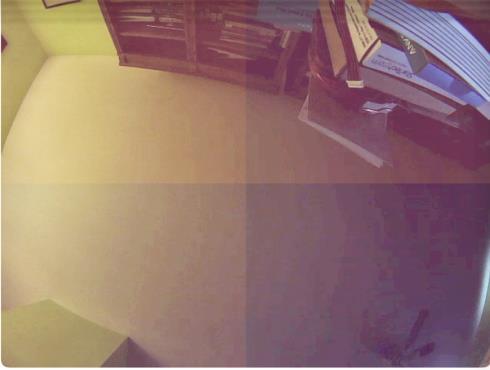
2x2)mappingthenormalizedRMSdetectorsignallevelto theassociatedheatmapcolor,Figure6. Theresultantoptical fieldrepresentsthesignalstrengthoftheRFsignalwhichis a visual representation of the invisible RF field. Figure 7 presents a quadrant RF heatmap overlaid onto a visible cameraimage.
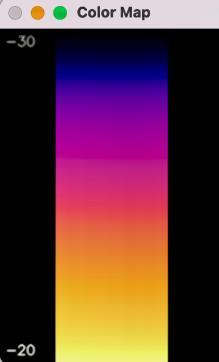
Fig-6. Heatmapcolorpalette(signalstrengthrepresented hereasalogarithmicsignalrangeof-20to-30dBm).
Analternativemethodistousethesoftwareapplicationgqrx 2.17. Thiswasusedtoconfigureandretrievemeasurements from the SDRs. While gqrx has numerous visualization options,onlyitsanalysiscapabilitieswereused. Specifically, aFastFourierTransform(FFT)of16384datapointswitha residual bandwidth of 109.9 Hz with a Hamming window was used for calculation of the maximum power in the frequencyrangeofinterest(inthiscase906-907MHz).
Inthisconfiguration,theUSBvisualcamerawasattachedto the RPi with image streaming via RTSP to the application Shinobi using gstreamer. While seemingly complex, this overall multi-application software system had minimal impactontheRPi’sCPU/memory. Theresultisanimageof the received RF signal strength with the frequency being scannedvariable.
AstandaloneShinobinetworkvideorecorder(NVR)server isusedtoprovideforconfigurationanduseoftheenhanced realityvideoimage(visibleplusquadrantRFheatmaps).For easeofuse,Shinobihandlesthedifferent“monitors”foreach
ofthecamerastreams.AsanNVR,theapplicationcanalso perform functions such as automatically recording video clips, motion detection, snapshots, etc. One issue encounteredwiththissoftwarearrangementisthatthereis afewmillisecondsdelayontopofwhateverlatencythatis associated with the original camera stream if you are watching “live” through Shinobi. Note that the RF RPi outputs two streams. One is the USB visual camera RTSP stream.Theheatmapisusedasanoverlayonthisstreamto generateanewMJPEGstream.3Analternativelytowatching the streams via Shinobi is to view in a browser or VLC thereforehavingslightlylessdelay. Theapplicationprocess is:
RFPi->MJPEGstream(heatmap+visualcamera)->Shinobi ->RTSPstream(visualUSBcameraonly)
Relying on IP addressing and assigned ports allows for accessingthecamerastreamsinthefollowingmanner: CamerasRPi(hostname"rpi-cameras"): rtsp://<IP_Address>:8554:/visual rtsp://<IP_Address>:8554:/thermal rtsp://<IP_Address>:8554:/uv
RFRPi(hostname"rpi-rf"): http://<IP_Address>:8083
Applicationsrelyonusername+passwordauthenticationfor amodicumofcybersecurity.
HavingdemonstratedthevisualizationofRFsystemusinga static, stationary system, the next step was to deploy the systemelementsonadrone(mobileplatform).Theprincipal elements used in the drone mounted, but stationary, 2x2 proofofconceptsystemconfigurationwere:
(1)RTL-SDRstunedtoa1MHz"range",906-907Hz(tunable frequencyrange:500kHz-1766MHz);
(2) antennae frequency range: 2335-2600 MHz with an antennagain:10.5dB(typicalvalue).
Themismatchbetweenscannedfrequencyandtheantenna frequencypassbandwasnotedbutdidnotaffectthesystem operations. The system shown in Figure 8 is based on a HolyBroX500V2(kit)drone. Theantennasusedwerefor verificationoftheradiationpatternsaswellasdroneflight stabilitytestingwiththeantennamountingarrangement.
3 DevelopmentofanRTSPinterfaceandaccessmethodis underway. Thisshouldlessenoreliminatethelatencyanddelay issues.
Volume: 11 Issue: 06 | Jun 2024 www.irjet.net p-ISSN: 2395-0072
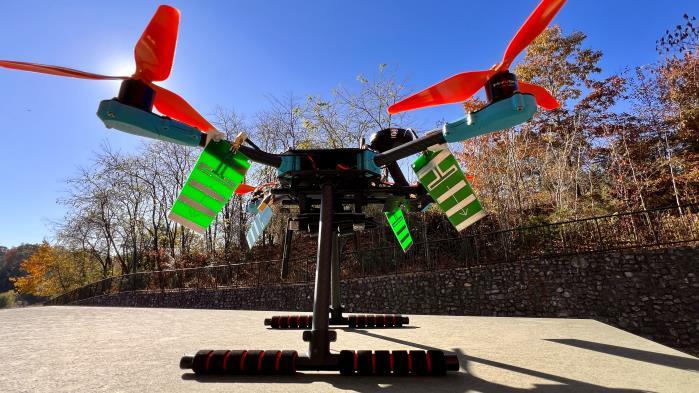
Fig-8. Dronemountedsystem.
Withthosetestscompleted,TAOGLASantennas4-optimized forthe906-907MHzfrequencyband-alongwiththefour RTL-SDRsandsystembatterieswereattachedtothedrone, Figure9
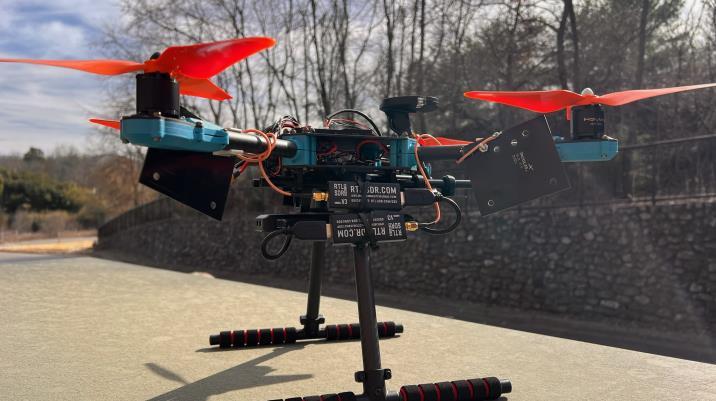
Fig-9. ConfigureddronewithSDRsandassociated components.
Operation of the system necessitated a Wi-Fi network providingwirelesscoverage5 withinwhichthedroneflew. Withoverlaidheatmapvisualizationformedusingthedronemounted RPi (edge processing), a ground-based laptop accessedtheRPiviaIPaddressing. Throughthisnetwork configuration the laptop displayed the measurements in real-timeasthedroneflewaroundthetestarea,Figure10
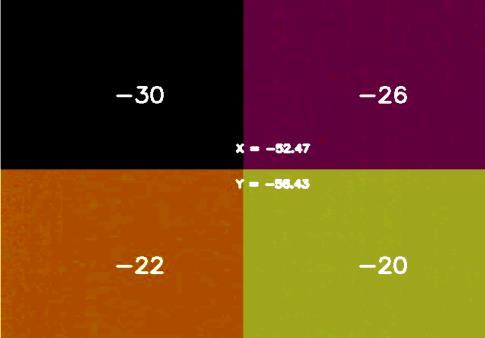
Fig-10. RFsignalstrengthlevelsforeachzone.
Varying RF signal strength in the four antennas' radiation pattern (acceptance solid angle) and use of centroid determination(equationsinFigure2)resultsinthediffering colorsperzone. Thecentroidlocations(relativetothe2x2 detection "size") are also displayed. Note that the signal strengths are in decibels relative to 1 mWatt. Therefore, zoneD,withasignalstrengthof -20dBmisstrongerthan zoneA(-30dBm).
5. Summary
Asystemtoprovideaerialmeasurements/scansofRFsignal sources has been developed. The RF signal levels are processed resulting in a graphical display of the signal strengthascolors. Thiscolorfulheatmapisoverlaidontoa camera stream to provide a view of what area is being scanned. Performance verification took place within a laboratory-basedenvironment.Themeasurementsystem wasthenintegratedontoadroneplatform,seeFigure11, performancevalidatedwithotherAIMSsystems,aswell asin-fieldatanelectricutility'ssubstation.
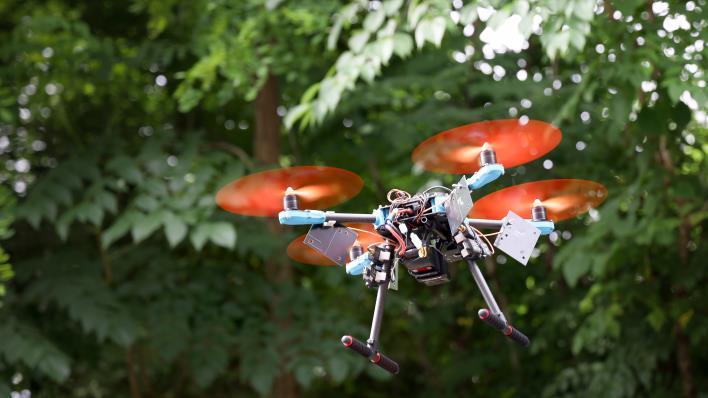
Fig-11. TheAIMSSDRRFmeasurementandvisualization system,dronemounted.
4 TheTAOGLASantennasareblackandrectangularinshapein Figure9.
5 similar to an umbrella
[1] Y Zheng, H. Chen and Z Zhou, "Angle measurement of objects outside the linear field of view of a strapdown semi-active laser seeker", Sensors 2018, 18, 1673; doi:10.3390/s18061673
International Research Journal of Engineering and Technology (IRJET) e-ISSN: 2395-0056
Volume: 11 Issue: 06 | Jun 2024 www.irjet.net p-ISSN: 2395-0072
[2] L. Zhang, Y. Yang, W. Xia,; X. Zhu, W. Chen,; Y. Lu, "Linearity of quadrant avalanche photodiode in laser tracking system". Chin. Opt. Lett. 2009, 7, 728–731.
[3] Chen, M.; Yang, Y.; Jia, X.; Gao, H. "Investigation of positioning algorithm and method for increasing the
[4] linear measurement range for four-quadrant detector". Optik Int. J. Light Electr. Opt. 2013, 124, 6806–6809.
© 2024, IRJET | Impact Factor value: 8.226 | ISO 9001:2008 Certified Journal | Page 131